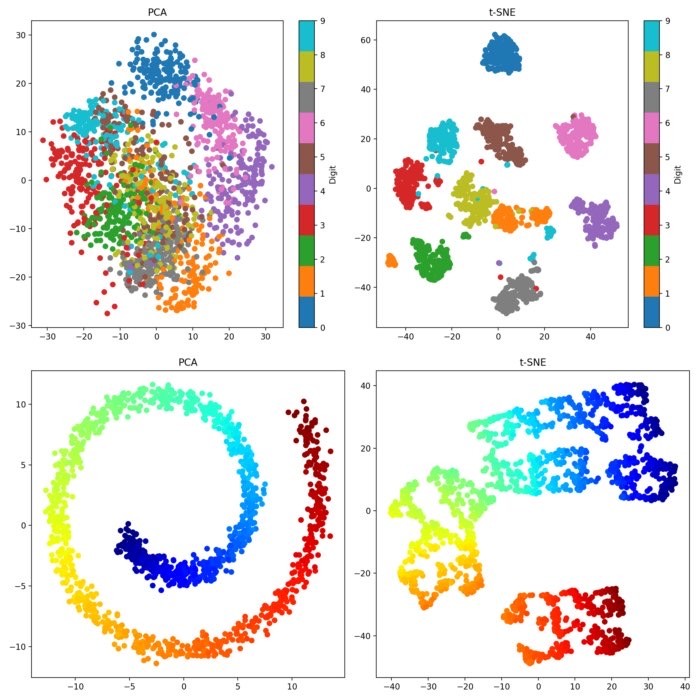
#TSNE

Karsten Schmidttoxi@mastodon.thi.ng
2025-06-03

#ReleaseTuesday — New version of thi.ng/tsne with ~15-20% better performance[1] due to avoiding repeated internal allocations and skipping gradient updates where unnecessary...

[1] Benchmarked with multiple datasets of ~750 items, each with 192 dimensions (now ~165ms @ MBA M1, 2020)...

#ThingUmbrella #TSNE #DataViz #Visualization #ML #Cluster #TypeScript #JavaScript

2025-04-03

my #tsne in #futhark (compiled to Python) iteratively spreading 10dimensional-clustered data (easy mode) into 2dimensions

it's not as fast as I hoped. In part because I'm not good at futhark yet, and in part because the Python target may not be optimized, however it's _fun_.

Based on "Visualizing Data using t-SNE" (Laurens van der Maaten and Geoffrey Hinton).

(click or leave your pointer on the image, 1, 5, 10, 15, and 25 iterations)

2024-11-18
2024-10-21

Может ли простейшая нейросеть найти математическую закономерность в данных?

В этой небольшой статье мы научим нейросеть решать задачу умножения перестановок длины 5 (группа ) и визуализируем результаты обучения с помощью методов проекции t-SNE (с понижением размерности PCA) и алгоритма UMAP. Мы убедимся в том, что даже элементарная модель может "неосознанно" провести бинарную классификацию перестановок.

habr.com/ru/articles/851214/

#перестановки #переобучение #нейросеть #tsne #визуализация

2024-06-12

Как анализировать тысячи отзывов с ChatGPT? Частые ошибки и пример на реальных данных

В этой статье я расскажу про свой опыт решения рабочей задачи — анализ отзывов о компании от пользователей. Мы разберем возможные ошибки и посмотрим на пример кода и реальных данных. Гайд будет полезен всем, у кого нет большого опыта в анализе данных или работе с LLM через API.

habr.com/ru/articles/821287/

#llm #gpt #chatgpt #python #clustering #kmeans #tsne #visualization #summarization #data_analysis

Patrick Cherrypcherry@fosstodon.org
2024-06-03

“Biostatistician Rafael Irizarry… dislikes many of the t-SNE and UMAP plots he sees. They offer little of value to a paper, he says, and the output from these tools is analytically intractable.”

nature.com/articles/s41592-024

#PCA #UMAP #tSNE

New features in the mapdata.py data exploration tool (pypi.org/project/mapdata/) include:

1. Rank abundance plots. This visually displays species richness, evenness, and dominance for one or more sites.

2. Toggling of correlation coefficients in the correlation matrix so that a clean heatmap can be displayed.

3. Exclusion of missing data from t-SNE and UMAP analyses either case-wise or variable-wise.

#DataAnalysis #Ecology #Statistics #Correlation #UMAP #tSNE #Python #FOSS #FLOSS

An illustrative rank abundance plot, with the rank of species abundance (1 = most abundant) on the X axis and the log of relative abundance on the Y axis.  Five locations are shown, illustrating different richness (maximum rank), evenness (flatness of the curve), and dominance (initial steepness of the curve).An illustrative correlation matrix (for 15  PAH compounds) that has had the display of numerical correlation coefficients toggled off, so that it shows only the heatmap colors.
Harald KlinkeHxxxKxxx@det.social
2024-02-21

The difference between mapping an n-dimensional feature space to three or two dimensions.

Source: lvdmaaten.github.io/tsne/ #tsne

Harald KlinkeHxxxKxxx@det.social
2024-02-13

I celebrate this! 😀
#Rstats #tSNE #MoMA

Harald KlinkeHxxxKxxx@det.social
2024-01-25

By the way this is the original article that presents t-SNE. Published 11/2008
jmlr.org/papers/volume9/vander
T-distributed stochastic neighbor embedding (t-SNE) is a statistical method for visualizing high-dimensional data in 2 or 3 dimensions.
#DataVisualization #tSNE #MachineLearning #DimensionalityReduction #DataScience #AI #DataAnalysis #DataAnalytics

Paul Harrisonpfh@mastodon.online
2023-12-28

I made a short video of the strange things UMAP and t-SNE can do to your data. The algorithms are shown mostly working as intended, yet with some surprising consequences.

#umap #tsne #scrnaseq #wtf

youtube.com/watch?v=gwqU9OoFwj

2023-11-17

"certain kinds of important high-dimensional geometric features are, unfortunately, mathematically impossible to represent in the 2D Euclidean plane, no matter what method is used, leading to distorted visualizations and missed geometric, and potentially biological, insights at both local and global scales."

Wang et al. What cannot be seen correctly in 2D visualizations of single-cell ’omics data? Cell Syst. 2023 Sep 20;14(9):723–731. DOI: doi.org/10.1016/j.cels.2023.07

#genetics #tSNE #UMAP #omics

2023-11-09

Use of t-SNE and #UMAP is increasing in biology! So I wonder how stochasticity of both the algorithms affect how we interpret the results? Can somebody enlighten? (#tSNE at least makes it clear in its acronym that it is stochastic)

Gautam Shirsekarshirsekar@genomic.social
2023-11-09

Use of t-SNE and #UMAP is increasing in biology! So I wonder how stochasticity of both the algorithms affect how we interpret the results? Can somebody enlighten? (#tSNE at least makes it clear in its acronym that it is stochastic)

C. Harris Floudaschfloudas@mstdn.social
2023-01-18

RT @LabListon@twitter.com: We have an exciting #computational paper out in @CellRepMethods. Ever use a #tSNE or #UMAP in #scSeq, #flowcytometry or #masscytometry? It doesn't have to be just a pretty picture anymore - we've developed a statistical test to check for differences. 1/6

cell.com/cell-reports-methods/ twitter.com/LabListon/status/1

Client Info

Server: https://mastodon.social
Version: 2025.04
Repository: https://github.com/cyevgeniy/lmst