@gabrielesvelto Some background about the ship that is being sent for rescue https://scicomm.xyz/@kajord/110577891785318178
Raphael Grandin
Associate Professor of Geophysics (Solid Earth) at IPGP/UPC. Posting about #InSAR #volcanoes #earthquakes #EO #satellites.
@kipuka :ablobsmile:
Just a random volcano, seen by a random satellite, in a random false-color composition.
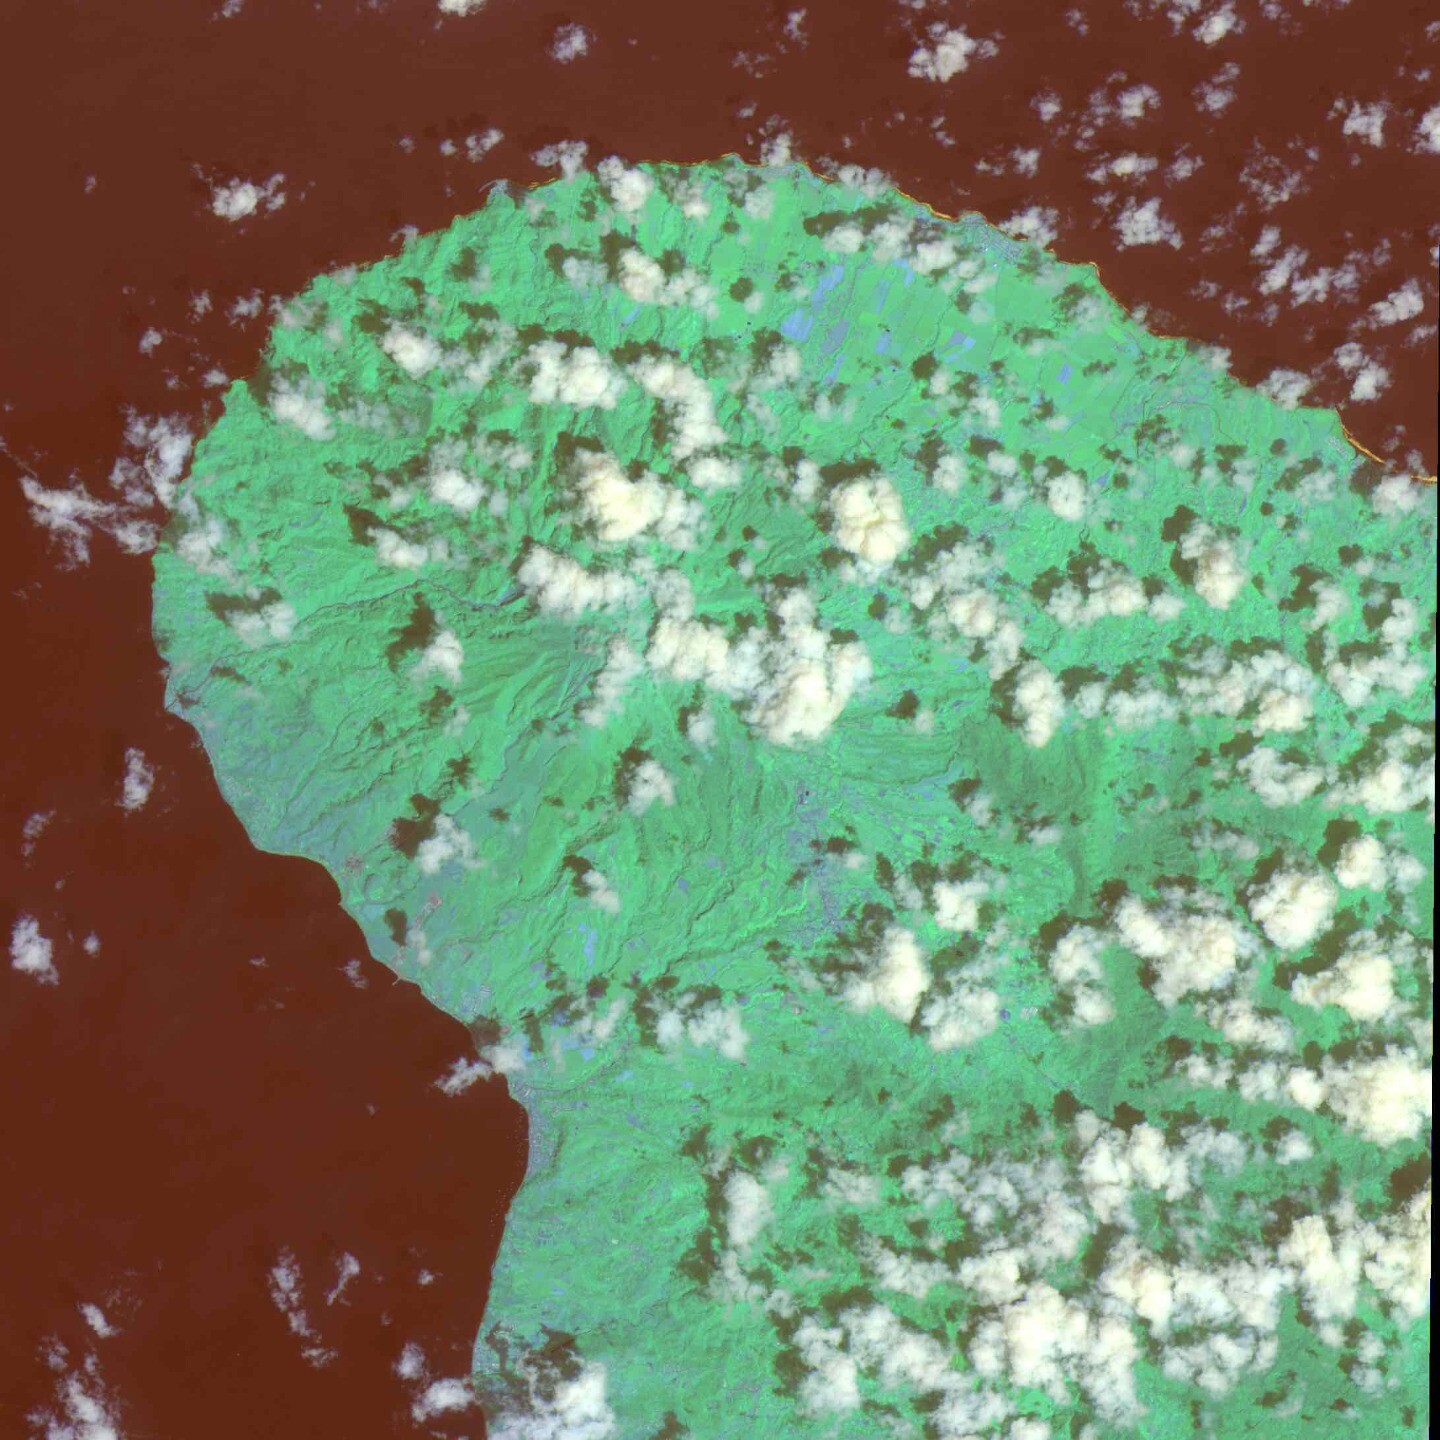
This #Sentinel3 #satellite 🛰️ image shows the impact of the 15 Jan 2022 Hunga #Tonga #volcano #eruption 🌋 on ocean 🌊 color 🌈 . The image was acquired ~ 24 hours after eruption. Anomaly is here shown in terms of "suspended matter", derived from measurements of the OCLI instrument . It is caused by ash fallouts from the volcanic eruption. In the following days, the anomaly gets dispersed by winds and oceanic currents.
Data: (C) #ESA-#Copernicus / #EUMETSAT
Raphael Grandin boosted:
On 21. April the #WMO (World Meteorological Organization) released their "State of the Global Climate 2022" annual report. There is no good news at all for the #climate; the #ClimateCrisis is in full-swing. If you've not read the report, you should. You can download it from a link here -
https://public.wmo.int/en/media/press-release/wmo-annual-report-highlights-continuous-advance-of-climate-change
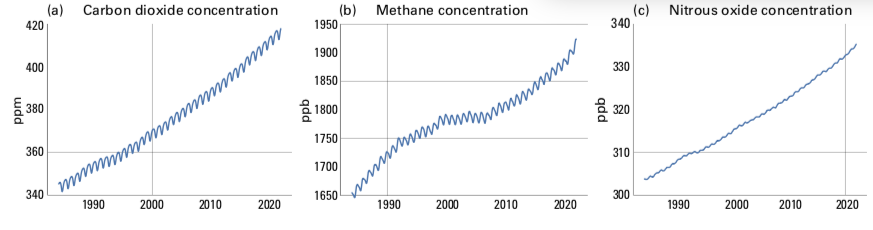
Here are the "highlights" (lowlights) from the "Key Messages" section of the WMO report. There are many excellent graphics in the report; I've only highlighted one of them here.
#GHG - Concentrations of the three main greenhouse gases – carbon dioxide #CO2, #methane and #NitrousOxide – reached record highs in 2021, the latest year for which consolidated global values are available (1984–2021).The annual increase in methane concentration from 2020 to 2021 was the highest on record. Real-time data from specific locations show that levels of the three #GreenhouseGases continued to increase in 2022.
#Ocean heating - Around 90% of the energy trapped in the climate system by greenhouse gases goes into the ocean. Ocean heat content, which measures this gain in energy, reached a new observed record high in 2022.
#MarineHeatwave - Despite continuing La Niña conditions, 58% of the ocean surface experienced at least one #marine #heatwave during 2022. In contrast, only 25% of the ocean surface experienced a marine cold spell.
#SeaLevelRise - Global mean sea level continued to rise in 2022, reaching a new record high for the satellite altimeter record (1993–2022). The rate of global mean sea level #MSL rise has doubled between the first decade of the satellite record (1993–2002, 2.27 mm per year) and the last (2013–2022, 4.62 mm per year).
#Glacier melting - In the hydrological year 2021/2022, a set of reference glaciers with long-term observations experienced an average mass balance of −1.18 metres water equivalent (m w.e.). This loss is much larger than the average over the last decade. Six of the ten most negative mass balance years on record (1950– 2022) occurred since 2015. The cumulative mass balance since 1970 amounts to more than −26 m w.e.
#Drought in #WetSeason, #food insecurity - In East #Africa, rainfall has been below average in five consecutive wet seasons, the longest such sequence in 40 years. As of August 2022, an estimated 37 million people faced acute food insecurity across the region, under the effects of the drought and other shocks.
#Flooding - Record-breaking rain in July and August led to extensive flooding in #Pakistan.There were at least 1 700 deaths, and 33 million people were affected, while almost 8 million people were displaced. Total damage and economic losses were assessed at US$ 30 billion.
#Heatwave - Record-breaking heatwaves affected #China and #Europe during the summer. In some areas, extreme heat was coupled with exceptionally dry conditions. Excess deaths associated with the heat in Europe exceeded 15 000 in total across #Spain, #Germany, the United Kingdom #UK#, France and #Portugal
Raphael Grandin boosted:
Reste avec nous
« Je reviens de Sainte-Soline… Il y a ton corps qui se convulse dans les bras des medics.
Il y a cette femme médecin qui appelle le SAMU au téléphone, SAMU qui ne vient pas … ». Publication d’un texte bouleversant, fort, nécessaire. Pour « le respect du vivant ». Pour « que nos larmes ne remplissent pas leurs bassines ».
https://blogs.mediapart.fr/pascal-maillard/blog/290323/reste-avec-nous
@thepoliticalcat @Havenite @VCWillow @skybrian @Bongolian in *THE* France (dans *LA* Froonnce). Loïc help me please https://www.tiktok.com/@loicsuberville/video/6987832588786208006
@thepoliticalcat @Havenite @VCWillow @skybrian @Bongolian For most french speakers, the slant meaning of "canard" (the translation of "duck") would be a "journal" (a "newspaper"). It's part of the name of the famous journal "Le Canard Enchaîné", one of the few independent journals in the France (independent of large corporate-owned press groups).
Raphael Grandin boosted:
The toll of the disastrous Türkiye & Syria #earthquake has reached ~33,000 casualties
According to @CopernicusEMS , more than 4,000 🏘️have been damaged
⬇️Land deformation interferogram generated using #Sentinel1 🇪🇺🛰️ radar data from 28 January & 9 February
🐦🔗: https://n.respublicae.eu/defis_eu/status/1625102691008405504
Raphael Grandin boosted:
RT @ESA_EO: An interferogram showing the coseismic surface displacement in the area near #Gaziantep, generated from multiple @CopernicusEU #Sentinel1 scans – before & after the Türkiye–Syria earthquakes.
It reveals a large-scale deformation between Maras and Antakya: https://www.esa.int/Applications/Observing_the_Earth/Satellites_support_impact_assessment_after_Tuerkiye_Syria_earthquakes
🐦🔗: https://n.respublicae.eu/CopernicusEU/status/1625133461689274368
Raphael Grandin boosted:
@Anthro Here's a screenshot. Is this Harry?
Client Info
Server: https://mastodon.social
Version: 2025.04
Repository: https://github.com/cyevgeniy/lmst