#LifeHistory

2025-04-16

#30DayChartChallenge Día 16: Negative Relationship FOUND! 📉🐍🐦🐢🐟

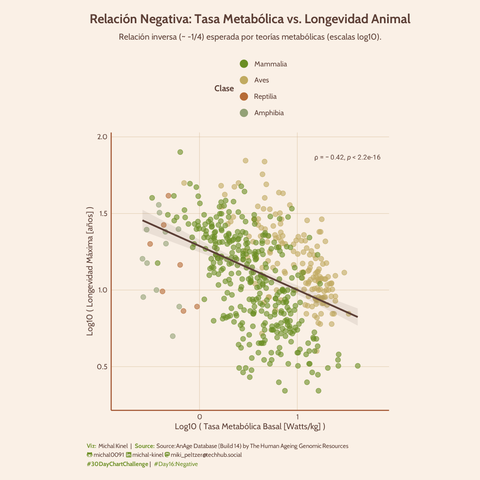
¡Lo conseguimos! Tras ajustar por masa corporal, la relación entre Tasa Metabólica Específica (W/kg) y Longevidad Máxima (años) en ~530 especies animales (AnAge DB, outliers quitados) SÍ es negativa (Pearson ρ ≈ -0.42, p < 2.2e-16). #RelationshipsWeek #Animals

El gráfico log-log muestra la tendencia: mayor intensidad metabólica por kilo se asocia con vidas más cortas. ¡Apoya la idea del "ritmo de vida"! 🔥➡️⏳ Colores por Clase Taxonómica.

Un recordatorio de la importancia de normalizar variables y limpiar datos para ver la señal correcta. ¡Ciencia en acción!

🛠 #rstats #ggplot2 #ggpubr | Data: AnAge | Theme: #theme_week3_animals
📂 Código/Viz: t.ly/ouLN0

#Day16 #Negative #dataviz #DataVisualization #Ecology #LifeHistory #Metabolism #Longevity #AnAge #ggplot2 #RStats #Science

Scatter plot log-log mostrando la relación entre Longevidad Máxima (años, eje Y) y Tasa Metabólica Basal Específica (Watts/kg, eje X) para 534 especies animales (outliers eliminados). Los puntos están coloreados por Clase taxonómica (Mammalia, Aves, Reptilia, Amphibia). Una línea de regresión lineal de color marrón oscuro con intervalo de confianza gris muestra una clara tendencia negativa. El coeficiente de correlación de Pearson (rho = -0.42, p < 2.2e-16) se muestra en la esquina superior derecha. El gráfico utiliza un tema con fondo beige claro y textos en marrón. Fuente: AnAge Database.
2025-04-14

#30DayChartChallenge Día 14: Kinship! 🌿 Hoy toca visualizar "parentescos" animales, pero basados en ¡similitud de rasgos! #RelationshipsWeek #Animals

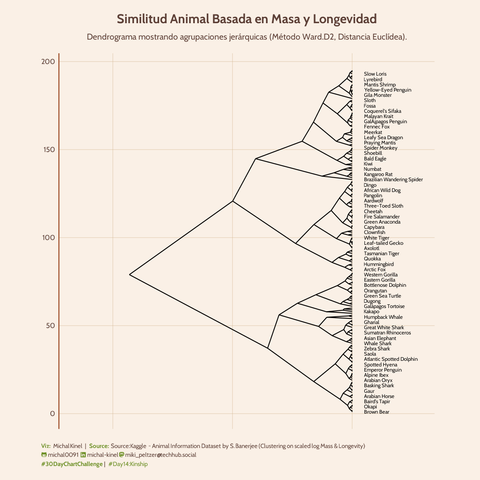
Este dendrograma horizontal es el resultado de un clustering jerárquico (hclust Ward.D2) sobre ~170 especies, usando su Masa Corporal y Longevidad Máxima (log-transformadas y escaladas). ¡Muestra quién se agrupa con quién según su estrategia de vida!

Las ramas unen las especies más similares. La longitud horizontal hasta la unión indica cuán diferentes son. Se ven grandes grupos que separan, por ejemplo, animales muy grandes/longevos de otros más pequeños/rápidos. Es una forma de ver la estructura oculta en los datos de rasgos.

(Solo se muestra 1/3 de las etiquetas para no saturar!)

🛠 #rstats #ggplot2 #ggdendro #stats | Datos: Kaggle (S. Banerjee)
📂 Código/Viz: t.ly/Y_fwt

#Day14 #Kinship #dataviz #DataVisualization #Ecology #LifeHistory #AnimalTraits #Clustering #Dendrogram #ggplot2 #Kaggle

Dendrograma horizontal que visualiza el clustering jerárquico de aproximadamente 170 especies animales, basado en la similitud de su masa corporal y longevidad máxima (log-transformadas y escaladas). El árbol se ramifica de izquierda a derecha. Los nombres de las especies (un subconjunto) aparecen como etiquetas en las puntas de las ramas a la derecha. El eje vertical representa las especies/clusters, y el eje horizontal (superior, etiquetado como 'Altura') indica la distancia o disimilitud a la que se unen los clusters. El gráfico utiliza un tema con fondo beige claro y líneas/texto en marrón. Título: "Similitud Animal Basada en Masa y Longevidad". Fuente: Kaggle dataset by S. Banerjee.
2025-04-13

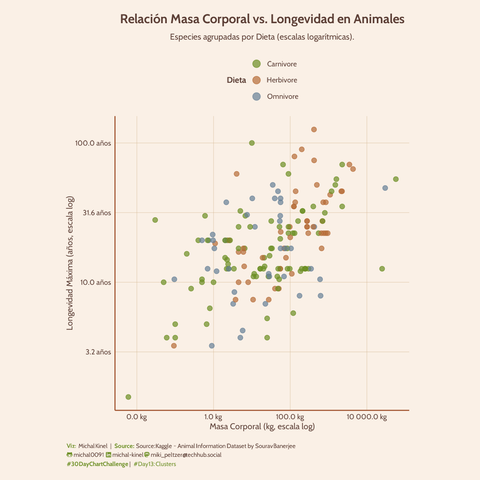
#30DayChartChallenge Día 13: Clusters Animales! 🐾 Explorando la relación Masa Corporal vs Longevidad Máxima. #RelationshipsWeek

Usando un dataset de Kaggle (+170 especies, ¡gracias S. Banerjee!) y tras una divertida limpieza de datos con rangos/unidades mixtas 😅, este scatter plot log-log revela patrones.

Coloreamos por Dieta: 🥩Carnívoro(verde) 🌿Herbívoro(ocre) ❓Omnívoro(azul).
Se ve la tendencia general (más grande = más longevo), pero los clústeres por dieta sugieren distintas **estrategias de historia de vida**. ¿Cómo gestionan su energía y longevidad según lo que comen? 🤔

¡Una visualización para explorar la alometría y la diversidad ecológica!

🛠️ #rstats #ggplot2 y mi nuevo tema #theme_week3_animals.
📂 Código/Viz: t.ly/ehPiu

#Day13 #Clusters #dataviz #DataVisualization #Ecology #Evolution #LifeHistory #AnimalTraits #Biodiversity #ggplot2 #Kaggle

Scatter plot log-log que muestra la relación entre la Longevidad Máxima (años, eje Y) y la Masa Corporal (kg, eje X) para aproximadamente 170 especies animales. Los puntos están coloreados según la dieta: verde para Carnívoro, naranja/ocre para Herbívoro y azul apagado para Omnívoro. Se observa una tendencia general positiva. Los puntos de diferentes dietas muestran cierta agrupación y solapamiento. El gráfico utiliza un tema con fondo beige claro y textos en marrón. Título: "Relación Masa Corporal vs. Longevidad en Animales". Fuente: Kaggle dataset by Sourav Banerjee.
American NaturalistASNAmNat@ecoevo.social
2025-03-11

Long-distance migration can be dangerous. A life history model by Ronald C. Ydenberg predicts differences in over-summering between similar sandpiper species because the mortality posed by predators differs between flyways. Read now ahead of print! journals.uchicago.edu/doi/10.1

#migration #lifeHistory #summering #sandpiper #mortality #predators #flyways

Radical AnthropologyRadicalAnthro@c.im
2025-01-05

Exciting new paper here assessing ages for #puberty onset and #menarche among #UpperPalaeolithic #huntergatherers (from Russia, Czechia, Italy).

'Our results revealed that while puberty had begun by 13.5 years of age for the majority of individuals, there was a lot of variability, with the adolescents from Arene Candide (AC1 and AC16), both aged around 16 years when they died, taking several years longer to progress through puberty than their peers. Assessing the age of menarche was challenging due to the paucity of female adolescents, but based on the available evidence, it appears to have occurred between 16 and 17 years of age. For some, full adulthood had been achieved by 17–22 years, similar to the patterns seen in modern wealthy countries and in advance of historic populations living in urbanized environments.'

#adolescence #lifehistory #humanevolution #anthropology #archaeology #burials

sciencedirect.com/science/arti

Radical AnthropologyRadicalAnthro@c.im
2024-11-22

😢loss of old wise animals -- devastating to their social systems

'Earth's old animals are in decline. Despite this, emerging research is revealing the vital contributions of older individuals to cultural transmission, population dynamics, and ecosystem processes and services. Often the largest and most experienced, old individuals are most valued by humans and make important contributions to reproduction, information acquisition and cultural transmission, trophic dynamics, and resistance and resilience to natural and anthropogenic disturbance.These observations contrast with the senescence-focused paradigm of old age that has dominated the literature for over a century yet are consistent with findings from behavioral ecology and life-history theory. Here, we review why the global loss of old individuals can be particularly detrimental to long-lived animals with indeterminate growth, increasing reproductive output with age, and those dependent on migration, sociality and cultural transmission for survival.'

#lifehistory #culturaltransmission #memory

science.org/doi/10.1126/scienc

American NaturalistASNAmNat@ecoevo.social
2024-11-21

Read now ahead of print! "Life History Modulates Effects of Inducible Defenses on Consumer-Resource Dynamics" by Mutz & Abbott
journals.uchicago.edu/doi/10.1

#consumerResourceDynamics #lifeHistory #defense

2024-09-29

Space rockets and bicycles

The 6th of my 60 day life history series each day a year of my 60 on the planet.Its 1969 when I saw fuzzy black & white images of the Moon landing.
"One small step for man one giant leap for mankind" Neil Armstrong
Bowie's Space oddity evokes the times.
Meanwhile I was falling off my bike in the street. ' tbc..
#Musictrax4life #SciFi #quotes #inspiration #music #lifehistory
open.spotify.com/track/0jKcBqN

2024-09-28

#IntroductionPost #aboutme #lifehistory

TL;DR: read my profile bio jeez

"Gifted child" turned into terminally online sonic fan, who eventually jumped ship to furry fandom for... uh... many reasons. At least they taught me to read and somewhat speak English!

Always liked being able to customize games and experiences, from age 10 I started by replacing sprites in GBA games and modifying Gamemaker games. This turned into an affinity for tech and programming, as I saw it as sort of our world's version of magic (Write a spell and your magic box will do it kinda thing)

Throughout highschool I got to learn how to work different workshop tools for carpentry, as well as more coding-related stuff like coding in C for arduinos and building simple mobile apps for our "science-fair".

Towards the end of highschool, the oculus dk1 was announced, and I got stupidly hyped about the idea of VR. So much so in fact that I ended up building my own google cardboard before google cardboard! It was terrible and laggy, but a phone, some wood and a wiimote/airmouse was enough to fool VR demos into working! Thus began a mixed hobby-career of art and tech.

I was drawing a lot in class, and by the time I started uni I had a drawing tablet and some decent enough skills to see all that I could learn. When I got hooked into VR, that energy went into 3D modelling: I saw that JanusVR (cool 3d web browser prototype!) supported custom playermodels and a week flew by me just learning to stitch together pieces of models downloaded from the internet. I had my first furry 3d avatar, and it was gloriously crunchy, but it was mine.

During uni I studied what you would expect a CS major to learn, and got into making little ESP projects + a bunch of scripting for setting up machines to be servers because docker + winXP is a no go lol. I enjoyed my time there, but it always felt like I was being shoved into Web Development.

And that's exactly what I've worked as for 4 years, a fullstack web dev. It's been a wild ride, but I still continued to enjoy my artistic hobbies, and ended up even making commissions for VRChat avatars! I keep remaking my own 3D model like a fursuiter keeps improving their main suit (or making more), so I'm always changing a little bit. Very happy with my current iteration.

I have a nice long story about trying to flee my country and working in Japan, but that would make this post way longer than it already is, so just know that I've had to look for a job back home again for 6 months, and at the time of writing finally got it! Excited for the future!

I like seeing old webcore designs for themes, apps, sites or even just frontends for modern stuff, so please do share your custom MSN-lookalike discord clients and your win98-looking linux installs! It's a breath of fresh air in the sea of bland corporate designs.

Hope this wasn't too long for you, and feel free to reply to this message with questions if I got you curious about my life or hobbies!
American NaturalistASNAmNat@ecoevo.social
2024-05-16

Now available Ahead of Print! "Population Dynamic Consequences of Context-Dependent Trade-Offs across Life Histories" by Louis Bliard, Maria Paniw, Dylan Z. Childs, and Arpat Ozgul: journals.uchicago.edu/doi/10.1

#populationDynamics #lifehistory #heterogeneity #covariation #tradeoffs

Teresita Porter 🙋🏻‍♀️DNAdataPhile@ecoevo.social
2023-12-22

Life history strategies of soil bacterial communities across global terrestrial biomes

nature.com/articles/s41564-023

#bacteria #biomes #LifeHistory

Teresita Porter 🙋🏻‍♀️DNAdataPhile@ecoevo.social
2023-11-29
2023-09-27

New study in @iScience_CP, explaining the paradox of why small vertebrates could evolve into giants precisely on small, unproductive islands: A slow and prolonged growth means abundance of resources is not a prerequisite for gigantism.
#lifehistory #paleohistology #paleomammalogy

sciencedirect.com/science/arti

2023-09-11

Samuel Alizon explores a #PLOSBiology study which uses evolutionary epidemiology models to show that #LifeHistory of reservoir mammal hosts of #zoonotic #viruses might be the key to predicting virulence in humans. Primer: plos.io/45MphU1 Paper: plos.io/44Dri3y

Denis Reale (he/him)denisrealeMTL@ecoevo.social
2023-08-15

Melanie Dammhahn explaining the latest developments in the Pace of life syndrome (POLS) hypothesis. We need more models to embrace the complexity of natural systems. #behaviour2023 #personality #lifehistory #evolution #ecology

Yngvild Vindenesyvinden@ecoevo.social
2023-08-09

Red deer show large seasonal fluctuations in body size each year. In this new paper we built growth models to look at how this seasonality changes with age: calves reach peak size later each year compared to adults. Data and R code for running the analysis are also provided #openaccess.

#deer #research #ecology #seasonality #growth #lifehistory

esajournals.onlinelibrary.wile

A picture of an adult red deer voluntarily entering the platform scale for weighing at Songli Research Station, Norway
Paul Marrow 🇪🇺evopma@ecoevo.social
2023-07-02

In #Edinburgh for 50th anniversary of #rum #reddeerproject earlier this week. A very impressive and on-going study of #ecology #evolution #lifehistory #molecularevolution of Cervus elaphus L.. Many more eminent attendees than myself (only some found here @MarcoFB). My knowledge of the project was updated a lot.

Holyrood Park, Edinburgh. Not the location of the Rum red deer project, but next to the University of Edinburgh campus where the meeting took place.

Client Info

Server: https://mastodon.social
Version: 2025.04
Repository: https://github.com/cyevgeniy/lmst