#VisualAnalytics

2025-06-23

Alexander Rolwes hat am 16. Juni 2025 seine Dissertation mit dem Titel "Geovisuelle Ansätze zur Analyse von Raum-Zeit-Zusammenhängen in urbanen Anwendungsfällen" erfolgreich verteidigt. Dazu gratulieren wir ihm sehr herzlich!

i3mainz.hs-mainz.de/news/2025/

#mobilität #VisualAnalytics #HochschuleMainz #HochschuleRheinMain #Geoanalyse
#Erreichbarkeitsanalyse #Öffnungszeitenanalyse #Attraktivitätsanalyse

Statistics GlobeStatisticsGlobe
2025-06-20

The "Grammar of Graphics" is a powerful concept that ggplot2 in R is built on. It breaks down the process of data visualization into layers, making it easier to customize and understand how to build effective charts.

Want to dive deeper into creating beautiful and informative visuals with ggplot2? Check out my online course on "Data Visualization in R Using ggplot2 & Friends!" Take a look here for more details: statisticsglobe.com/online-cou

Statistics GlobeStatisticsGlobe
2025-06-13

I recently discovered the tidyplots package in R, and it’s impressive how effortlessly it enables you to create beautiful, publication-ready plots.

The example visualizations shown here were created by the package author, Jan Broder Engler, and are featured on the tidyplots website: jbengler.github.io/tidyplots/

Click this link for detailed information: statisticsglobe.com/online-cou

Harald KlinkeHxxxKxxx@det.social
2025-06-05

CfP: VIS4DH 2025
The VIS4DH workshop will be held in conjunction with IEEE VIS in Vienna, Austria. It invites submissions at the intersection of visualization and (digital) humanities.
This year’s theme: Visualizing Peace and Conflict
More details: vis4dh.dbvis.de
#VIS4DH #IEEEVIS #DigitalHumanities #InformationVisualization #VisualAnalytics #CfP #PeaceResearch #ConflictStudies #HumanitiesData #DataHumanities #DH2025 #CriticalVisualization

Statistics GlobeStatisticsGlobe
2025-06-03

Adding statistical metrics to your plots can transform your visualizations from basic to highly informative. With ggplot2 in R and its versatile extensions, incorporating features like p-values, confidence intervals, and regression lines becomes both straightforward and visually appealing.

With these tools, integrating statistical insights into your ggplot2 visualizations becomes both effective and effortless.

More details: statisticsglobe.com/online-cou

2025-05-13

Looking forward to two #sfbtrr161 talks this week: Ali Sarvghad from UMass Amherst discusses responsible #VisualAnalytics in the #AI era and Narges Mayhar presents #visualization tools that help people engage with complex sociotechnical problems.

More info: sfbtrr161.de/events_sfbtrr161/

Statistics GlobeStatisticsGlobe
2025-05-13

Make your plots more stylish and visually appealing! The ggthemes package offers a variety of pre-built themes that help you customize the look of your ggplot2 visualizations, drawing inspiration from popular design standards.

The visualization shown here is from the package website: yutannihilation.github.io/allY

More: statisticsglobe.com/online-cou

Statistics GlobeStatisticsGlobe
2025-05-06

Creating publication-ready plots in R is easier than ever with ggpubr. This extension for ggplot2 simplifies the process of generating clean and professional graphics, especially for exploratory data analysis and reporting.

The attached visual, which I created using ggpubr, demonstrates its versatility.

Additional information: statisticsglobe.com/online-cou

Planetary Ecologistplanetaryecologist
2025-04-22

Visual analytics (Cartography 🗺️)

Visual analytics is a multidisciplinary science and technology field that emerged from information visualization and scientific visualization. It focuses on how analytical reasoning can be facilitated by interactive visual interfaces.

en.wikipedia.org/wiki/Visual_a

2025-04-10

Am 2. April 2025 wurde Johannes Frank vom @vdi_news Rheingau-Bezirksverein für seine herausragende Masterarbeit mit dem Titel „Analyse von Einflussfaktoren auf die Unfallschwere von Unfalldaten mittels KI und #xai ausgezeichnet.
Johannes Frank widmete sich einem hochrelevanten Thema der #Verkehrssicherheit und nutzte dabei moderne Technologien, insbesondere #kunstlicheintelligenz , #VisualAnalytics und Ansätze der Erklärbaren KI. Herzlichen Glückwunsch, Johannes!

i3mainz.hs-mainz.de/news/2025/

Statistics GlobeStatisticsGlobe
2025-04-08

Basic boxplots are often not the best way to visualize your data! They can hide important information, such as the distribution of individual data points or group-specific differences.

The attached visual showcases several ways to enhance boxplots.

All of these examples were created using ggplot2 and extensions in R.

Click this link for detailed information: statisticsglobe.com/online-cou

Statistics GlobeStatisticsGlobe
2025-02-21

Working with text in ggplot2 plots can be a mess, especially when dealing with overlapping labels, busy backgrounds, or the need for custom formatting. Thankfully, several powerful ggplot2 extensions make text manipulation and annotation much easier and more effective.

With these tools, text in ggplot2 becomes much more manageable and visually appealing.

Statistics GlobeStatisticsGlobe
2025-02-11

In missing data imputation, it is crucial to compare the distributions of imputed values against the observed data to better understand the structure of the imputed values.

The visualization below can be generated using the following R code:

library(mice)
my_imp <- mice(boys)
densityplot(my_imp)

Take a look here for more details: statisticsglobe.com/online-wor

Anita Graser 🇪🇺🇺🇦🇬🇪underdarkGIS@fosstodon.org
2025-02-07

#IEEE VIS: Visualization & Visual Analytics Conference coming to #Vienna, Austria
November 2 to 7, 2025

📆
Abstract submission March 21, 2025
Paper submission March 31, 2025

ieeevis.org/year/2025/welcome

Follow @ieeevis for details

#vis2025 #dataviz #visualization #visualanalytics

Statistics GlobeStatisticsGlobe
2025-01-28

When it comes to learning data science, statistics, and programming, having the right resources is essential.

You can find all links and further descriptions here: statisticsglobe.com/statistics

If you are looking for a structured course that helps you get started with these topics, you may check out my introduction to R programming course. Further details: statisticsglobe.com/online-cou

Margret Plankplankm@blog.tib.eu
2024-12-13

Workshop „OER with Ukraine“ mit Vertreter:innen aus Ukrainischen Hochschulen

read this article in English

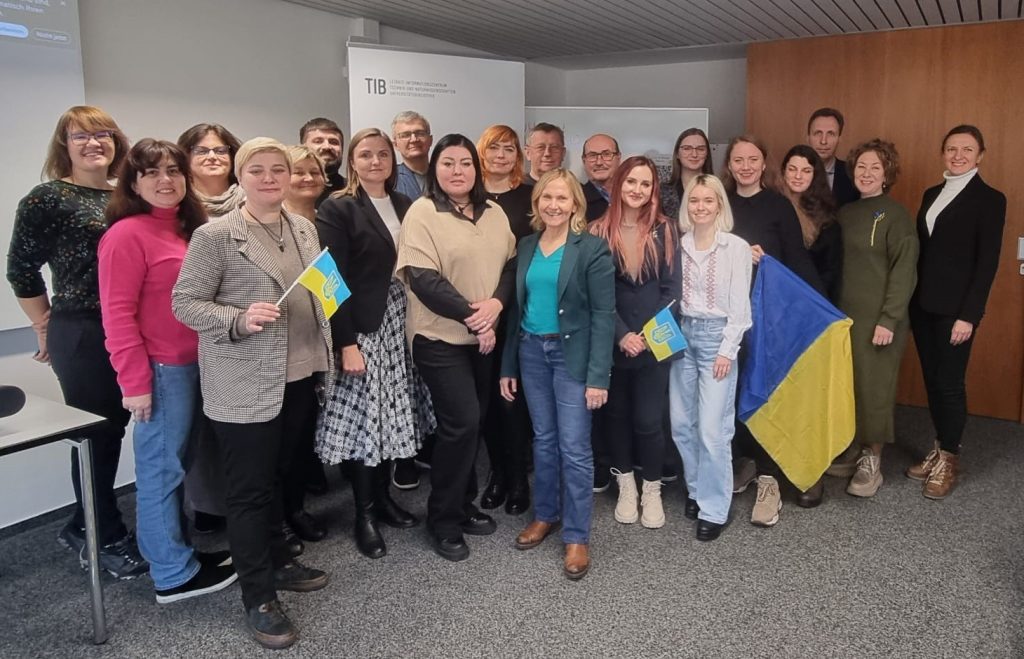
15 Vertreter:innen fünf ukrainischer Partneruniversitäten und eines Forschungsinstituts aus Kyjiw, Dnipro, Charkiw und Lwiw besuchten vom 23. bis zum 28. November 2024 die TIB in Hannover. Der Anlass: der Workshop „Open Educational Resources (OER) with Ukraine“.

Gemeinsam Videovorlesungen und Lernmaterialien entwickeln

Bereits seit Juni 2022 arbeiten sie im Rahmen des gleichnamigen Projektes unter der Leitung von TIB-Direktor Prof. Dr. Sören Auer eng mit dem Forschungszentrum L3S, der TIB und weiteren Instituten der Leibniz Universität Hannover zusammen. Das Ziel ist die Entwicklung von Videovorlesungen und Lernmaterialien unter Creative-Commons-Lizenzen (CC-BY) für Fächer wie Biomedizintechnik, Biologie, Materialwissenschaften, Informatik, Informationstechnologie sowie der Geschichte der Wissenschaft und Technik.

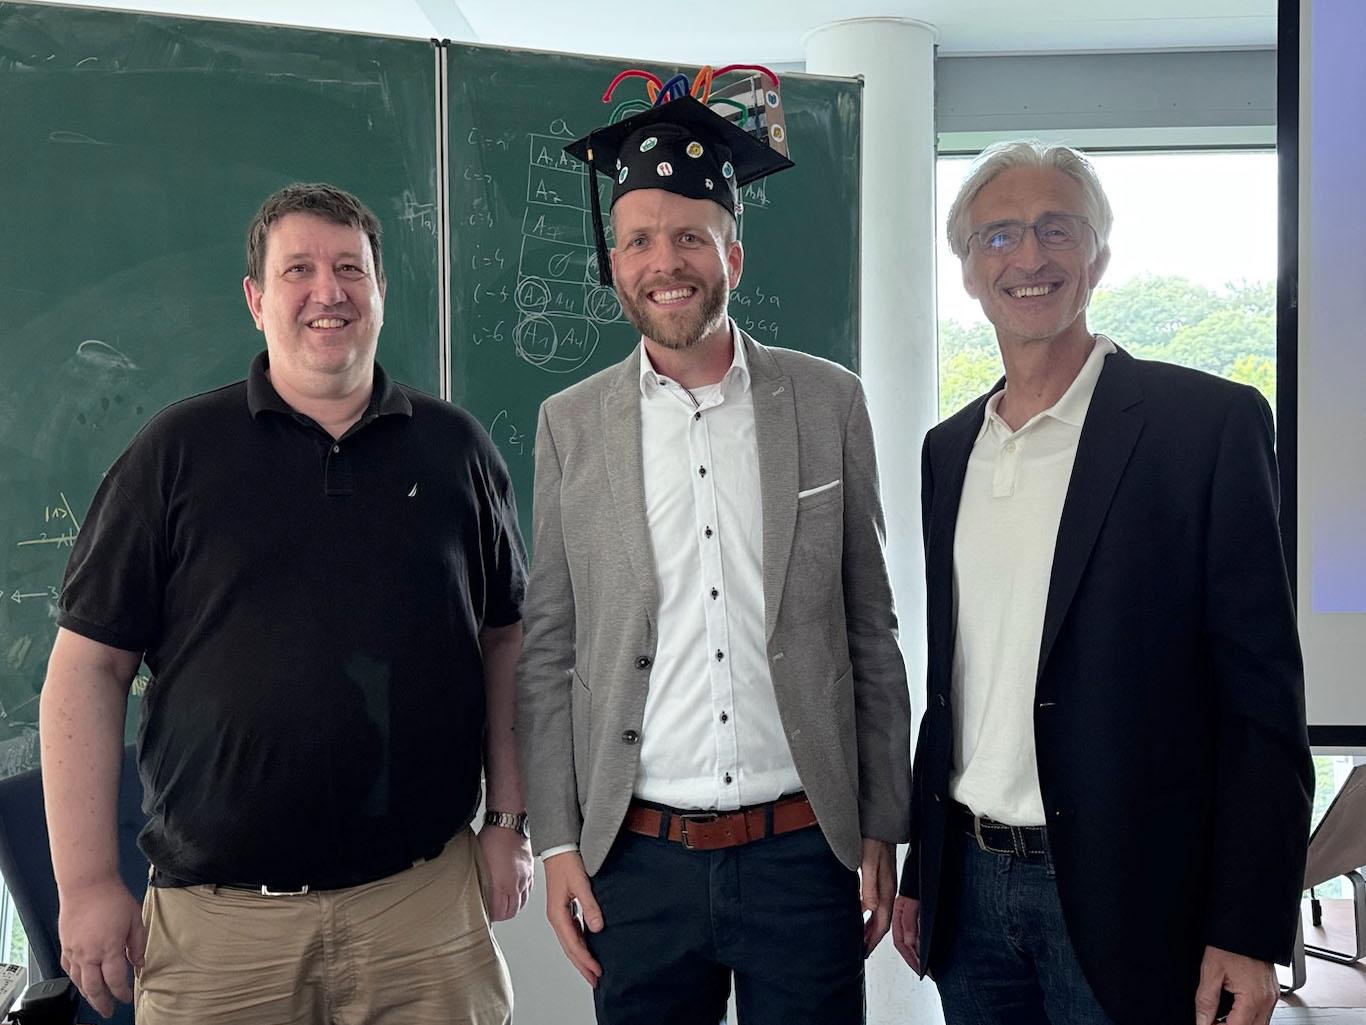
Die Teilnehmenden des Workshops „Open Educational Resources (OER) with Ukraine“ in der TIB in Hannover.

Mehr als 290 produzierte Videos im TIB AV-Portal verfügbar

Ein paar Zahlen und Fakten zum Projekt: Bislang sind über 290 Lehr- und Lernvideos in englischer und/oder ukrainischer Sprache entstanden. Alle Videos sind im TIB AV-Portal, einem internationalen Portal für wissenschaftliche Videos, als OER – also freie Lern- und Lehrmaterialien – abrufbar. Jedes dieser Videos hat einen Digital Object Identifier (DOI), wird dauerhaft gespeichert, in englischer und ukrainischer Sprache untertitelt sowie mit semantischen Daten und standardisierten Metadaten beschrieben, die über offene Schnittstellen im OER-Suchindex OERSI.org auffindbar sind. Dadurch sind die Videos dauerhaft zugänglich, zitierbar und frei nachnutzbar.

Erfahrungen teilen, innovative Ansätze vorstellen

Im Workshop teilten die Teilnehmenden ihre Erfahrungen mit Open Educational Resources miteinander und stellten innovative Ansätze vor, wie LiaScrip, ein Open-Source-Framework für die Erstellung interaktiver Online-Kurse, genutzt werden kann. Mit LiaScrip können Autor:innen Bildungsinhalte in einer leicht verständlichen Markdown-Syntax schreiben, die dann in interaktive Kurse verwandelt werden.

TIB präsentiert Projekte und Aktivitäten rund um Open Access

Das Lab Learning and Skill Analytics der TIB präsentierte eDoer, eine community-basierte Lernumgebung, die personalisierte, offen zugängliche Bildungsinhalte anbietet. Das KI-gestützte Empfehlungssystem erleichtert Lernenden und Lehrenden die Suche nach passenden Inhalten. Zudem präsentierte die TIB aktuelle Entwicklungen in den Bereichen Open-Access-Publizieren und Universitätszeitschriften sowie das Forschungsprojekt „Fake Narratives: Understanding Narratives of Disinformation in Public and Alternative News Videos“ der TIB-Forschungsgruppe Visual Analytics.

Positives Feedback zum Workshop

Besonders wertvoll fanden die Teilnehmer:innen Informationen zu VIVO, einer von der TIB genutzten Open-Source-Infrastruktur für Forschungsinformationen. VIVO ermöglicht die Bereitstellung nachnutzbarer, strukturierter Forschungsinformation auf Basis von Linked Open Data. „Dies möchte ich gern in unserem Fachbereich prototypisch implementieren“, so eine der ukrainischen Teilnehmerinnen. Der Workshop endete mit positivem Feedback der Teilnehmenden und unterstrich die hohe Bedeutung internationaler Zusammenarbeit und fachlichen Austauschs in der Forschung und Lehre. Der Workshop endete mit positivem Feedback der Teilnehmenden und unterstrich die hohe Bedeutung internationaler Zusammenarbeit und fachlichen Austauschs in der Forschung und Lehre.

Projektverlängerung bis zum 30. Juni 2025

Eine erfreuliche Nachricht kam während des Workshops vom Deutschen Akademischen Austauschdienst (DAAD): Das Projekt wird bis zum 30. Juni 2025 verlängert, sodass weitere OER-Materialien erstellt und die Integration sowie gegenseitige Anerkennung der Kurse an den Partneruniversitäten vorangetrieben werden kann.

Über das Projekt „Open Education Resources with Ukraine“

Das vom Deutschen Akademischen Austauschdienst (DAAD) geförderte Projekt „Open Education Resources with Ukraine“ unterstützt die ukrainischen Partnerhochschulen der Leibniz Universität Hannover (LUH) in Kyiv, Dnipro, Kharkiv und Lviv dabei, ihr laufendes Lehrangebot in Krisenzeiten aufrechtzuerhalten, weiterzuentwickeln und zu digitalisieren. Das Ziel ist es, Lehrangebote auszubauen, indem Lehr- und Lernvideos aus den Fächern Biomedizintechnik, Biologie, Werkstoffkunde, Informatik und Informationstechnologie unter Creative-Commons-Lizenzen (CC-BY) produziert, in den laufenden Lehrbetrieb der jeweiligen Partnerhochschulen verankert und im TIB AV-Portal veröffentlicht werden. Hierfür werden die Videos übersetzt oder untertitelt, inhaltlich angepasst und als Open Educational Resources – also freie Lehr- und Lernmaterialien – aufbereitet. Somit trägt das Projekt zur Internationalisierung, Digitalisierung und Offenheit der beteiligten Akteur:innen bei und verleiht den geflüchteten sowie in der Ukraine verbliebenen Lehrenden und Studierenden eine Perspektive.

#AVPortal #Forschung #LizenzCCBY40INT #OpenEducationalResources #Ukraine #VisualAnalytics #vivo

OER with Ukraine Project
Statistics GlobeStatisticsGlobe
2024-11-26

Creating publication-ready plots in R is easier than ever with ggpubr. This extension for ggplot2 simplifies the process of generating clean and professional graphics, especially for exploratory data analysis and reporting.

Course link: statisticsglobe.com/online-cou

2024-11-18
Statistics GlobeStatisticsGlobe
2024-11-15

Want to analyze the distribution of a single variable and test its mean against a specified value? The gghistostats() function from the ggstatsplot package is your go-to tool.

The visualization shown here is from the package website, demonstrating how gghistostats() effectively combines data distribution with statistical testing: github.com/IndrajeetPatil/ggst

Further details: statisticsglobe.com/online-cou

Statistics GlobeStatisticsGlobe
2024-11-12

The R programming language is, in my opinion, the best tool for statistical analysis and data visualization.

By enrolling in the course, you’ll receive lifetime access to:

- 20 video lessons on statistical methods & their application in R.
- Exclusive group chat for questions, support, and networking.
- Quizzes, projects, scripts, and additional resources to enhance your skills.

Link: statisticsglobe.com/online-cou

Client Info

Server: https://mastodon.social
Version: 2025.04
Repository: https://github.com/cyevgeniy/lmst