Only nine months late: my SQL adaptation of @drdrang’s Electoral College script, which has been sitting as a basically finished draft since the beginning of September. #datadon https://seanlunsford.com/2024/bringing-sql-to-a-python-fight/
#dataDon
Hey, #RStats and #DataDon folks. How would you estimate the regression of a normally distributed variable and a variable that is bounded between 0 and 1 (and has many 0s and 1s) (specifically: sea ice concentration). I realised that normal linear regression really doesn't make sense. Is beta regression the better choice? betareg is not fitting, (I get an initial value in 'vmmin' is not finite error).
"The reason you begin tracking your data is that you have
some uncertainty about yourself that you believe the data
can illuminate. It’s about introspection, reflection, seeing
patterns, and arriving at realizations about who you are
and how you might change."
—Eric Boyd, self-tracker
an article by Natasha D. Schüll, 2019, "The Data-Based Self:
Self-Quantification and the Data-Driven (Good) Life" https://www.natashadowschull.org/wp-content/uploads/2021/12/SocialResearch-2019.pdf
#concentration #credit #scores #scoring #reward #rewards #psychology #socioPsych #socioPsychology #selfWorth #universalism #digitalization #recognition #data #AIRisks #AIEthics #gaming #socialization #Tracking #surveillance #selfRegulation #attention #reintermediation #intermediation #enshittification #risk #derisking #vulnerability #morality #selfConfidence #dataDon #Schüll #quotes
‘Our moral intuitions about merit and personal worth are changing.’
an interview with Marion Fourcade about her book "The Ordinal Society" co-written by @kjhealy: https://news.berkeley.edu/2024/04/23/from-uber-ratings-to-credit-scores-whats-lost-in-a-society-that-counts-and-sorts-everything/
#TheOrdinalSociety #concentration #merit #meritocracy #MarionFourcade #Fourcade #school #credit #scores #scoring #reward #rewards #sociology #psychology #socioPsych #socioPsychology #ranking #selfWorth #universalism #digitalization #inequality #inequalities #recognition #data #AIRisks #AIEthics #gaming #socialization #Tracking #surveillance #power #socialControl #governance #regulation #rules #socialMedia #attention #reintermediation #intermediation #enshittification #risk #derisking #vulnerability #morality #confidence #trust #dataDon
In its judgment, the General Court of the European Union strengthened the conciliation and regulatory powers of the European Data Protection Board.
"The DPC will have to continue its investigations into Meta unless it chooses to refer the matter to the European Court of Justice. Given the timeline of the original investigation, which began in 2018, it may still take several years before a final determination is made regarding the GDPR compliance of Meta’s business model, particularly in relation to behavioural advertising."
https://dpoblog.eu/cjeu-and-the-powers-of-edpb by Christina Etteldorf, Institut of European #Media #Law, Saarbrücken (Germany)
#advertising #GDPR #Meta #WhatsApp #instagram #CJEU #DPC #EDPB #Etteldorf #networkPolitics #targetedAdvertising #targetedAdvertisement #dataProtection #dataMining #dataDon #dataCapture #dataGovernance #retaliation
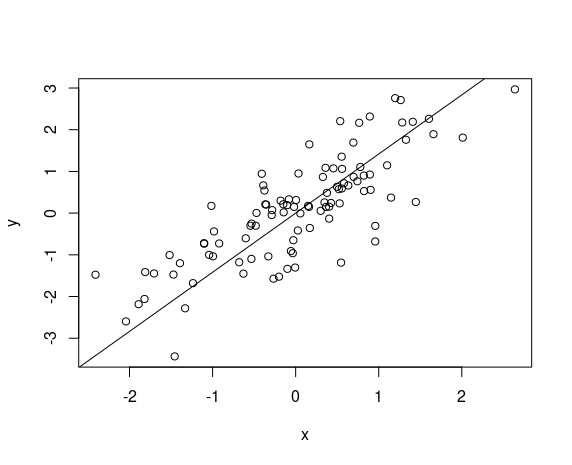
What's easier to interpret as a measure of linear relationship between two variables?
Edit: Found one, see reply. Feel free to make any other suggestions though :)
Anyone know of a function dependency graph visualiser for Python that does the same thing(ish) as foodwebr for R? https://github.com/lewinfox/foodwebr
Everything I've found so far do module dependency graphs (e.g. https://github.com/gauge-sh/tach), which are cool, but I'd really like to get a graph of **function** dependencies, to see more finely "who calls who".
This link https://www.luzmo.com/blog/python-chart-libraries gives a nice overview.
In my case I am well served with seaborn and matplotlib in most cases when I use Python.
Regarding the tutorial I don't know the level you start from and I don't know if you prefer reading or watching but here are some recommendations.
https://matplotlib.org/stable/tutorials/pyplot.html
https://www.w3schools.com/python/matplotlib_plotting.asp
https://www.dataquest.io/tutorial/data-visualization-in-python/
https://www.geeksforgeeks.org/graph-plotting-in-python-set-1/
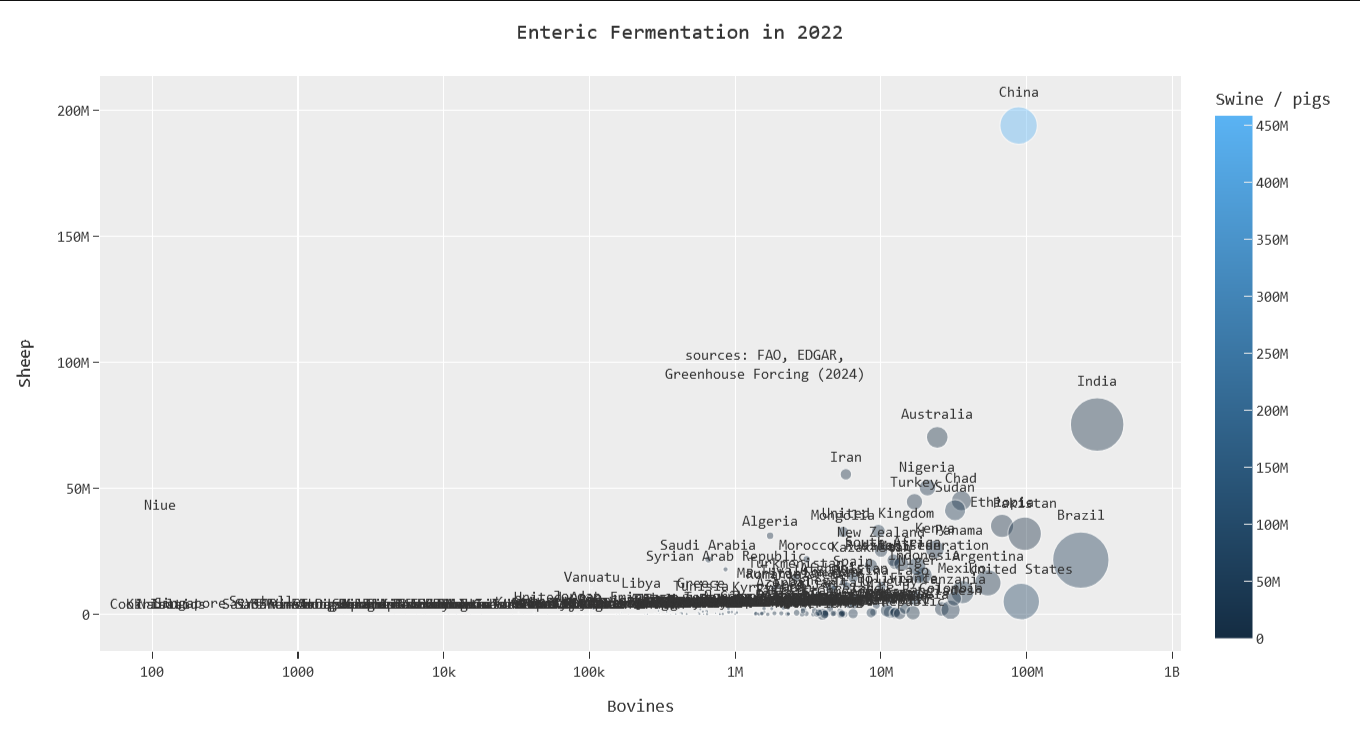
Enteric Fermentation in 2022
Livestock digestion emits too much methane:
* Too many bovines in India, Pakistan, Brazil, United States, China;
* Too many sheep and pigs in China.
(The bubble sizes depend on the amount of methane sent in 2022.)
#GreenhouseForcing #methane #emissions #climateChange #climateBreakdown #climateCollapse #dataViz #bubbleChart #dataMining #plotly #featureEngineering #featureSelection #dataDon
#DataViz on two requirements:
* zooming, panning and rescaling
* shareable dashboards
"Plotly vs. Bokeh: Interactive Python Visualisation Pros and Cons", by Dr Paul Iacomi: https://pauliacomi.com/2020/06/07/plotly-v-bokeh.html
#dataDev #retrieval #dataMining #plotly #Dash #Bokeh #python #dataInteraction #data #dataDon #widgets #ipython #jupyter #dashboards #businessIntelligence
It's trite to start a blog post share with "A common question I hear is…", but in this case it's *true*! One of the most common things I see people asking how to do is get data from #Postgres to #Snowflake, so I wrote a blog post about how to do with @decodable. You can use a web UI or YAML—your choice.
community, brush up on ML, work on some personal projects, finally learn some front-end, and figure out what's next. My plan is blog as I go and meet some awesome people along the way. Excited to be here! #introduction #datadon (2/2)
If you’re not there yet, check it out #datadon
@data @datadon
"Obtaining the data is a hard human problem. That is, 'people don’t want to give it to you'."
You can "use your allies on the bottom (front-line workers) and the top (executives) to squeeze out your opponents in the middle (managers, often in IT or data science departments").
Sarah Constantin: https://sarahconstantin.substack.com/p/the-great-data-integration-schlep
#industry #power #factory #processes #dataPrivacy #confidentiality #dataDon #dataGovernance #security #dataAccess #analytics #powerTalk #data #dataAnalysis #losers
Stats question... x and y are random variables with equal measurement error. I can compute the leading PC as orthogonal regression. The variance explained by this PC is 0.91. However, the R^2 between the two variables is 0.64. What's the interpretation of these two numbers in this context?
Data returned by an observation typically is represented as a vector in machine learning.
A neural network can be seen as a large collection of linear models. We may represent the inputs and outputs of each layer as vectors, matrices, and tensors (which are like higher dimensional matrices).
#algebra #linearAlgebra #vectors #matrices #determinants #singularity #ML #DataScience #math #maths #mathematics #mathStodon #ML #data #dataDon #dataScience #machineLearning #DeepLearning #neuralNetworks
Absolutely gorgeous #visualizations on transport in cities.
Open core is hard, example 957:
https://www.datafold.com/blog/sunsetting-open-source-data-diff
This is is 🔥🔥🔥 and the tooling I wish I had when writing custom REST extractors
Automated pagination is the kind of feature that will make many DEs very happy
Client Info
Server: https://mastodon.social
Version: 2025.04
Repository: https://github.com/cyevgeniy/lmst