Hello!
Sorry for our late reply, we somehow missed your question. You need to set the offset for the first tick of e.g. the y-axis. Please, see the attached screenshot.
Hello!
Sorry for our late reply, we somehow missed your question. You need to set the offset for the first tick of e.g. the y-axis. Please, see the attached screenshot.
Yes, the former solution offered more flexibility, but could be less intuitive at first :-)
Hi,
Could you switch to LabPlot 2.11.1? Plot ranges and axis ranges have been synchronized in 2.11 to make any adjustments more intuitive.
You can find it here: labplot.kde.org/download
Hi,
Could you switch to LabPlot 2.11.1? Plot ranges and axis ranges have been synchronized in 2.11 to make any adjustments more intuitive.
You can find it here: labplot.kde.org/download
Have you seen this video tutorial on how to extract plots, curves and data points from images using #LabPlot's Data Picker tool ?
Data Picker has been available in LabPlot since the version 2.2, but we renamed it recently to Data Extractor.
https://www.youtube.com/watch?v=D_Pz5aA-4Xg
#LabPlot #DataVisualization #PlotDigitizer #DataExtraction #DataExtractor #Plots #Graphs #FreeSoftware #OpenSource #FOSS #FLOSS
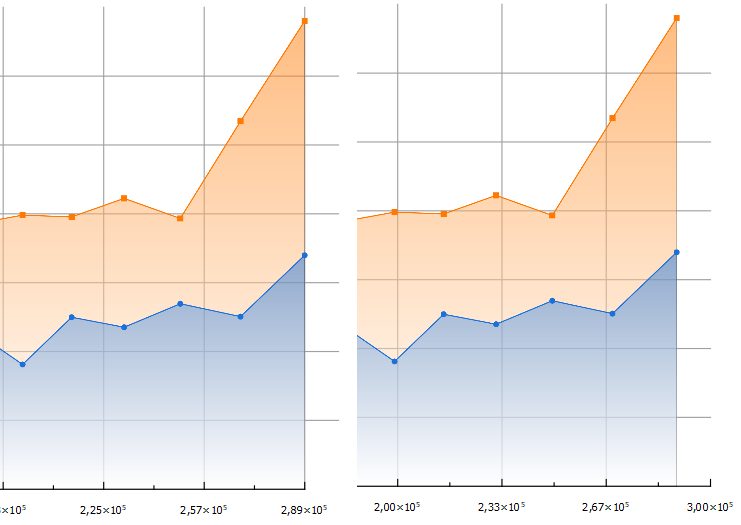
Line plot x-axis length
@bitigchi @labplot@lemmy.kde.social we finalized the port to Qt6 already long time ago. We’re finalizing the Qt6-port of Cantor now and we’ll switch in master to Qt6 once also this dependency was ported. The next release should be based on Qt6 already. So, it should be done soon.
@nicemicro @labplot@lemmy.kde.social
That would be great, thanks! 🙂
@LabPlot@floss.social @labplot@lemmy.kde.social I see that the Hungarian version needs some work, I'd love to do it in my free time!
@LabPlot@floss.social @labplot@lemmy.kde.social @kde That's a good question, seems to be a hard topic within KDE.
#LabPlot is now also fully available in Ukrainian and French! Thank you ❤️🙂
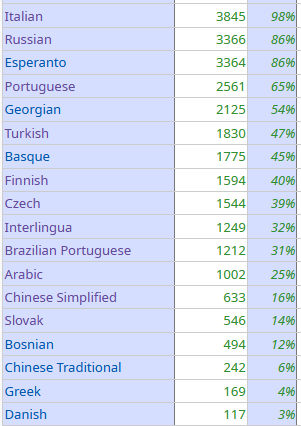
The following translations still need some work... And other languages need a bit more work 😉
@s3nnet @labplot@lemmy.kde.social
To whom from the KDE community should we forward this question?
@LabPlot@floss.social @labplot@lemmy.kde.social Not meaning to be rude; but then again, what's the point of not using Continuous Localization á la Weblate or Crowdin in 2024 again?
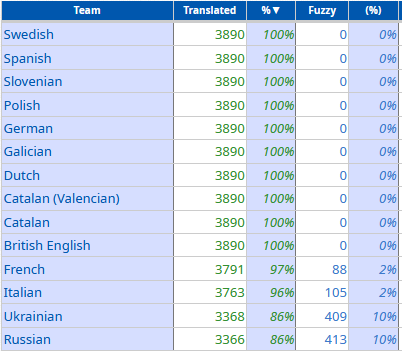
#LabPlot is currently fully available in British English, Catalan, Dutch, Galician, German, Polish, Slovenian, Spanish, Swedish and partially available in French, Italian, Ukrainian, Russian and other languages.
We would like to thank all LabPlot's translators and encourage others to provide translations in other languages ❤️ 🙂
Check translation statistics:
▶️ https://l10n.kde.org/stats/gui/stable-kf5/package/labplot/
Please get involved!
▶️ https://community.kde.org/Get_Involved/translation
This page contains a list of external resources mentioning #LabPlot and its usage in various areas 👨🔬 🔭 🔬 .
➡️ https://labplot.org/references/
Boosts appreciated! :boost_love:🚀
#LabPlot is a FREE, open source and cross-platform Data Visualization and Analysis software accessible to everyone and trusted by professionals.
#LabPlot #Science #Research #Students #Physics #Medicine #Chemistry #Biology #Engineering #Ecology #Electronics #Robotics #Education #OpenSource #FreeSoftware #FLOSS
If you want to learn #statistics, we highly recommend this YouTube channel: #TileStats.
You can start with this Basic Statistics course:
➡️ https://www.youtube.com/watch?v=YZGG5PpbJdc&list=PLLTSM0eKjC2eSEO7y7MZWb1sdDJiAejoI
#Students #DataAnalysis #DataScience #AI #MachineLearning #Teaching
An open access article by W. Morales González and J. E. Hernández-Ruiz: Experiencias en el uso del software LabPlot en el procesamiento analítico y gráfico de datos experimentales
#LabPlot #Students #Research #DataAnalysis #Physics #DataVisualization #experimental #Física #Teaching #Chemistry #OpenSource #FreeSoftware
You can fit data to a statistical distribution in a flash using #LabPlot [dev 2.12 version]
➡️ https://invent.kde.org/education/labplot/-/merge_requests/562
#DataAnalysis #dataScience #data #Statistics #Research #Science #dataVisualization #Technology #Students #AlternativeTo #SciDavis #FreeSoftware #OpenSource
Since July you can enjoy the new 2.11.1 version of #LabPlot, an open-source data analysis and visualization software.
Check your current version and ask your package maintainer to provide the latest version for your #Linux and #FreeBSD distribution.
➡️ https://repology.org/project/labplot/versions
#DataAnalysis #Statistics #Research #Ubuntu #LinuxMint #ArchLinux #Slackware #Debian #Fedora #OpenSUSE #RedHat #HaikuOS #GNU #CentOS #FreeSoftware #OpenSource #Manjaro #Zorin #FOSS #FLOSS #KDE
▶️ LabPlot - Tutorial - Stacked Plots
Catalyst Nanomaterials Lab has published another video tutorial that shows how to create stunning stacked plots in #LabPlot. Go check it out!
https://www.youtube.com/watch?v=rZ5qYjM8FEg
#FreeSoftware #DataAnalysis #DataVisualization #Research #OriginProAlternative #Science #Tutorial #FLOSS #FOSS #OpenSource #StackedPlots #ProbabilityDistribution #AlternativeTo #KDE #Students #Researchers #Professionals #SciDavis #Technology