
GeoPandas. Reading and writing files
#GeoPandas
Map Application Using Python, GeoJSON, and Folium
How to Access Built-In GeoPandas Datasets

Deep dive on pruning: Dewey Dunnington’s latest blog post dives deep into how pruning, the selective reading of relevant data, makes #GeoParquet blazing fast in both local and #cloudnative contexts. Featuring hands-on comparisons across #SedonaDB, #DuckDB, #GeoPandas,...
https://spatialists.ch/posts/2025/12/16-deep-dive-on-pruning/ #GIS #GISchat #geospatial #SwissGIS

QGIS to (Geo)Pandas – part 3
The journey continues: QgsArrowIterator is now merged, making it possible to iterate over QgsFeatures as Arrow batches.
This is where we are now ... http://anitagraser.com/2025/12/03/qgis-to-geopandas-part-3/
#QGIS #GeoPandas #GISChat #SpatialDataScience #Arrow #Python
Fell behind on the making a map thing. Day 27: #Boundaries
The #EquilibriumLine marks the boundary on a #glacier between the accumulation and ablation zones. It moves up and down from year to year with changes in the climate.
Here are the equilibrium line altitudes (#ELA) for Rembesdalskaaka, an outlet glacier of #Hardangerjøkulen ice cap in #Norway.
Data & Sources:
- ELAs: WGMS (2025): Fluctuations of Glaciers (FoG) Database. World Glacier Monitoring Service (WGMS); Zurich; Switzerland. https://doi.org/10.5904/wgms-fog-2025-02b
- outline of Rembesdalskaaka: The #GLIMS Geospatial Glacier Database (Raup et al., doi:10.1016/j.gloplacha.2006.07.018)
- Elevation*: Copernicus Global DEM (30 m)
- Lakes & peaks: #OpenStreetMap
*since the mid-90s Rembesdalskaaka has thinned at ~0.8 m/yr. I have casually ignored that, and just plotted the contours for the ELA on a modern DEM. So the position of the ELAs here, can't really be relied upon. Sorry.
Put together in #matplotlib with the help of #geopandas, #shapely #osmnx with a little of labelling in #Inkscape. #Typeface is Junction by Caroline Hadilaksono & Tyler Finck (League of Moveable Type)
#30DayMapChallenge #maps #glaciology #iWantToGoToNorway #Finse

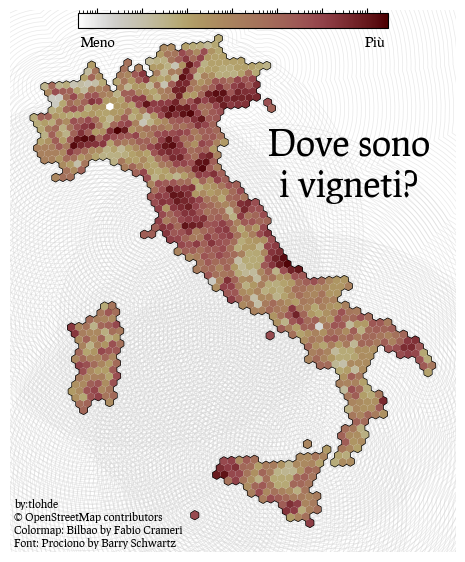
Where are the #vineyards in #Italy?
% of each #hexagon covered by vineyards. Log scale.
Vineyards extracted from #OpenStreetMap; hexagons courtesy of #h3, #geopandas, #cartopy and #matplotlib for everything else.
Typeface: Prociono by the League of Moveable Type. Colormap from Fabio Crameri.
Checking "walk" and "all" networks on #osmnx using data from #OpenStreetMap for #SãoPaulo. #geopandas #shapely Code at: https://github.com/villares/sketch-a-day/tree/main/2025/sketch_2025_11_16
More sketch-a-day: https://abav.lugaralgum.com/sketch-a-day
If you like this, support my work:
https://www.paypal.com/donate/?hosted_button_id=5B4MZ78C9J724
https://liberapay.com/Villares
https://wise.com/pay/me/alexandrev562 #Processing #Python #py5 #CreativeCoding

The #Volcanic Isles . A brief history of volcanism across The British Isles.
Quite pleased with how this one turned out.
Location of volcanoes taken from wikipedia (spotted a mistake and got to make an edit to wikipedia in the process); fault lines from the #BGS 625k bedrock dataset and the IE GSI 500k Bedrock Geology for Ireland. Font: League-Spartan by the League of Moveable Type.
#requests, #pandas and #geopandas for scraping and wrangling.#scipy for making the proximity surface (that's the colour scheme), #matplotlib for plotting. With all labeling done manually in #inkscape.
EDIT: I've been kindly and helpfully informed that (a) Ben Nevis' age is closer to 399 Ma; (b) some are missing; (c) others perhaps shouldn't be there; (d) it's complicated. So, maybe don't use this map to make any strategic decisions.
#volcanism #volcano #imNotExtinctImDormant #magma #geology #faultlines

Made today during class at Sesc with data from #OpenStreetMap using #osmnx #OSM #BSB #geodataframe #geopandas #shapely Code at: https://github.com/villares/sketch-a-day/tree/main/2025/sketch_2025_11_13
More sketch-a-day: https://abav.lugaralgum.com/sketch-a-day
If you like this, support my work:
https://www.paypal.com/donate/?hosted_button_id=5B4MZ78C9J724
https://liberapay.com/Villares
https://wise.com/pay/me/alexandrev562 #Processing #Python #py5 #CreativeCoding
UPDATE: moving water (the lake) under the white paths


while exploring @geopandas docs I learned it has a "explore()" function that creates an interactive #leafletjs map of the #geodataframe #pandas #gis #geodata #gischat #geopandas
https://geopandas.org/en/stable/docs/user_guide/interactive_mapping.html
#openStreetMap #OSM #osmnx #geopandas Code at: https://github.com/villares/sketch-a-day/tree/main/2025/sketch_2025_11_09
More sketch-a-day: https://abav.lugaralgum.com/sketch-a-day
If you like this, support my work:
https://www.paypal.com/donate/?hosted_button_id=5B4MZ78C9J724
https://liberapay.com/Villares
https://wise.com/pay/me/alexandrev562 #Processing #Python #py5 #CreativeCoding

#OpenStreetMap #osmnx #OSM #geopandas Code at: https://github.com/villares/sketch-a-day/tree/main/2025/sketch_2025_11_08
More sketch-a-day: https://abav.lugaralgum.com/sketch-a-day
If you like this, support my work:
https://www.paypal.com/donate/?hosted_button_id=5B4MZ78C9J724
https://liberapay.com/Villares
https://wise.com/pay/me/alexandrev562 #Processing #Python #py5 #CreativeCoding

#SãoPaulo #osmnx #OSM #geopandas #OpenStreetMap Code at: https://github.com/villares/sketch-a-day/tree/main/2025/sketch_2025_11_07
More sketch-a-day: https://abav.lugaralgum.com/sketch-a-day
If you like this, support my work:
https://www.paypal.com/donate/?hosted_button_id=5B4MZ78C9J724
https://liberapay.com/Villares
https://wise.com/pay/me/alexandrev562 #Processing #Python #py5 #CreativeCoding

@villares@pynews.com.br WIP (missing waterways/rivers/dams) #py5 #osmnx #OpenStreetMap #SãoPaulo #geopandas

#Astronomy #maps
Sous quel climat vivez-vous ?
Dès l'Antiquité, on définissait les climats comme des bandes géographiques distinctes, selon la durée du jour le plus long de l'année.
Sur l'équateur : 1er climat - durée 12h.
Sud de la France : 7e climat - durée 15h. etc.
À partir du cercle polaire, le jour le plus long dure 24h !
Fun fact : dans l'Antiquité, on ne définissait les climats que jusqu'à la latitude 50° car au-delà on pensait la terre inhabitable 😁
Script #python avec le module #geopandas pour la partie #carto.
En accès libre ici :
https://www.astrolabe-science.fr/sous-quel-climat-vivez-vous/

#OpenStreetMap #OSM #geopandas Code at: https://github.com/villares/sketch-a-day/tree/main/2025/sketch_2025_11_04
More sketch-a-day: https://abav.lugaralgum.com/sketch-a-day
If you like this, support my work:
https://www.paypal.com/donate/?hosted_button_id=5B4MZ78C9J724
https://liberapay.com/Villares
https://wise.com/pay/me/alexandrev562 #Processing #Python #py5 #CreativeCoding

Back to my map studies... Poly data © OpenStreetMap contributors https://www.openstreetmap.org/copyright #osmnx #OSM #OpenStretMap #geopandas Code at: https://github.com/villares/sketch-a-day/tree/main/2025/sketch_2025_11_03
More sketch-a-day: https://abav.lugaralgum.com/sketch-a-day
If you like this, support my work:
https://www.paypal.com/donate/?hosted_button_id=5B4MZ78C9J724
https://liberapay.com/Villares
https://wise.com/pay/me/alexandrev562 #Processing #Python #py5 #CreativeCoding

QGIS :qgis: to (Geo)Pandas :python: follow-up:
The conversation around Looking for better ways to convert between QGIS VectorLayer and (Geo)DataFrame is continuing over at https://fosstodon.org/@underdarkGIS/115442614331293320
http://anitagraser.com/2025/10/31/qgis-to-geopandas-follow-up/
Client Info
Server: https://mastodon.social
Version: 2025.07
Repository: https://github.com/cyevgeniy/lmst