Modeling And Analyzing Urban Networks And Amenities With OSMnx
--
https://doi.org/10.1111/gean.70009 <-- shared technical article / 'how to'
--
#GIS #spatial #mapping #OSMnx #OpenStreetMap #model #modeling #python #code #spatialanalysis #urban #networks #roads #transportation #infrastructure #geography #urbanplanning #planning #usage #design #software #development #openscience #opensource #analysis #tutorial #howto
#OSMnx
«The official OSMnx reference paper has just been published open-access by Geographical Analysis: [link below] Years in the making, this article describes what OSMnx does and why it does it that way. But wait, there's more! I also discuss many lessons learned over the past decade in geospatial software development [...]» — @gboeing
Modeling and Analyzing Urban Networks and Amenities With OSMnx
https://onlinelibrary.wiley.com/doi/10.1111/gean.70009
#Python #OSMnx #geoviz #geopandas #FLOSS #geospatial #OpenAccess
I had missed the great episode with Dr. Geoff Boeing at #TalkPythonToMe: #495: #OSMnx: #Python and #OpenStreetMap
I really love OSMnx and use it all the time, often with #py5 (which has a cool #shapely integration that helps).
Episode webpage: https://talkpython.fm/episodes/show/495/osmnx-python-and-openstreetmap
Media file: https://talkpython.fm/episodes/download/495/osmnx-python-and-openstreetmap.mp3
#OpenStreetMap #osmnx #SãoPaulo
Code at: https://github.com/villares/sketch-a-day/tree/main/2025/sketch_2025_03_13
More sketch-a-day: https://abav.lugaralgum.com/sketch-a-day
If you like this, support my work: https://www.paypal.com/donate/?hosted_button_id=5B4MZ78C9J724 #Processing #Python #py5 #CreativeCoding
Work in progress... #OpenStreetMap data as usual #osmnx Code at: https://github.com/villares/sketch-a-day/tree/main/2025/sketch_2025_03_12
More sketch-a-day: https://abav.lugaralgum.com/sketch-a-day
If you like this, support my work: https://www.paypal.com/donate/?hosted_button_id=5B4MZ78C9J724 #Processing #Python #py5 #CreativeCoding
It is super cool to be listed as a "contributor" for having chimed in (constructively) on a project's issue :D
https://github.com/nathanrooy/taxicab/releases/tag/v0.1.1
#taxicab is a library that improves on #OSMnx route-finding function, giving more useful results, specially on short routes.
Code at: https://github.com/villares/sketch-a-day/tree/main/2025/sketch_2025_02_27
More sketch-a-day: https://abav.lugaralgum.com/sketch-a-day
If you like this, support my work: https://www.paypal.com/donate/?hosted_button_id=5B4MZ78C9J724
#OpenStreetMap #OSMnx #Processing #Python #py5 #CreativeCoding
Code at: https://github.com/villares/sketch-a-day/tree/main/2025/sketch_2025_02_26
More sketch-a-day: https://abav.lugaralgum.com/sketch-a-day
If you like this, support my work: https://www.paypal.com/donate/?hosted_button_id=5B4MZ78C9J724
#OSMnx #OpenStreetMap #shapely #Processing #Python #py5 #CreativeCoding
#SãoPaulo
Code at: https://github.com/villares/sketch-a-day/tree/main/2025/sketch_2025_02_24
More sketch-a-day: https://abav.lugaralgum.com/sketch-a-day
If you like this, support my work: https://www.paypal.com/donate/?hosted_button_id=5B4MZ78C9J724
#shapely #osmnx #OpenStreetMap
Poly data (c) OpenStreetMap contributors https://www.openstreetmap.org/copyright
#Processing #Python #py5 #CreativeCoding
Latest episode: #OSMnx - #Python and #OpenStreetMap with
@gboeing and @mkennedy
https://talkpython.fm/episodes/show/495/osmnx-python-and-openstreetmap
#OSMnx Principales caracteristicas del paquete de #Python para descargar, modelar, analizar y visualizar fácilmente características geoespaciales de #OpenStreetMap https://medium.com/@kaxtillo/osmnx-caracteristicas-3b8e61d9f256
I recently moved house, so I didn’t have time to take part in #30DayMapChallenge in November. Now that I’m getting settled, I want to start exploring my new neighbourhood and get back to mapping.
So here is Day 1 - Points showing council maintained trees in Abbey Wood, southeast London. 🌳 🗺️
Made in #python #matplotlib. Basemap data from #OpenStreetMap via #OSMnx (finally updated to v2.0). Tree data for London is available in the London Datastore.
🔗 Code: https://github.com/Lisa-Ho/30-day-map-challenge/tree/main/2024
#OSMnx 2.0.0 has just been released! 🎉https://osmnx.readthedocs.io/en/stable/
day 22: 2 colours.
is #halftone cheating?
the Lake District with halftone topography taken from Copernicus Global DEM and lakes and rivers from #OpenStreetMap
#h3 #matplotlib #python #geopandas #osmnx #CopernicusDEM #30DayMapChallenge
day 20: Parisian Trees
I've fallen a bit behind... so just the trees within 1 km of the centre of Paris
{'natural':'tree'}
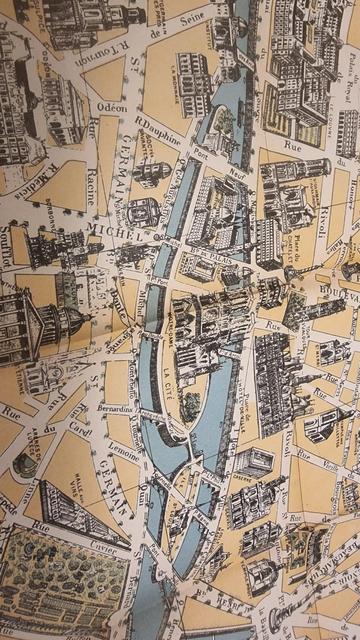
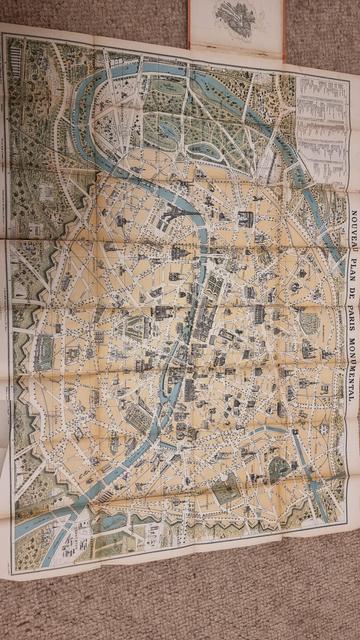
Inspired by this map of Paris that's folded into the back of an old "Paris seen in four days" guidebook (can't find a date on it). Pretty map - and it has lots of trees drawn along the edges of streets.
#OpenStreetMap #30DayMapChallenge #Paris #France #map #osmnx #matplotlib
#30DayMapChallenge Day 19: #typography
Bit fiddly this one. But reasonably happy with it.
Data from #OpenStreetMap via #osmnx
fonts used: water splash (https://www.fontspace.com/water-splash-script-font-f89646); Engravers MT; DejaVu Sans Mono; Bauhaus 93.
all done in #python with #matplotlib #geopandas and #shapely
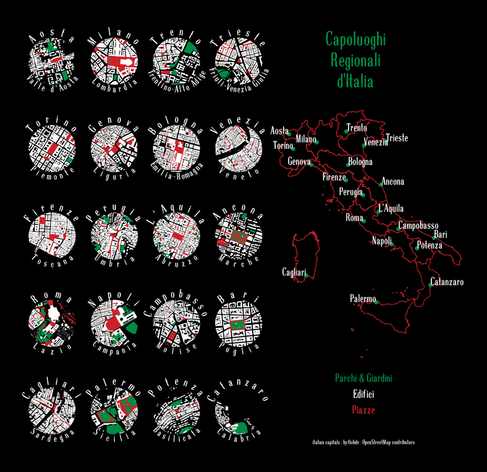
Regional Capitals of Italy.
Polygons of Parks and gardens (green), buildings (white) and piazzas/squares (red). Data from #OpenStreetMap via #osmnx and plotted with #geopandas & #matplotlib. font: Scoglietto by Petra Heidorn
took me far too long to work out the required OpenStreetMap tags to get the nodes for the regional capitals.
#30DayMapChallenge Day 3: #Polygons
Nom.
https://fediscience.org/@tlohde/113412191058419280
@tlohde - Croissant Distribution🥐 📊
or, where am I most likely to have my next croissant, assuming (something something) independence from my previous croissant. 🥐^k * e^(-🥐) / k!
--
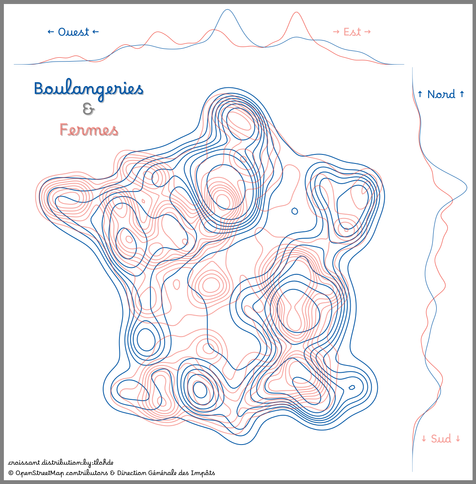
2d kernel density estimation of the location of bakeries (blue) and farms (red) across France.
Locations taken from OpenStreetMap, with #osmnx & plotted with #matplotlib & #seaborn. font: Borel, by Rosalie Wagner.
#30DayMapChallenge Day 2: Lines
Croissant Distribution🥐 📊
or, where am I most likely to have my next croissant, assuming (something something) independence from my previous croissant. 🥐^k * e^(-🥐) / k!
--
2d kernel density estimation of the location of bakeries (blue) and farms (red) across France.
Locations taken from OpenStreetMap (considered paying attention to the size of the farm, but didn't), with #osmnx & plotted with #matplotlib & #seaborn. font: Borel, by Rosalie Wagner.
#30DayMapChallenge Day 2: Lines

