#lightsheet

2025-02-07

New publication from Kwanghun Chung lab at MIT improves on their SWITCH approach and eFLASH stochastic electrotransport to improve antibody labeling by gradually shifting the microenvironment. Looks interesting, I wonder how well it can be adapted to other labeling protocols.

Uniform volumetric single-cell processing for organ-scale molecular phenotyping
Yun et al., Nature Biotechnology 2025
doi.org/10.1038/s41587-024-025

#neuroscience #tissueclearing #lightsheet #microscopy #fluorescenceFriday

Fig. 4: Holistic comparison of transgenic and immunolabeling-based cell type labeling. a–c, 3D dataset from a PV-Cre and loxP-tdTomato dual transgenic mouse hemisphere stained with anti-PV antibody. a, Representative optical section. b, Magnified images of a. c, A percentage plot for tdTomato-only (red), anti-PV-only (green) and tdTomato and anti-PV co-positive cells (yellow) among all the labeled cells in individual representative brain regions. d–h, 3D dataset of a ChATBAC-eGFP mouse brain stained with anti-ChAT antibody. d, Whole volume rendering. e, Magnified images of d. f, A percentage plot for EGFP-only (green), anti-ChAT-only (red) and EGFP and anti-ChAT co-positive cells (yellow) among all the labeled cells in individual representative brain regions. g, Magnified view of d. h, Zoom-in view of g. Scale bars, 2 mm (cyan) and 200 μm (white). 5N, motor nucleus of trigeminal; A1, primary auditory cortex; AC, anterior cingulate cortex; BLAa, basolateral amygdala, anterior part; BLAp, basolateral amygdala, posterior part; CA1, hippocampal CA1; CA3, hippocampal CA3; CeA, central amygdala; DG, dentate gyrus; dNAmb, nucleus ambiguus, dorsal part; Ecto, ectorhinal cortex; LA, lateral amygdala; lEnto, lateral entorhinal cortex; mo, dentate gyrus, molecular layer; po, dentate gyrus, polymorph layer; Piri, piriform cortex; PPA, posterior parietal association cortex; RSA, retrosplenial cortex; sg, dentate gyrus, granule cell layer; V1, primary visual cortex;
2025-02-03

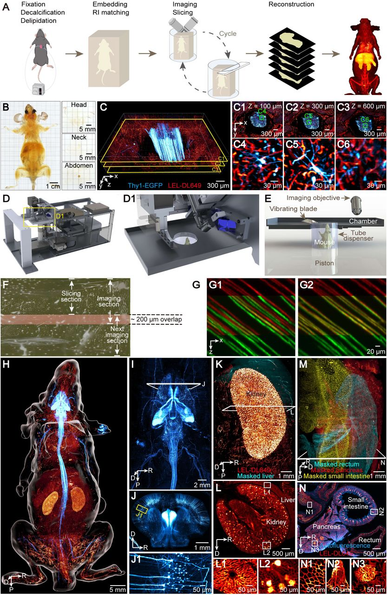
Whole-mouse imaging the hard way: Clearing, then slicing + block-face imaging with beam-scan / sensor scan-line synchronization and continuous stage movement in an oblique imaging setup (ViSOR).
This time, they scaled it up to whole-mouse and used pre-cleared mouse bodies (ARCHmap-blockface-ViSOR):

High-speed mapping of whole-mouse peripheral nerves at subcellular resolution
Shi et al., preprint at biorxiv 2025
doi.org/10.1101/2025.01.22.632

#neuroscience #lightsheet #microscopy #MicroscopyMonday

Figure 1. ARCHmap-blockface-VISoR approach for high-throughput mapping of whole mouse body at micron resolution

(A) ARCHmap-blockface-VISoR pipeline for whole-mouse imaging.

(B) Bright-field view of a cleared 2-month-old vGAT-Cre;Ai14 mouse and 400-μm-thick sections collected during blockface imaging.

(C) 3D view of a ∼600-μm-thick thoracic volume imaged from a blockface imaging section.

(C1-C6) Representative high-resolution images showing maximum intensity projection of 20-μm-thick stacks in (C) at depths of 100 μm (C1, zoomed-in view in C4), 300 μm (C2, zoomed-in view in C5), and 600 μm (C3, zoomed-in view in C6).

(D, D1) Blockface-VISoR setup. (D1) Magnification of the imaging region in (D).

(E) Cross section of imaging and sectioning modules of the blockface-VISoR setup.

(F) Schematic showing overlapped imaging data (pink) of ∼200-µm thickness between 2 contiguous imaging sections.

(G) Comparison of 3D intersection alignment by natural coordinates (G1) and a custom 3D reconstruction method (G2). Images of vessel fluorescence are the maximum intensity y-projection of 20-µm-thick sections in the upper section (red) and the lower section (green).

(H) 3D view of nerve and vasculature in a whole adult Thy1-EGFP mouse. Red hot (black-red-yellow-light yellow spectrum), LEL-DL649; cyan hot (black-blue-cyan-white spectrum), Thy1-EGFP; white surface, whole mouse.
2025-01-31

New deep-learning cell detection pipeline for light-sheet mouse brain image stacks, with an interesting cell-coordinate clustering statistics approach:

A deep learning pipeline for three-dimensional brain-wide mapping of local neuronal ensembles in teravoxel light-sheet microscopy
Attarpour et al., Nature Methods 2025
doi.org/10.1038/s41592-024-025

Code: github.com/AICONSlab/MIRACL

Documentation: miracl.readthedocs.io/

#lightsheet #microscopy #ImageAnalysis #neuroscience

Fig. 1 a–c, Intact whole brains immunolabeled, cleared and imaged with LSFM were used as input to the ACE pipeline. a, Whole-brain LSFM data are passed to ACE’s segmentation module, consisting of ViT- and CNN-based DL models, to generate binary segmentation maps in addition to a voxel-wise uncertainty map for estimation of model confidence. b, The autofluorescence channel of data is passed to the registration module, consisting of MIRACL registration algorithms, to register to a template brain such as the Allen Mouse Brain Reference Atlas (ARA). High-resolution segmentation maps are then voxelized using a convolution filter and warped to the ARA (10 µm) using deformations obtained from registration. c, Voxelized and warped segmentation maps are passed to ACE’s statistics module. Group-wise heatmaps of neuronal density are obtained by subtracting the average of warped and voxelized segmentation maps in each group to identify neural activity hotspots. To identify significant localized group-wise differences in neuronal activity in an atlas-agnostic manner, a cluster-wise, threshold-free cluster enhancement permutation analysis (using group-wise ANOVA) is conducted. The resulting P value map represents clusters showing significant differences between groups. Correspondingly, ACE outputs a table summarizing these clusters, including their volumes and the portion of each brain region included in each cluster.
2024-12-26

Cool custom-built #lightsheet #microscopes: Turns out you can build a tiny light-sheet projector by whipping an optical fiber back and forth in front of a GRIN lens. The entire assembly is hand-made (coils, magnet, casing) and fits into an 18G needle. This looks like it could be super useful for imaging deep in vivo, e.g. low in a cortex.

Light-sheet microscopy enabled by a miniaturized plane illuminator
Kim et al., Biomed Optics Express 2024
opg.optica.org/boe/fulltext.cf

#neuroscience #microscopy

Fig. 2 of the paper. It shows three views of the optics construction. Left, an illustration of the principle. An optical fiber is swing back and forth in a hollow tube with a lens at the end, with the beam being projecting to different points in space. 
Middle and right, two views of the detailed construction of the optics. Tiny hand-wound coils are glued to the fiber and move it towards or away from magnets (manually ground to size) at the tube wall. Two sets of coils and magnets move the fiber in the X and Y axis. At the end of the tube, the beam is focused by a GRIN lens and aimed sideways via a prism.
2024-11-24

Wow, TRISCO (née TRIC-DISCO) is out in Science! This cool approach allows imaging of mRNA transcripts throughout the cleared mouse brain. It uses a signal amplification step with in situ Hybridization Chain Reaction (isHCR) and combines it with DISCO-style solvent-based #tissueclearing to make the brain transparent.

Whole-brain spatial transcriptional analysis at cellular resolution
Kanatani et al., Science 2024
doi.org/10.1126/science.adn994

#neuroscience #lightsheet #microscopy #isHCR #mRNA #TRISCO

Fig. 3. Multiplexed TRISCO staining of whole brains.
(A) Schematic of the TRISCO protocol spanning 15 days. (B) (Top) 3D rendering of the whole brain from an 8-week-old adult mouse stained using TRISCO for cortical interneuron transcripts: Somatostatin (Sst mRNA, red), Parvalbumin (Pvalb mRNA, green), and Glutamate decarboxylase 1 (Gad1 mRNA, blue). (Bottom) Single-channel views. Bounding box, 7.7 × 10.6 × 5.5 mm. (C) Optical cross section at z = 2875 μm of the TRISCO brain in (B). (Right) Single-channel views. (Bottom) Magnified views of the hippocampus region at the indicated box. Nuclear staining was done with DiYO-1. Scale bars, 1 mm (white) and 200 μm (yellow).
2024-10-02

In case anyone was following the recent Science paper about using Tartrazine for #tissueclearing, apparently there is at least one (competing) group that couldn't reproduce it and wrote a preprint about it:

Tartrazine cannot make live tissues transparent
doi.org/10.1101/2024.09.29.615

Discussion on Pubpeer, including the Tartrazine paper's author's response:
pubpeer.com/publications/81314

#lightsheet #microscopy #tartrazine

2024-10-02

New solvent-based #tissueclearing protocol claims reduced tissue distortion: Dehydration/delipidation with Hexanediol, tert-Butanol and N-butyldiethanolamine, and clearing with Benzyl Benzoate / PEGMA / N-butyldiethanolamine.

SOLID: minimizing tissue distortion for brain-wide profiling of diverse architectures
Zhu et al., Nature Comms 2024
doi.org/10.1038/s41467-024-525

#tissueclearing #neuroscience #lightsheet #microscopy

A Bright-field images of the cleared mouse hemispheres treated with different reagents at a concentration of 30%, including 1,2-hexanediol (1,2-HxD), methanol, ethanol, tert-butanol (TB) and tetrahydrofuran (THF). B Quantitative analysis of relative transparency for different cleared samples shown in (A) (n = 3 samples). P (1,2-HxD vs. Methanol)<0.0001; P (1,2-HxD vs. Ethanol)<0.0001; P (1,2-HxD vs. TB) < 0.0001; P (1,2-HxD vs. THF) < 0.0001. C Representative images of the whole mouse brains at indicated time points during different dehydration steps. D Quantitative analysis of changes in the relative sample size during dehydration (n = 3 samples). E The established SOLID pipeline.
Bruno C. Vellutiniblog@brunovellutini.com
2024-09-18

Mitotic Waves video wins Small World in Motion

My video of mitotic waves won Nikon’s 2024 Small World in Motion video competition! I’m thrilled 🎉

https://www.youtube.com/watch?v=KhKlUu1SdZI

To learn more about the video, check out Nikon’s press release and their article for the series Masters of Microscopy.

There’s also a blog post that I wrote a couple of years ago with some biological information and technical details about how I created the video.

If you are wondering about the size of the embryo and how fast it really develops, there’s a version with a scale bar and time label on YouTube and available for download and re-use on Wikimedia Commons.

Thanks for your support :)


URL: https://brunovellutini.com/posts/mitotic-small-world/

#diptera #drosophilaMelanogaster #embryo #lightsheet #microscopy #scienceOutreach #video

2024-09-09

New #tissueclearing #preprint uses a custom mouse behaviour + deep-learning c-Fos analysis pipeline to compare several different Serotonin receptor agonists / antagonists in mice.

Concerted modulation of spontaneous behavior and time-integrated whole-brain neuronal activity by serotonin receptors
Friedmann et al., preprint at biorxiv 2024
doi.org/10.1101/2024.08.02.606

#lightsheet #microscopy #serotonin #neuroscience #preprint #brainmapping

Fig. 3 Overview of the effect of serotonin receptor agonists and antagonists on whole-brain Fos maps.

a, Experimental design for whole-brain analysis pipeline of Fos image data. b, Left, horizontal view of a 500-µm Z-projection of raw Fos image data. Right, zoom in of the boxed region from the left image (top), which is segmented by 3D-Unet based TrailMap. Centroids are established as local maxima detected from the probability maps and a 6-connected neighborhood of raw intensity values is averaged to be the intensity of each centroid. c, Horizontal (left) and coronal (right) depth-coded views of a single brain’s detected centroids demonstrate even coverage across the entire intact brain. d, Total numbers of counted nuclei per mouse and grouped by drug treatment. e, Scatter plot of average Fos intensity against the total Fos count (as in d) for all 168 mice, color coded by drug treatment. Linear fit shows significant correlation, R2 = 0.281. f, A representative 100-µm coronal slice of saline-subtracted Fos intensity maps for each drug treatment group, averaged across individuals within treatment groups. g, Coronal slices (as in f) across anteroposterior axis for two example drug treatment groups. h, Average saline-subtracted Fos intensity for the two drug treatment groups in g for all nuclei in each of 282 Allen-brain regions at the bottom, color coded according to Allen Brain Atlas38. Each dot represents data from an individual mouse.
2024-09-09

New #tissueclearing paper checks oligodendrocyte distribution throughout the entire mouse brain. Looks pretty neat!

Brain-wide mapping of oligodendrocyte organization and oligodendrogenesis across the murine lifespan
Xu et al., preprint at biorxiv 2024
doi.org/10.1101/2024.09.06.611

Github: github.com/yxu233/Xu_Bergles_b

#neuroscience #lightsheet #microscopy #preprint #oligodendrocyte #myelination

Figure 1. Visualization of whole brain myelin patterns.
A. Oligodendrocyte somata and myelin sheaths are fluorescently labeled in Mobp-EGFP mice.
B. Representative confocal images showing colocalization of ASPA and endogenous EGFP.
C. Quantification of ASPA colocalization across mouse strain and age in gray and white matter.
D. Schematic illustration of clearing pipeline (left) along with images of cleared brains at each step
(right).
E. Schematic of brain mounting with UV light (purple) activated glue and 3D printed sample holders. Lightsheet illumination objectives scan perpendicular to sample.
F. Representative FOVs of single horizontal plane from lightsheet volume acquired with low
resolution 5×/0.16 NA air objective (left). FOVs highlight the diversity of myelin patterns across
brain regions (insets right).

For #TBT, we’re looking back on the interviews with CZI grantees by Constadina Arvanitis & Mariana De Niz. This week we’re highlighting Alenka Lovy, whose CZI project aims to connect labs by implementing light sheet microscopy at a larger scale.
focalplane.biologists.com/2024
#microscopy #lightsheet #microscope #interview

2024-06-17

This preprint looks like a conceptual advance for deeper staining (also in human tissue) and multi-round multiplexed immunostaining with BABB clearing.

INSIHGT: Accessible multimodal systems biology with quantitative molecular phenotyping in 3D
Yau et al., preprint at biorxiv 2024
doi.org/10.1101/2024.05.24.595

#tissueclearing #lightsheet #microscopy #neuroscience #FluorescenceFriday

Fig. 2A: (A) Experimental steps and principle of INSIHGT for
immunostaining. Top row: Tissue is infiltrated with antibodies and a weakly coordinating superchaotrope ([B12H12]
2-, purple
dodecahedron) in the 1st staining solution and then transferred into the 2nd solution containing a complexation agent (CD, red
ring). Bottom row: The molecular principles of INSIHGT. Weakly coordinating anion prevents antibody-antigen interactions,
removing penetration obstacles. After homogeneous infiltration, subsequent γCD infiltration complexes the [B12H12]
2- ions,
allowing deep tissue immunostaining.Fig. 6A+B: . (A) Schematics of the processing steps for a 1mm-thick mouse hypothalamus
sample. (B) A selection of multi-round immunostaining signals (for nine targets) displayed for the multi-round multiplexed
INSIHGT-processed sample.
2024-05-22

Landmarking via UV-activatable dye makes mapping between light-sheet and confocal imaging possible

Correlative multiscale 3D imaging of mouse primary and metastatic tumors by sequential light sheet and confocal fluorescence microscopy
Zheng et al., preprint at biorxiv 2024
doi.org/10.1101/2024.05.14.594

#preprint #tissueclearing #lightsheet #microscopy

2024-05-16

Interesting new #preprint about #tissueclearing and #lightsheet #microscopy in mouse ovaries. Complete with #napari-based deep-learning pipeline and detailed build instructions for 3D-printed sample chambers for solvent-cleared samples, so they can be viewed under a #confocal!

OoCount: A machine-learning based approach to mouse ovarian follicle counting and classification
Folts et al., preprint at biorxiv 2024
biorxiv.org/content/10.1101/20

Fig. 3: Mounting and preparing adult ovaries for imaging. 1. Print a coverslip'n'slide and gather materials for mounting the samples. Note the fillinf inlets on the coverlip'n'slide indicated with the blue arrows. 2. Apply super glue around the edges of a coverlslip and attach it to the the coverslip'n'slide. 3. Load syringe with sealant for more precise control over application. 4. Using the syringe, create a chamber using sealant by lining the edges of the coverslip. 5. Arrange the samples on the coverslip. 6. Apply a coverslip to the top of the sealant, creating a chamber. 7. Gently push on the top coverslip until it touches the samples. 8. Using a pipet, fill the chamber with ECi. 9. Plug the filling inlets with sealant. 10. Allow to cure for 1h before imaging.
2024-04-23

Very excited that our whole-mouse-brain analysis pipeline - DELiVR - is published now at Nature Methods. With DELiVR, we built an open-source, easy-to-use pipeline for analyzing image stacks from cleared mouse brains.

Paper: nature.com/articles/s41592-024
Code: github.com/erturklab/delivr_cf
Docker containers, test dataset, handbook: discotechnologies.org/DELiVR/

#neuroscience #tissueclearing #lightsheet #imageanalysis

Fig. 1 about DELiVR: 
Step 1: Tissue clearing, light-sheet microscopy
Step 2: Generate custom training data in VR 
Step 3: run the analysis pipeline with the custom-trained deep-learning model inside the dockerized DELiVR pipeline
2024-04-11

Check out our simple solution for imaging between the #zebrafish eyes (or other hard-to reach sample regions) during #lightsheet microscopy:
biorxiv.org/content/10.1101/20

Zebrafish larva and micro-prism, overlayed with excitation laser paths for exposure of a dual illumination plane
2024-04-07

Interesting #preprint: New mouse brain atlas links high-resolution MRI and light-sheet imaging, finally placing Allen Brain Atlas coordinates in stereotaxic space.

#tissueclearing was done via LifeCanvas and includes 17 common neuron type markers:

Preprint: biorxiv.org/content/10.1101/20

Atlas + webviewer here (requires registration): civmimagespace.civm.duhs.duke.

#lightsheet #microscopy #neuroscience #neuroanatomy

Fig. 1: 
The Duke Mouse Brain Atlas (DMBA), a multimodal stereotaxic atlas of the mouse brain.

A-C: Mouse brain as imaged by Micro-CT 

D-F: Same mouse brain cleared and imaged with light-sheet microscopy, then mapped back onto the same MicroCT image space
2024-03-24

Our paper on Oblique #lightsheet #Microscopy with dynamic remote focusing is now online!
Also, all the relevant data is public on Zenodo, because open data is great!
If you are a fellow microscopist and are attending FOM 2024, i will be giving a talk about it at 11, come say hi!

Paper doi: doi.org/10.1117/1.JBO.29.3.036

Datasets link: zenodo.org/records/10829795?to

2024-03-19

Very cool new #tissueclearing #preprint - a clearing protocol for marine invertebrates aptly named See-Star.

Works on echinoderms and molluscs (i.e. sea stars, sea urchins, slugs and cuttlefish). I wonder whether it also works on terrestrial snails then?

See-Star: a versatile hydrogel-based protocol for clearing large, opaque and calcified marine invertebrates
Clarke et al., preprint at biorxiv 2024
biorxiv.org/content/10.1101/20

#lightsheet #microscopy #science #marinebiology

Fig. 3 from Clarke et al., showing colorful immunostainings for acetylated slpha-tubulin in a cleared sea star at various stages of development. The bottom panels show immunostaining for Serotonin in a squid larva.
2024-03-12

Interesting preprint on using a #machinelearning frame interpolation technique originally developed for videos on biomedical image stacks (for spatial interpolation): They claim broad applicability for #MRI, #lightsheet microscopy, #histology and #cryoEM image stacks.

Generative interpolation and restoration of images using deep learning for improved 3D tissue mapping
Joshi et al., preprint at biorxiv 2024
biorxiv.org/content/10.1101/20

#genai #imaging

(e) Tissue-cleared light-sheet images were interpolated skipping 7 slides 
between adjacent sections, thereby generating 7 slides. (f) Qualitative comparison of linear and FILM interpolations to the authentic image for the middle-interpolated light-sheet image (image 4). Arrowhead shows linear interpolation creates double boundary lines around bronchioles. In second row, the arrowhead shows photobleaching in authentic reduced by linear interpolation and completely removed by FILM (arrow). (g) Principal component analysis of thirteen Haralick features for authentic, FILM, and linearly interpolated light-sheet images for various numbers of skipped light-sheet images. Mean Euclidean distance of interpolated images from authentic images based on thirteen Haralick features. (h) Euclidean distance by slide of interpolated images from authentic images based on thirteen Haralick features for various numbers of skipped light-sheet images.

Client Info

Server: https://mastodon.social
Version: 2025.04
Repository: https://github.com/cyevgeniy/lmst