#heatmap

2025-05-26

MangledCommunication

Video: youtube.com/watch?v=SwQuX92n5t

#Livecoding #CreativeCoding #chromatic #visualcommunication #colorscape #glitchart #dataart #heatmap #dataviz

Blogpost: blog.illestpreacha.com/colorsc

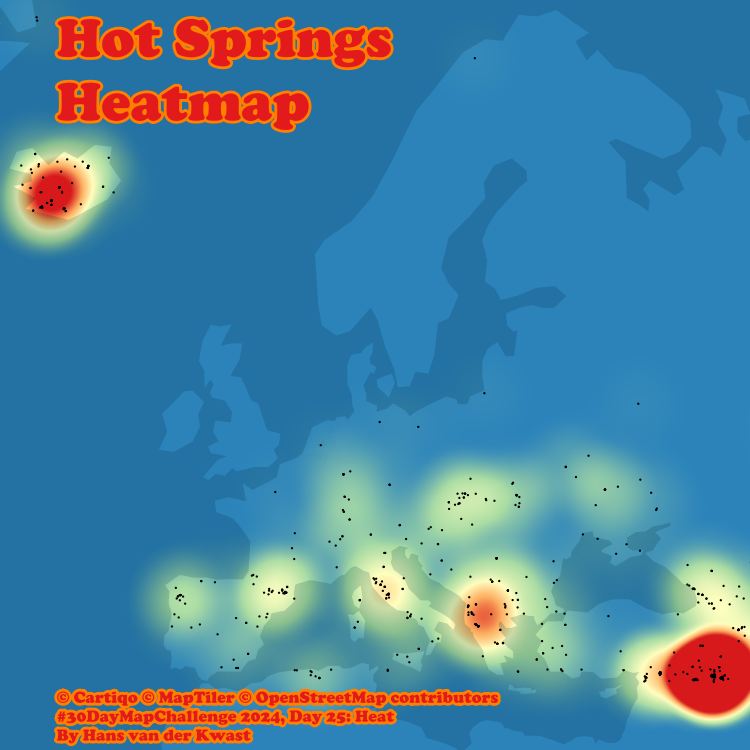
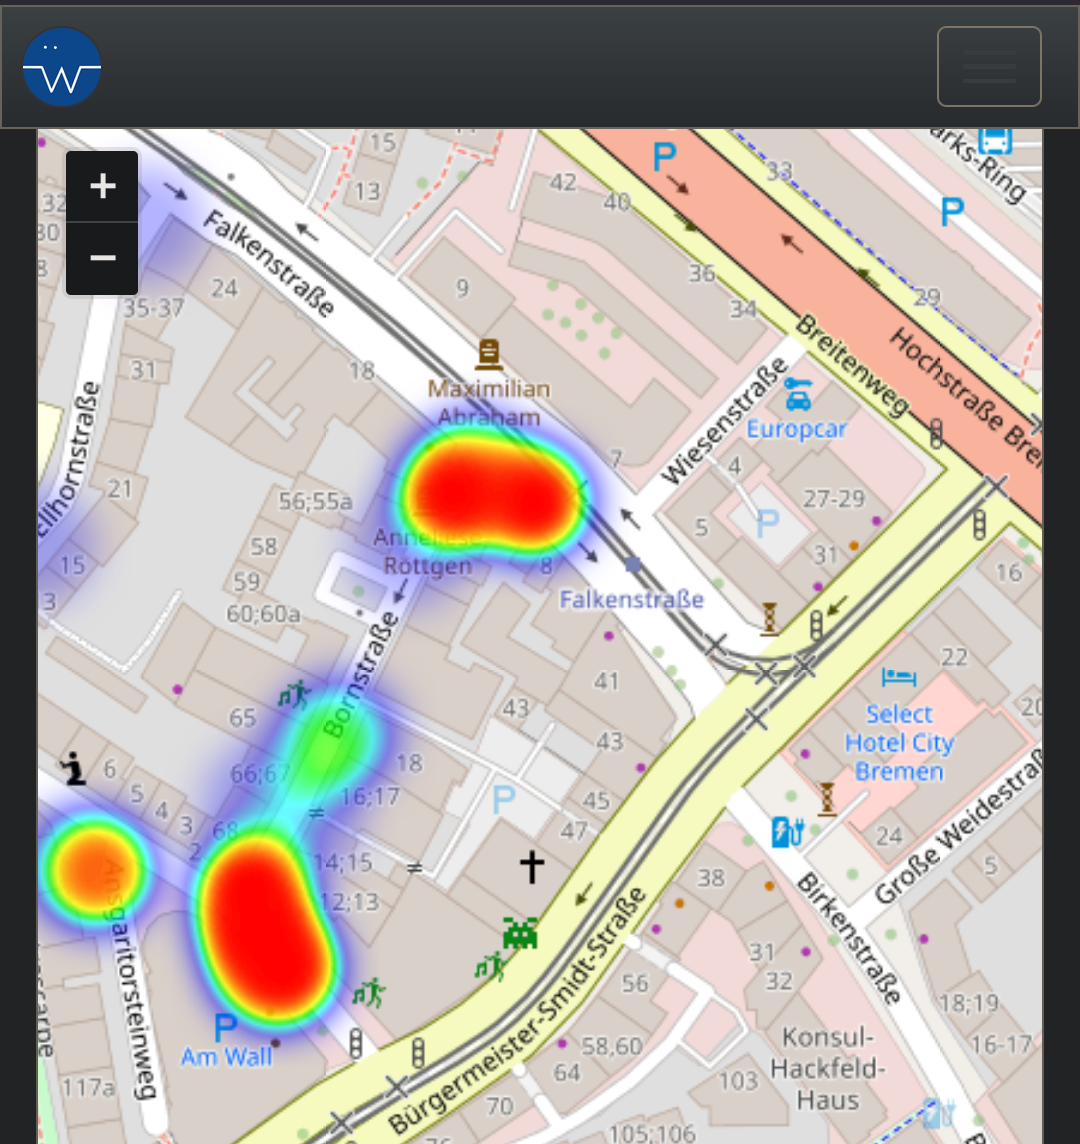
MangledCommunication is coded in #Python & #SonicPi and tries to showcase how colors may speak differently to people. In this series, the colors and grids are made from heatmaps derived from sports data that was web scraped through Python and then mangled for the user to decipher. With additional sounds coded in SonicPi to further drive this notion.

#Poetry

Colors can bring ease
Colors can feel like a breeze
May develop new emotional parts
Certain shades may attract a freeze
Or bring upon a new start
Colors can symbolize clean
But sometimes we wonder, what do they mean?

#colorsplash #abstractart #geometrical #digitalart #Worldbuilding #animation

2025-04-14

MSSQL: тепловые диаграммы индексов в виде TreeView

Вам интересно, какие индексы используются больше или меньше? Какие не используются вовсе? Какие таблицы и индексы самые большие? Очень легко создать такие диаграммы. Это и красиво, и полезно.

habr.com/ru/articles/900722/

#sql #treeview #heatmap #python

2025-04-04

Many thanks to Zuguang Gu for the wonderful #Bioconductor package #ComplexHeatmaps. Fantastically documented and useful.

github.com/jokergoo/ComplexHea

#rstats #heatmap #dataviz

Canadian Money TalkCanadianMoneyTalk@mstdn.ca
2025-03-23

Video: Where to invest around the World

A #heatmap shows the net cumulative total #returns of major #global equity #indices, across three regions: #Americas, #Europe, and #APAC (Asia-Pacific), for up to 10 years of returns. We can see strong areas, such as #US tech (#Nasdaq100) and #SP500 and #Taiwan, which may be becoming overpriced, while also pointing to weaker spots like #Emerging #European #markets, #Spain, #Singapore, #Malaysia and #China, as areas of…

canadianmoneytalk.ca/2025/03/2

2025-03-14

Eine #Heatmap wie bei git wäre cool...

d'aïeux et d'ailleursdaieuxetdailleurs@framapiaf.org
2025-03-09

La suppression des vieux comptes Carto.com signifie aussi la suppression des supers #cartesdechaleur dynamiques faites lors du #datasprint #archives (#AAFAngers2016) :

- Evolution de #Rennes de 1908 à 1985 datasprintaaf.carto.com/viz/b6

- Reconstruction d'#Orléans ap. 1945 : datasprintaaf.carto.com/viz/a0

#cartographie #historicalmaps #urbanisme #histoire #heatmap #dataviz #permisdeconstruire #passioncarto

#Archivage en cours avec sauvegardes vidéo et téléchargement des dataset poke @ArchivesOrleans

2025-02-20

Visualizing Sales Data with a Matplotlib Heatmap: A Step-by-Step Guide
Visualize your sales data effectively with a Matplotlib Heatmap! Learn how to create insightful heatmaps step-by-step, from basic setup to advanced customization.
tech-champion.com/programming/

2025-01-29

☀️ Since i'm making graphics and infographics, i never really tried a waterfall heatmap.

The time has come, and its gorgeous (here, you can see the amount of precipitation thourgh months, and cities) 🌧️

☀️ Depuis que je fais des infographies, je n'ai jamais vraiment essayé une waterfall heatmap. 🌧️ En fait, c"est beau (ici, vous pouvez voir la quantité de précipitations au fil des mois et des villes)

#data #dataviz #heatmap #infographic #infographics #infography #datascience #mapping

Waterfaall heatmap of precipitation in some places of North of France, since 2021.
Kajo 📷 :mastolove:Kajo@social.tchncs.de
2025-01-15

Schnapp mir gleich mein GPS und hol mir noch ein paar "Kilometer" in der Nachbarschaft.

Will ja nicht nur #Squadratinhos sammeln, sondern auch die #Heatmap vervollständigen 💪 Jeden Waldweg und jede Straße in meiner Homezone mitnehmen.

Will jemand mitkommen? 🚶‍♀️
Team #Konditionsaufbau

#GeoActivityPlayground

2025-01-09

The whole town of Altadena burned. The fire started east of town in the foothills and spread west and south. Nearly every structure gone.

#LAFire #Altadena #EatonFire #LAFires #LosAngeles #Wildfire #Wildfires #SatelliteMap #IR #HeatMap

cnn.com/weather/live-news/los-

Satellite image using infrared technology showing nearly every structure in the town of Altadena burning. It looks like a map, with houses, building, streets. Except every house and building is glowing orange, on fire.
2024-12-31

Noch ne Jahresabschluss #heatmap von meinen Radaktivitäten. Viel Rennrad, etwas Pendeln, etwas MTB. Die längeren Touren wollte ich dieses Jahr etwas mehr in verschiedene Himmelsrichtungen verteilen. 😃
#BikeTooter #lifebehindbars

Heatmap mit Blick Region um Sachsen, zumindest um Dresden recht gute Streckendichte.
Tuomas Väisänen 📼🧟‍♂️waeiski@vis.social
2024-12-31

Had someone made a real-time #visualisation of all #GitHub or #GitLab commits? I remember seeing a #heatmap visualisation of the number of all global commits or something similar.

Thinking of something to put up on one of the monitors in the coffee room.

#dataviz

2024-12-31

@uedio Man könnte doch KI nutzen um den idealen Endlagerungsort zu finden: da wo die meisten KI-Nutzer sind kommt das Endlager hin. #heatmap

2024-12-12

Some types of #visualizations are just amazing with regards to efficiency of #pattern detection. Below #heatmap is based on "percentage in use", while the #graph is based on "bytes free", and the visual difference is massive:

Heatmap showing disk usage of a couple of machines over a timeframe of 30 days, with visual patterns of how space is being used - sometimes more, sometimes less.Graph with many lines in different colors showing free disk space of a couple of machines.
StmpAch 🏳️‍🌈StmpAch@social.cologne
2024-12-05
Hans van der Kwast :qgis:hansakwast@fosstodon.org
2024-11-25

#30DayMapChallenge Day 25: Heat 🔥

#HeatMap of #hotsprings in Europe using #QGIS. #OpenData from #OpenStreetMap, backdrop from #Cartiqo via the #MapTiler plugin. A heatmap shows data density with a colour ramp with warmer colours for higher densities. #GIS #Mapping

2024-11-09

Auf meiner Hausjoggingstrecke durch die Straße auf Platz Nr. 16 von @koeln in der #Heatmap von wegli-monopoly.vercel.app/koel gelaufen. Heute waren es auf den 300m 28 #Gehwegparker, beim letzten mal 31.
Besonderheiten wie immer: #Gehwegparken mit blockieren des #Stellplatz vor'm Haus. Beispiel gefällig! Na gut, das machen andere auch, Bild2 ist 2 Straßen weiter.

Nochmals einen speziellen Dank an @andieckeparkt für dieses Auswerte-Werkzeug!

me·ta·phil, dermetaphil@chaos.social
2024-11-01

Sag mir, wo der örtliche Hackspace sitzt, ohne mir zu sagen, wo der örtliche Hackspace sitzt.

#wegli #heatmap #bremen #falschparker #verkehrswense #autokorrektur #RunterVomGehweg #Gehwehparken #hshb

Screenshot der Heatmap-Karte mit Einfärbung der Stellen mit den meisten Falschparker-Meldungen über das sehr komfortable weg.li-Portal.
Die Karte zeigt zwei große rote Blobs an den beiden Enden der Bornstraße, in der ein Bremer Hackspace/Makerspace seine Räumlichkeiten hat.
2024-10-30

Bluesky Heatmap
generate heatmaps based on bluesky posting frequency
Source Code: https://github.com/aliceisjustplaying/bluesky-heatmap

Client Info

Server: https://mastodon.social
Version: 2025.04
Repository: https://github.com/cyevgeniy/lmst