
See The Mississippi River’s Hidden History, Uncovered By Lasers
Using hyperprecise LiDAR data,. a cartographer [well, hydrographer!] maps the river’s bend and channels over time with mesmerizing results…
--
https://www.nationalgeographic.com/science/article/mississippi-rivers-hidden-history-uncovered-by-lidar <-- shared technical / media article
--
https://dancoecarto.com/ <-- shared @Daniel Coe portfolio and more
--
https://usace.contentdm.oclc.org/digital/collection/p266001coll1/id/10015/ <-- shared Harold Fisk's 1944 USACE report, “The Alluvial Valley of the Lower Mississippi River”
--
#GIS #spatial #mapping #water #hydrography #hydrology #LiDAR #remotesensing #spatialanalysis #spatiotemporal #hydrogeomorphology #Mississippi #River #Fiske #cartography #visualisation #meandering #channels #landforms #floodplains #opendata #3DEP #topography #geomorphology #levees #dikes #oxbows #channel #paleohydrology
#DanielCoe | @nationalgeographic | #USGS | #USACE
#visualisation


Assumption: CSV file has a header and then lots of data.
Reality: My parser works fine!
After four years: PD has changed their outputs and now suddenly the header can appear in the middle because more non-static data has become available and all graphs are wrong from that point on.
Me: Time to dust off this project, reimplement the CSV extraction, change the graphing engine and redo the UI.
Life of a tools guy at work 🙂
Earth's Magnetic Shield Protecting The Planet From A Pelting By The Solar Wind
See how the sun's energy drives a remarkable planetary engine, the climate
--
https://youtu.be/6hD52H7rQak?si=OBGYbK8Czbi0uwlc <-- shared video
--
[‘cannibalising’ (sic) my own post (!) to bring attention to this outstanding video visualisation and overview, science education/explanation at its finest!; narrated so well (of course!) by #liamneeson !!]
#GIS #spatial #mapping #geology #structuralgeology #magneticfield #SouthAtlanticAnomaly #SAA #spaceweather #geomagnetism #risk #hazard #hardening #magneticfieldstrength #protection #CME #coronalmassejection #sun #solar #solarwind #visualisation #visualization #education #scienceeducation #overview #explanation
#NASA

Fitting in well with #ReclaimTheEconomyWeek we're looking at how we could use doughnut visualisations from farm data.
https://growgood.org.au/en/blog/doughnut/
#ReclaimTheEconomy #GrowGood #AgTech #OpenSource #RegenerativeAgriculture #visualisation

#Changement #climatique :
Cette #visualisation de la #NASA rend enfin visible ce qu’on peine à imaginer : 30 ans de montée des #océans en quelques secondes

#Changement #climatique :
Cette #visualisation de la #NASA rend enfin visible ce qu’on peine à imaginer : 30 ans de montée des #océans en quelques secondes
sciencepost.fr/cette-visual...
Cette visualisation de la NASA...

A visualisation of DNA repair and replication (https://aeon.co/videos/groundbreaking-visuals-capture-how-our-bodies-repair-damaged-dna) shows the life inside the cell at the molecular level as a very dynamic activity.
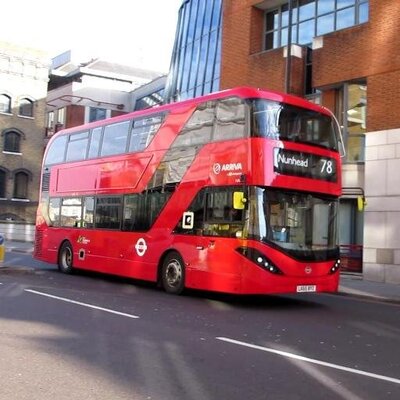
#Dublin Bus has launched Dublin Bus Innovation (DBI), a new initiative to accelerate practical #innovation and improve customer experience in #Ireland. The launch includes a €60,000 seed funding challenge, divided into four €15,000 awards across #Data & #Visualisation, #Optimisation, Collaboration, and Smart #Cities. The company is inviting employees, stakeholders, and the public to submit bold ideas via its Innovation portal, with selected proposals receiving expert guidance and funding. Minister James Lawless highlighted DBI’s role in shaping Dublin’s future #transport, while CEO Billy Hann said it supports the city’s evolving mobility needs.
https://www.dublinbus.ie/press-releases/dublin-bus-launches-dbi-%E2%80%93-dublin-bus-innovation
Everybody knows Escher's waterfall picture: A perpetual motion machine where water from the base of a waterfall appears to run downhill along the water path before reaching the top of the waterfall.
The house at the bottom left, that is at level -1 when you are at the top of the waterfall, and level 0 or higher when you take into account that water flows down, back to the top of the waterfall here.
At https://maps.app.goo.gl/yi7uqCZrk9tfiNWF7, you will see the front of the Cincotta Chemist. It's at street level 0. Zoom out a little bit and then look at the other side of the building, at https://maps.app.goo.gl/gGzBdaqtnodKcm5H6.
At street level 0 (if that stupid truck wasn't there....) you would see the entrance of the Caringbah family practise, and next to it you have the escalator ("Lift to shops") to the Cincotta Chemist.
I've been trying to get the shops in my area in the OpenStreetMap, properly with levels etc. This Cincotta Chemist is both at level 1 and at level 0, the same as the house on the Escher's waterfall. Or the escalator is going from level 0 to level 0. I just cannot get it working.
At the end I just ignored the escalator. ignored that there is a part of the chemist above the doctors, and everything is happy in my head now.... (Except for that gnawing feeling that there is a part of the map wrong)
![The image depicts a watermill with an elevated aqueduct and waterwheel as the main feature. The aqueduct begins at the waterwheel and flows behind it. The walls of the aqueduct step downward, suggesting that it slopes downhill. The aqueduct turns sharply three times, first to the left, then to the right, and finally to the left again. The viewer looks down at the scene diagonally, which means that from the viewer's perspective the aqueduct appears to be slanted upward. The viewer is also looking across the scene diagonally from the lower right, which means that from the viewer's perspective the two left-hand turns are directly in line with each other, while the waterwheel, the forward turn and the end of the aqueduct are all in line. The second left-hand turn is supported by pillars from the first, while the other two corners are supported by a tower of pillars that begins at the waterwheel. The water falls off the edge of the aqueduct and over the waterwheel in an impossible infinite cycle; in his notes on the picture, Escher points out that some water must be periodically added to this perpetual motion machine to compensate for evaporation. The use of the Penrose stairs is paralleled by Escher's Ascending and Descending (1960), where instead of the flow of water, two lines of monks endlessly march uphill or downhill around the four flights of stairs.[2]](https://files.mastodon.social/cache/media_attachments/files/115/890/406/371/747/606/original/42aad2a67960d6e5.png)

BackupViz - Visualisez votre stratégie de sauvegarde et vérifiez la règle 3-2-1
https://fed.brid.gy/r/https://korben.info/backupviz-visualisation-sauvegarde-3-2-1.html

Frockly - Vos formules Excel enfin visibles et manipulables
https://fed.brid.gy/r/https://korben.info/frockly-formules-excel-blocs-visuels.html


Friday Fun with maths: I may have accidentally discovered a new way to visualize prime numbers (?) The result? A pyramid that shouldn't exist 🤯
https://vyruss.org/blog/prime-step-spiral-visualization.html
#math #maths #visualization #visualisation #primeNumbers #mathematics #numberTheory

Common Mistake in Data Visualisation #data #visualisation #powerbi #dataanalyst #shorts
source
Is It Time To Redraw Our Maps? / ‘Free The Map’
(From migration to ecology, new knowledge makes new cartographic demands)
--
https://www.theguardian.com/books/2025/dec/14/is-it-time-to-redraw-our-maps <-- shared media article
--
https://doi.org/10.1080/17450101.2019.1676031 <--shared paper
--
https://freethemap.org/ <-- shared ‘Free The Map’ page, where “Prof. Henk van Houtum makes a compelling case for a new cartography…”
--
[this post should not be considered an endorsement of any particular viewpoint or book/product]
#cartography #cartopolitics #geography #visualisation #humanimpacts #mapping #mapmaking #GIS #spatial #interpretation #history #borders #internationalborders #jigsawpuzzlemaps #neutrality #objectivity #mappingrevolution #uncertainty #subjectivity #multiplicity


The richest 0.001% of the world's population controls three times as much wealth as the world's poorest 50%
I like a good visualisation and this is a a good visualisation.
#wealth #poverty #inequality #visualisation
https://www.theguardian.com/news/2025/dec/10/visual-breakdown-worlds-wealthiest-people.

Die Wochenendlektüre ist eingetroffen: Diving into #data #engineering and #visualisation. #rdm


#TIL about a data visualisation system called #Got;
"got protocol and all client side / frontend tools are open source
Mainly driven by the GotHub Team
GotHub and our work is funded by operating the GotHub.io platform and other alongside services
GotHub.io is a hosted Got-Provider"
Anyone know anything about this?

Using Vega Visualisation Grammar to visualise earthquakes reported by @gfzearthquakes
https://jornfranke.codeberg.page/demo-web-pages/vega-gfz-earthquakes/
#vega #visualisation #earthquakes #gep #javascript #webpage #codeberg #example

#EmotionalConditioning #Manifestation #MindPower #FutureSelf #NeurologicalHardware #EmotionalReprogramming #Beliefs #Hypnosis #SelfImprovement #PersonalGrowth #EmotionalConditioning #Manifestation #MindPower #FutureSelf #NeurologicalHardware #EmotionalReprogramming #Beliefs #Hypnosis #SelfImprovement #Visualisation #Visualization #PersonalGrowth https://mastodon.social/@biohackingpathway/115589271434296353

Just so you lot can visualize and appreciate just how badly something like that can burn into your brain.
