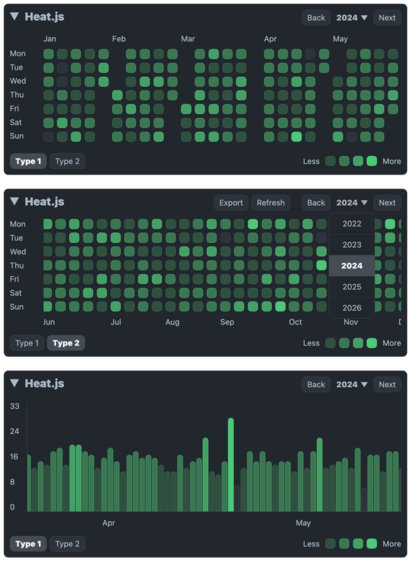
https://www.tresseo.com/articles/understanding-heatmaps-in-web-design/
#webdesign #webdevelopment #heatmaps
#heatmaps
3/ We talked about different #tools to understand users:
• User #testing to find roadblocks.
• #Heatmaps to see what really grabs attention.
• Expert #analysis to fine-tune things.
• #Analytics to measure the impact of it all.
MazePlex
Blogpost for more information https://blog.illestpreacha.com/wcccyouthgames
#wccchallenge #poetic #creativecoding #design #WCCC #dataart #maze
For this week's Creative Code challenge by @sableraph “ Youth Games”, MazePlex takes a #Python heatmap script and transforms the outputs into various mazes.
Getting Around the Maze
Seeing if there are any crack
Any place
That has enough space
To crawl, where the path doesn’t lack
Starting Lines,
Ending points but first, got to make it to the ending sign
#coding #newmedia #scifi #heatmaps #leveldesign #geometricart #speculativedesign
I'm really struggling to find a certain #monospace #font. I have seen it somewhere online. The special feature was the number characters, which were designed to visually represent the character's value by the area the ink covers of the rectangle around the character. E.g. "1" was very thin, covering 10% of the background, "4" covered 40%, "9" was reaaly bold and covered 90% of the background, and so on.
Does anyone know of this font? I saw it posted in the context of #dataviz #heatmaps #rstats
👉 Novità Strava : in arrivo dark mode, funzionalità IA e piani famiglia
https://gomoot.com/novita-strava-dark-mode-funzionalita-ia-e-piani-famiglia
#abbonamenti #blog #DarkMode #fitness #heatmaps #ia #news #pianofamiglia #picks #QuickEdit #running #strava #tech #tecnologia #running #maratona #percorsi #trail #gps #trekking
Render customizable #heatmaps
Gestalte mit!
Schließe Dich einer der lokalen Bewegungen an oder gründe selbst:
https://www.openbikesensor.org/community/
#SammelBestellungen:
https://forum.openbikesensor.org/c/sammelbestellungen/20
Beschreibung des Geräts & #BauAnleitung:
https://www.openbikesensor.org/device
Übersicht über frei verfügbare #OpenBikeSensor Portale (inkl. #DatenVisualisierung / #OpenData / #WärmeBildKarten / #HeatMaps):
https://forum.openbikesensor.org/t/uebersicht-verfuegbarer-portale/688
#VisionZero #VerkehrsSicherheit #StoppKillingCyclists #Natenom #NatenomsErbe
Mit der netten Software #GeoActivityPlayground gibt es eine schöne Möglichkeit seine aufgezeichneten Touren (Fahrrad, Wandern, Laufen, was man auch immer aufzeichnet) zu archivieren und darzustellen. Es sind so schöne Spielereien dabei wie #Heatmaps und die Darstellung, welche Gebiete man auf einer Karte schon erkundet hat. Das ist eine nette Möglichkeit, bei dem Versuch alle Kartenkacheln einmal betreten zu haben die eigene Stadt mal zu erkunden. Mal schauen, ob ich es in den nächsten Monaten schaffe, das gesamte Stadtgebiet zu erkunden.
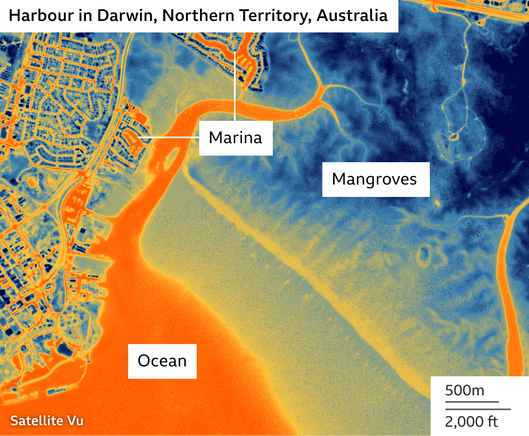
Hotsat-1 - UK Spacecraft Maps Heat Variations Across Earth
--
https://www.bbc.co.uk/news/science-environment-67010377 <--shared media article
--
#GIS #spatial #mapping #remotesensing #infrastructure #buildings #satellite #HotSat1 #heat #temperature #earthobservation #thermalsensor #hot #cold #wildfire #infrared #heatmaps #planning #urbanplanning #insulation #efficiency #heatislands #heatstress #climatechange #HVAC #climate #extremeweather #finance #industry #vegetation #urbantrees #greenbuildings #LEED
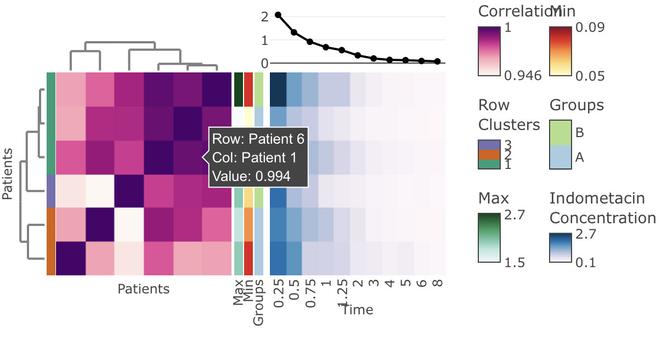
{iheatmapr} is an #rstats 📦 “for building complex, interactive heatmaps using modular building blocks.
“ ‘Complex’ heatmaps are heatmaps in which subplots along the rows or columns of the main heatmap add more information about each row or column.” An @rOpenSci 📦
https://docs.ropensci.org/iheatmapr/articles/full_vignettes/iheatmapr.html
@rstats
Alameda Police Chief Nishant Joshi aims for Alameda to be the "safest city in Alameda County” and is using data-driven policing to get there. Adam Gillitt interviews Chief Joshi to learn more about this shift in preventing and solving crime.
https://alamedapost.com/news/apd-uses-data-to-drive-policework/
#apd #data #theft #alameda #reports #CarTheft #CompStat #heatmaps #AlamedaPolice #DataDrivenPolicing #CatalyticConverters #ApdChiefNishantJoshi #AutomatedLicensePlateReader Photo by Maurice Ramirez.
This looks brilliant! Preprint on "Boosting word frequencies in authorship attribution" by Maciej Eder. Instead of relative frequencies, frequency normalisation against a background of semantically similar words was performed. Significant performance gains shown via fascinating heatmaps. See: https://arxiv.org/abs/2211.01289 #stylometry #AuthorshipAttribution #stylo #Kraków #CHR2022 #WordEmbeddings #Heatmaps #BurrowsDelta #CosineDelta
Alors, c'est fait, vous avez téléchargé les heatmaps de Suunto sur votre compteur Hammerhead? Comment ça pas encore?
.
.
.
#hammerhead #karoo2 #heatmaps #suunto #suuntoheatmaps #cycling #velo #compteurvelo #cyclingcomputer #cyclinggps #gpsvelo #instaride… https://t.co/tcGabjEwPV https://t.co/AG7MWst1jY
Mit unseren neuen #Heatmaps kann man sich z.B. auf einen Blick anzeigen lassen wie groß die Wahrscheinlichkeit ist, dass die Temperatur nach dem ECMWF am nächsten Sonntag in Frankfurt auf >20 Grad steigt.
https://kachelmannwetter.com/de/vorhersage/ensemble-heatmap
(Ort eingeben, Modell und Zeitraum auswählen) /LD http://nitter.skrep.in/Kachelmannwettr/status/1396434349633986561#m
Coronavirus-Heatmaps für Berlin
https://corona-data.eu/berlin/
#Coronavirus #Heatmaps für #Berlin. SARS-CoV2 Inzidenz-Heatmap pro Altergruppe und Kalenderwoche.
#beta #iphone #shaarligobeta via @timohenzel
https://ripf.de/m/abf7855
Interessante #Heatmaps zu #SARSCoV2 und #Inzidenz Entwicklung auf Landkreisebene, z.B. https://corona-data.eu/bayern/lk-muenchen/
#Corona


