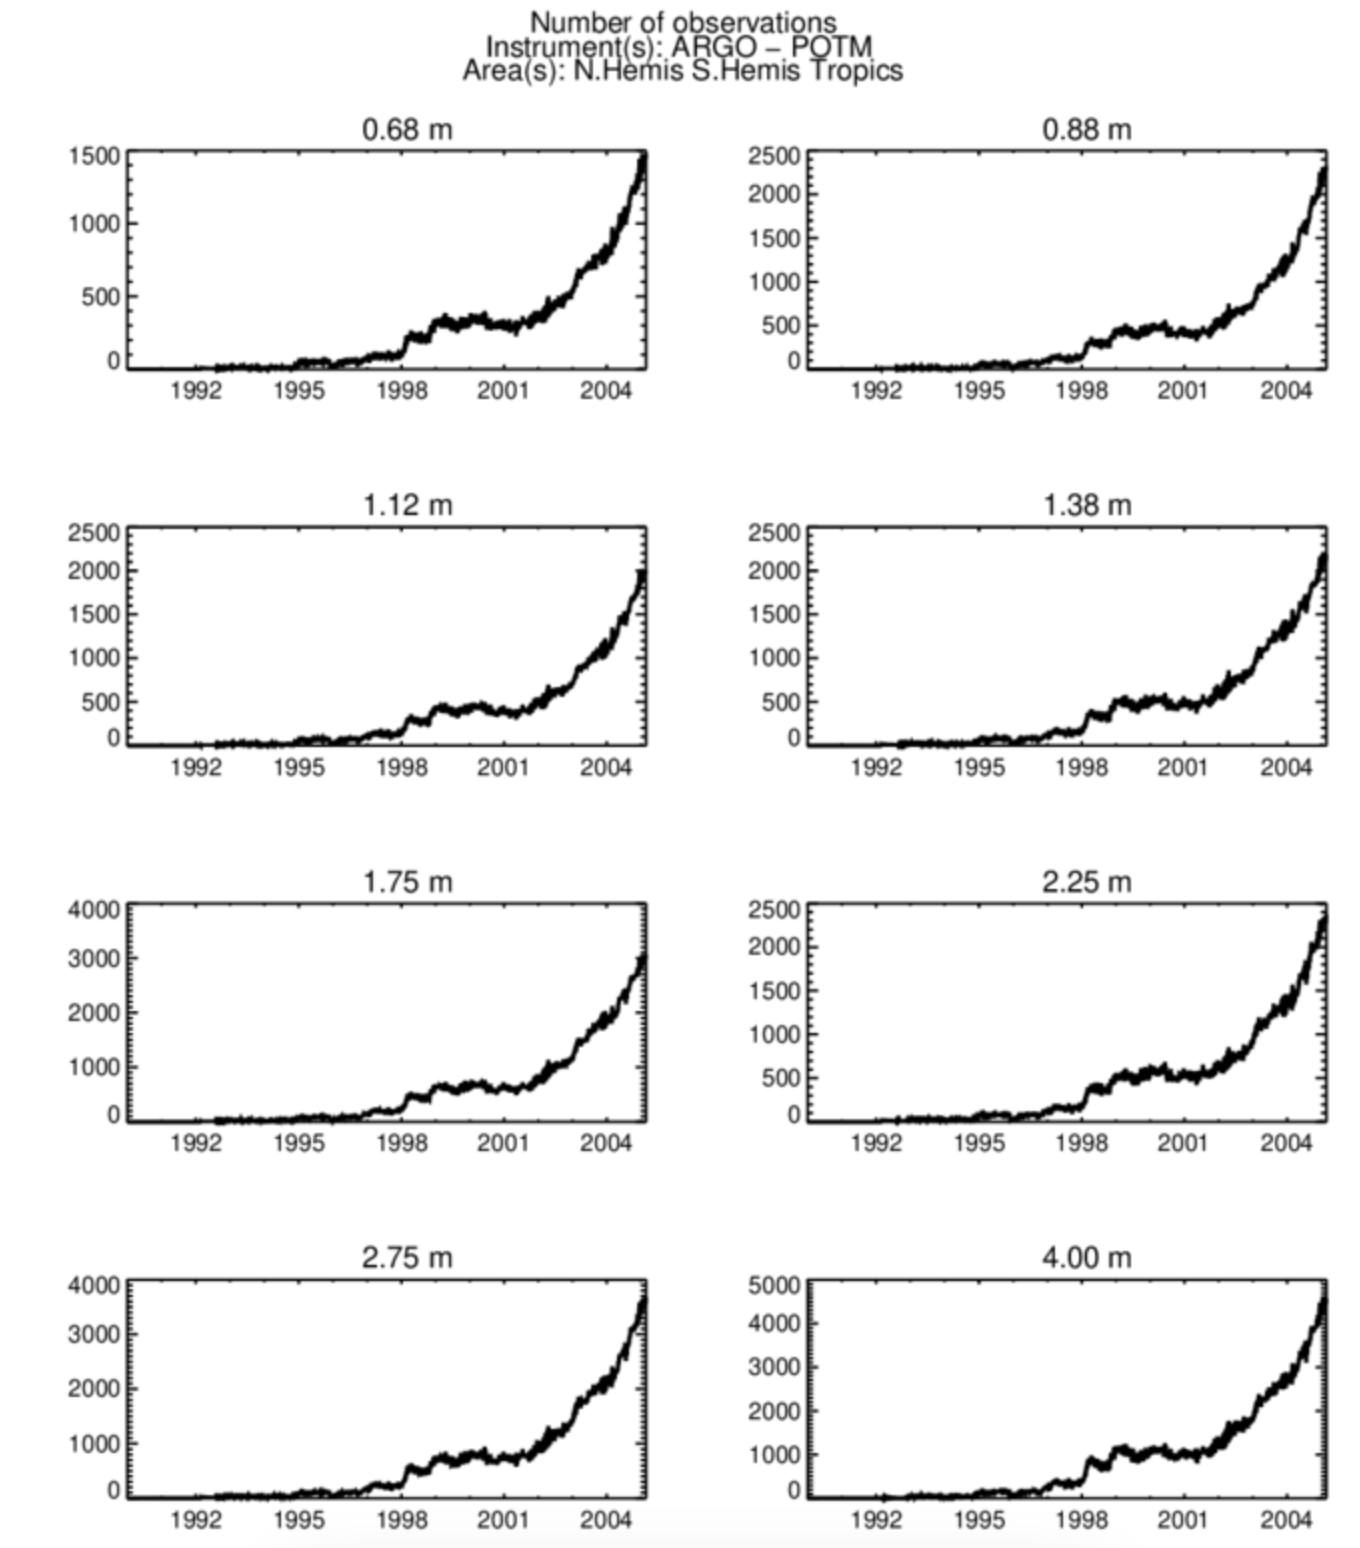
Don't you just love seeing the #ARGO network getting going?
(please ignore the mad depth units of x100m)
Don't you just love seeing the #ARGO network getting going?
(please ignore the mad depth units of x100m)
Mind = blown.
Satellite launched at December 11, 1972 07:56:00 UTC
Data available for *the day of launch* here https://data.ceda.ac.uk/neodc/esacci/sea_ice/data/sea_ice_concentration/L3C/esmr/25km/v1.1/SH/1972/12
Insane data recovery/processing by a clearly great team: https://essd.copernicus.org/articles/16/1247/2024/
Our colleagues Christina Radtke, Hannes Müller-Thomy, Tobias Langmann and Henning Müller are currently in Mexico at @UNAM_MX 🇲🇽 for a research project on #reanalysis products focusing on #hurricanes. Check out the recorded talk: https://youtu.be/AfcNuYseXcE
We are excited about upcoming collaborations!
Hello from Reading! Our colleague Janna is currently at the NWP SAF Workshop on Satellite Observations of the Earth System Interfaces (https://events.ecmwf.int/event/420/). Exciting insights and discussions about how we can exploit #satellite #observations for numerical weather #predictions and #reanalysis even better!
Nighttime #stats question: When conducting a meta-analysis, which tests would you put under Robustness and which under Sensitivity? And what is your definition of each?
4yo: Abbie, do you know this guy?
Me: no
Sivan: he’s a bad man movie. He’s name is punishp.
The first sad story in humanity's ruthless colonization of the planet.
#dodos #extinction #humans #colonisation #Reanalysis
The dodo was faster and smarter than you think | Popular Science https://www.popsci.com/science/dodo-myths/?utm_source=pocket-newtab-en-us
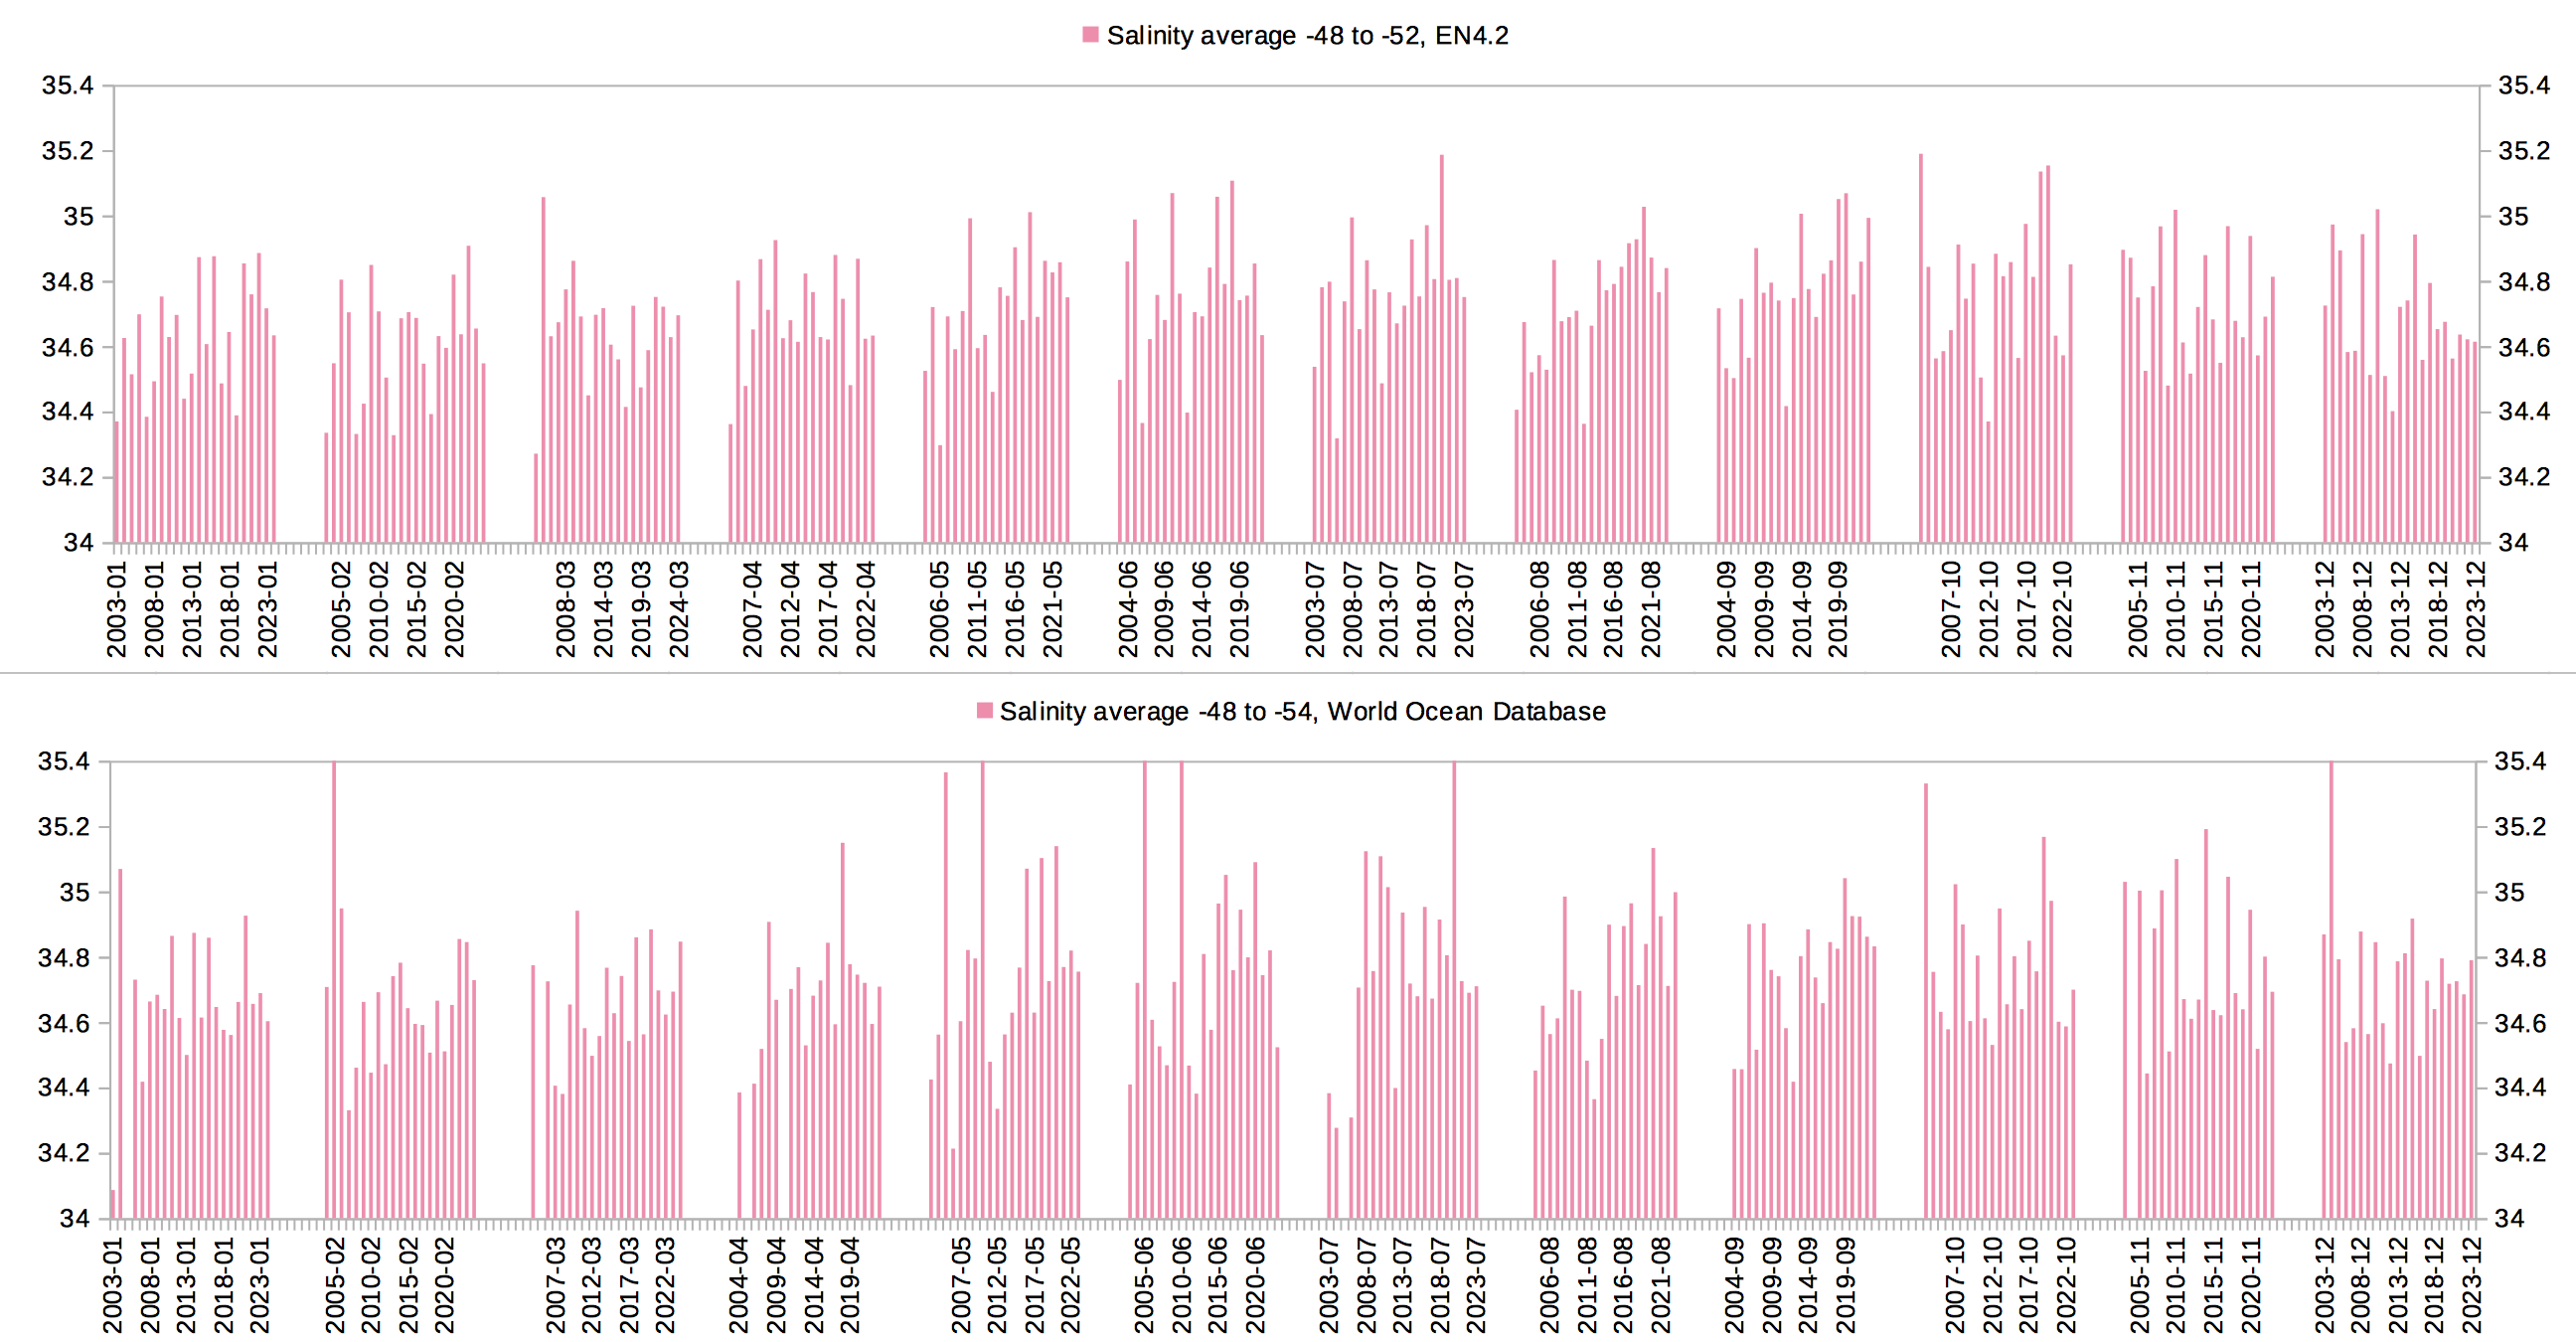
The promised plots.
I'll show data since 2003 only because only then did real measurements really kick off. Before that, measurements were so spotty with 1 in January in one year, then 3 years nothing, then 5 measurements in for example August and so on.
Data source for measurements is #NOAA https://www.ncei.noaa.gov/access/world-ocean-database-select/dbsearch.html
The other plot is from a #ReAnalysis called EN4.2 https://www.metoffice.gov.uk/hadobs/en4/download-en4-2-2.html#c14_analyses
It is based on the same NOAA data, and goes back to 1900. EN4.2 has better quality assurance than my download. And EN4.2 is able to calculate the likely values in adjacent coordinates and adjacent months.
Among other Reanalyses, EN4.2 has also been used in the newest preprint by the Dutch team around #vanWesten. It sees AMOC tip in 2065 in RCP8.5 and in 2085 in RCP4.5. But it is based on biased Reanalyses and known-to-be too stable #CMIP6: https://arxiv.org/pdf/2407.19909
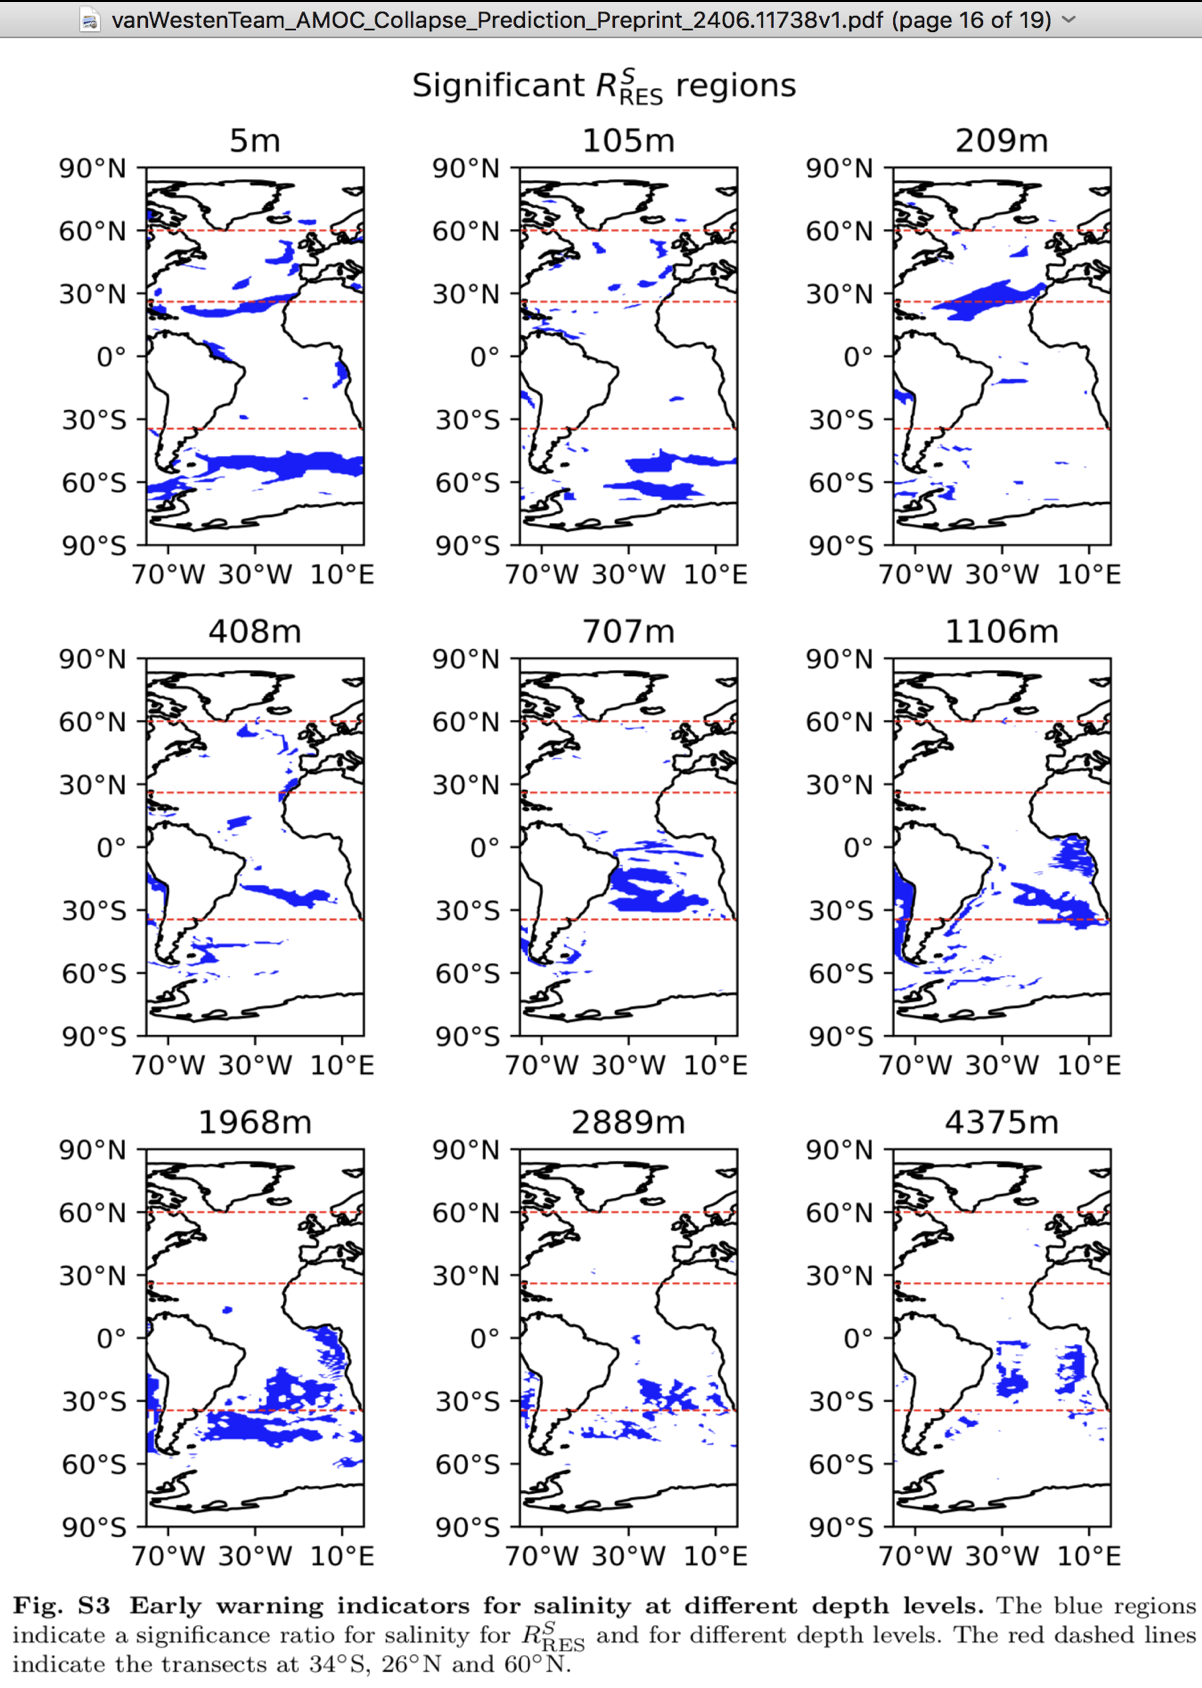
Whereas the first new preprint by van Westen's team, which tips AMOC 2037-2064, uses only real measurements of the 3 dedicated monitoring arrays in the North, tropical and South #Atlantic. https://arxiv.org/pdf/2406.11738
Here, the caveat is: very short data series.
With measurements being so spotty, I only show monthly salinity 2003ff in down to 10m depth. And only from the area in the South Atlantic. Averaged on a 2 by 2 degree grid from Argentina's coast to longitude -48, and latitudes 40-48 South.
Sorry, not sorry: neither dataset shows a smoking gun. 😁
#FridaysForFuture #ChartsForFuture
A couple of very important articles in the @ECMWF newsletter here from my perspective: https://www.ecmwf.int/en/about/media-centre/news/2024/summer-2024-newsletter-published
First the new #ocean and #seaice model, and second the new ocean and sea ice #reanalysis that uses it
Soil fractionation offers one way to try to tease out soil carbon dynamics beyond bulk. Using a linear-mixed effects model and large soil carbon database ( #ISRaD ) Heckman et al 2022 https://doi.org/10.1111/gcb.16023 found that depth was critical in explaining soil carbon stocks and persistence. Many traditional ClORPT variables were also explanatory, except for NPP, though their effects of different fractions differed. #SoilCarbon #DataCollection #Reanalysis #sciLit
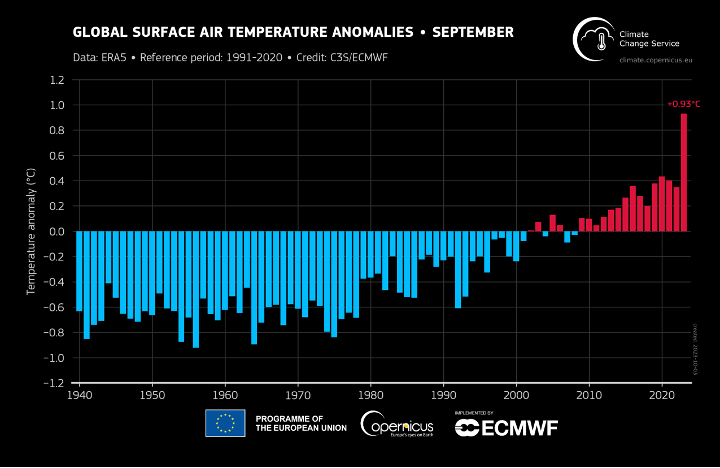
Unprecedented!
The anomaly for September 2023 is:
the largest warm anomaly
of any month
of any year
in the ERA dataset (back to 1940)
September 2023 was around 1.75ºC above the preindustrial average
More: https://climate.copernicus.eu/press-releases
#Climate #ClimateCrisis #CopernicusClimate #Reanalysis #OpenData #EarthObservation #ClimateAction
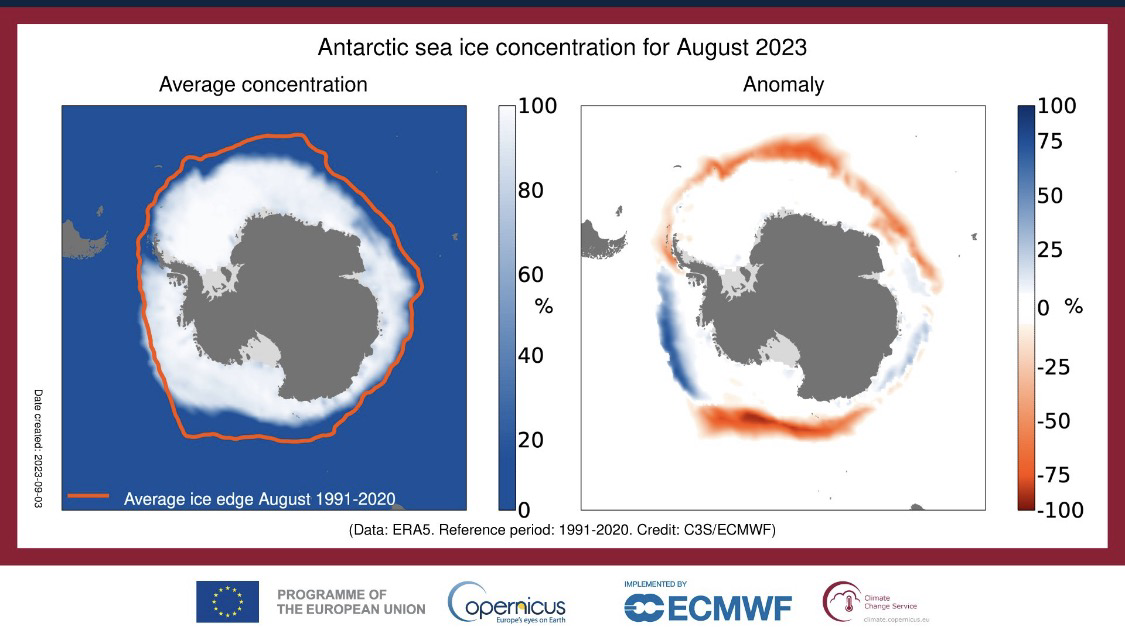
August #SeaIce highlights from #C3S:
❄️ #Antarctic sea ice saw the largest negative anomaly for August on record, at 12% below average;
❄️ #Arctic sea ice was 10% below average but well above the record minimum from August 2012.
#CopernicusClimate #Climate #seaice #Reanalysis #climatecrisis #Antarctic
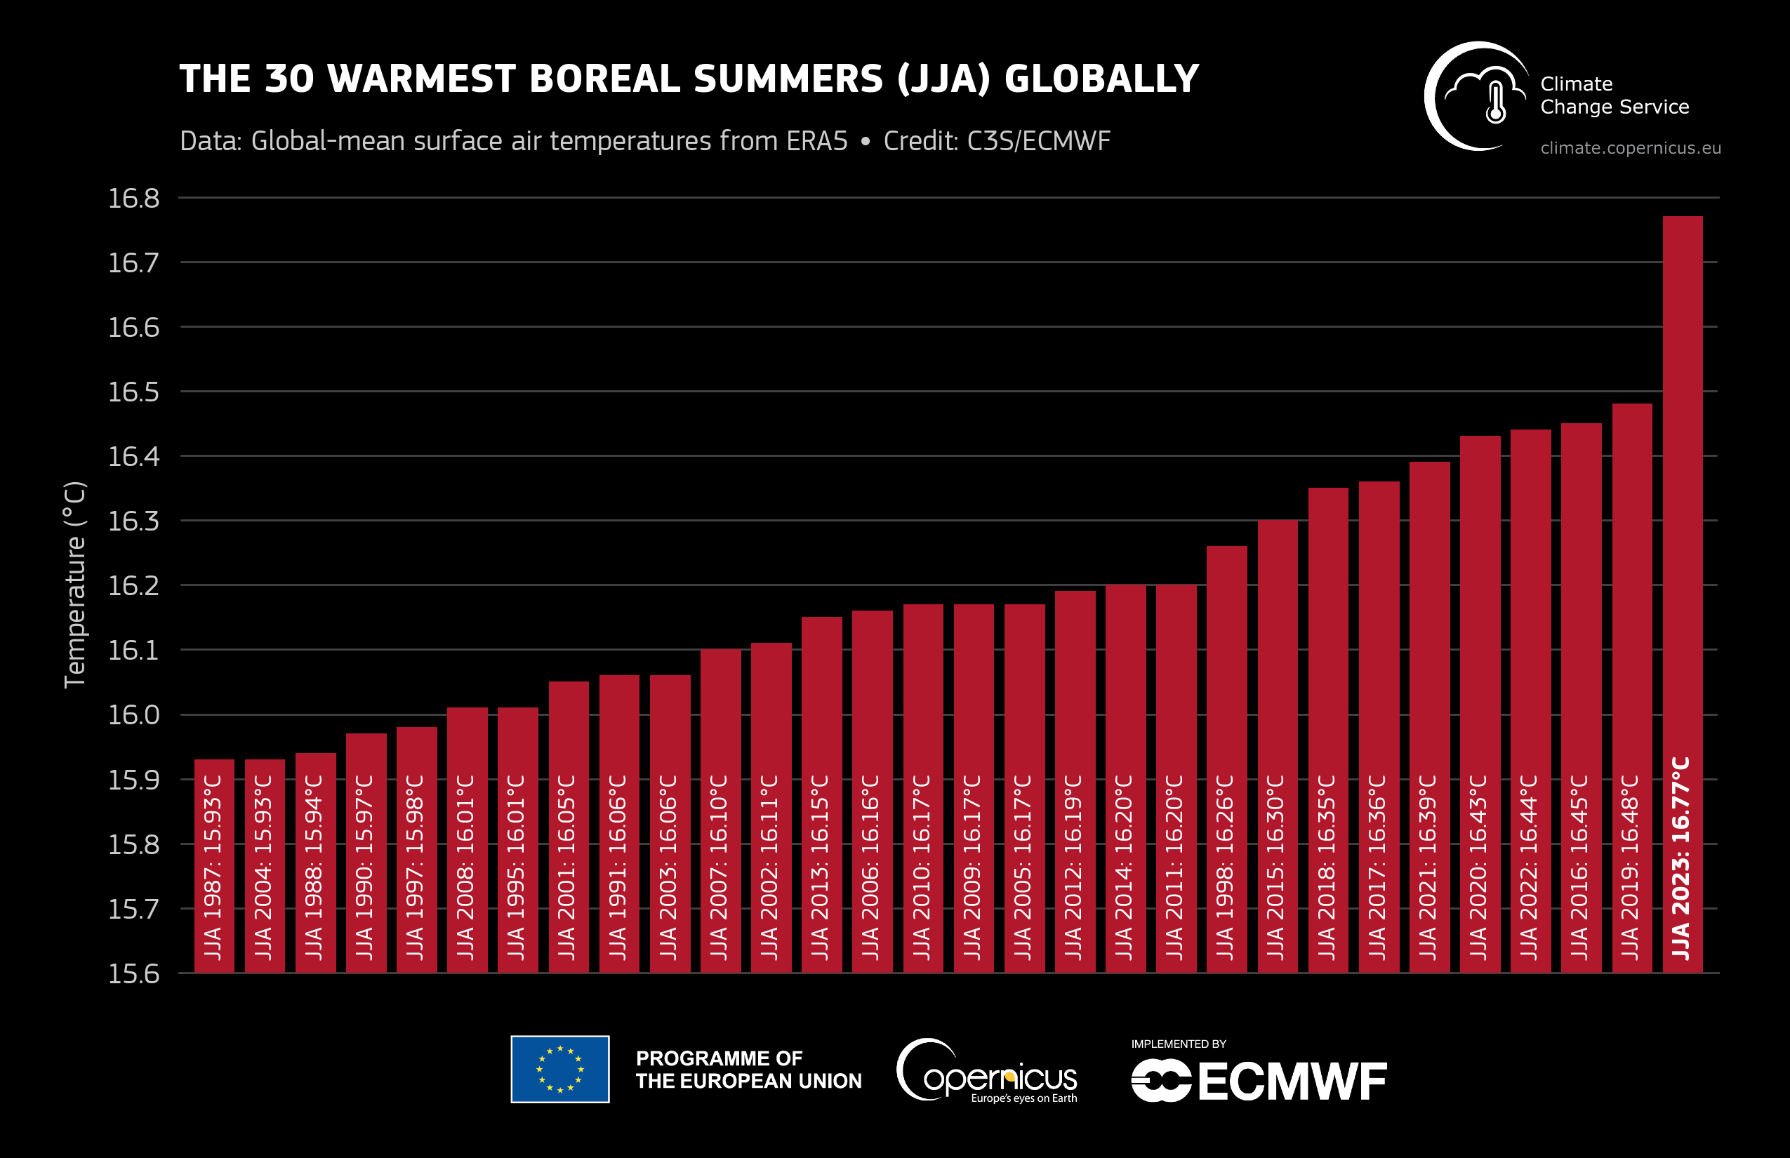
Summer 2023: the hottest June-July-August on record
The hottest month ever was July 2023, the second hottest month ever August 2023
New data from @CopernicusECMWF more here: https://climate.copernicus.eu/summer-2023-hottest-record
#Climate #ClimateCrisis #Reanalysis #ClimateAction #Extremeweather #CopernicusClimate
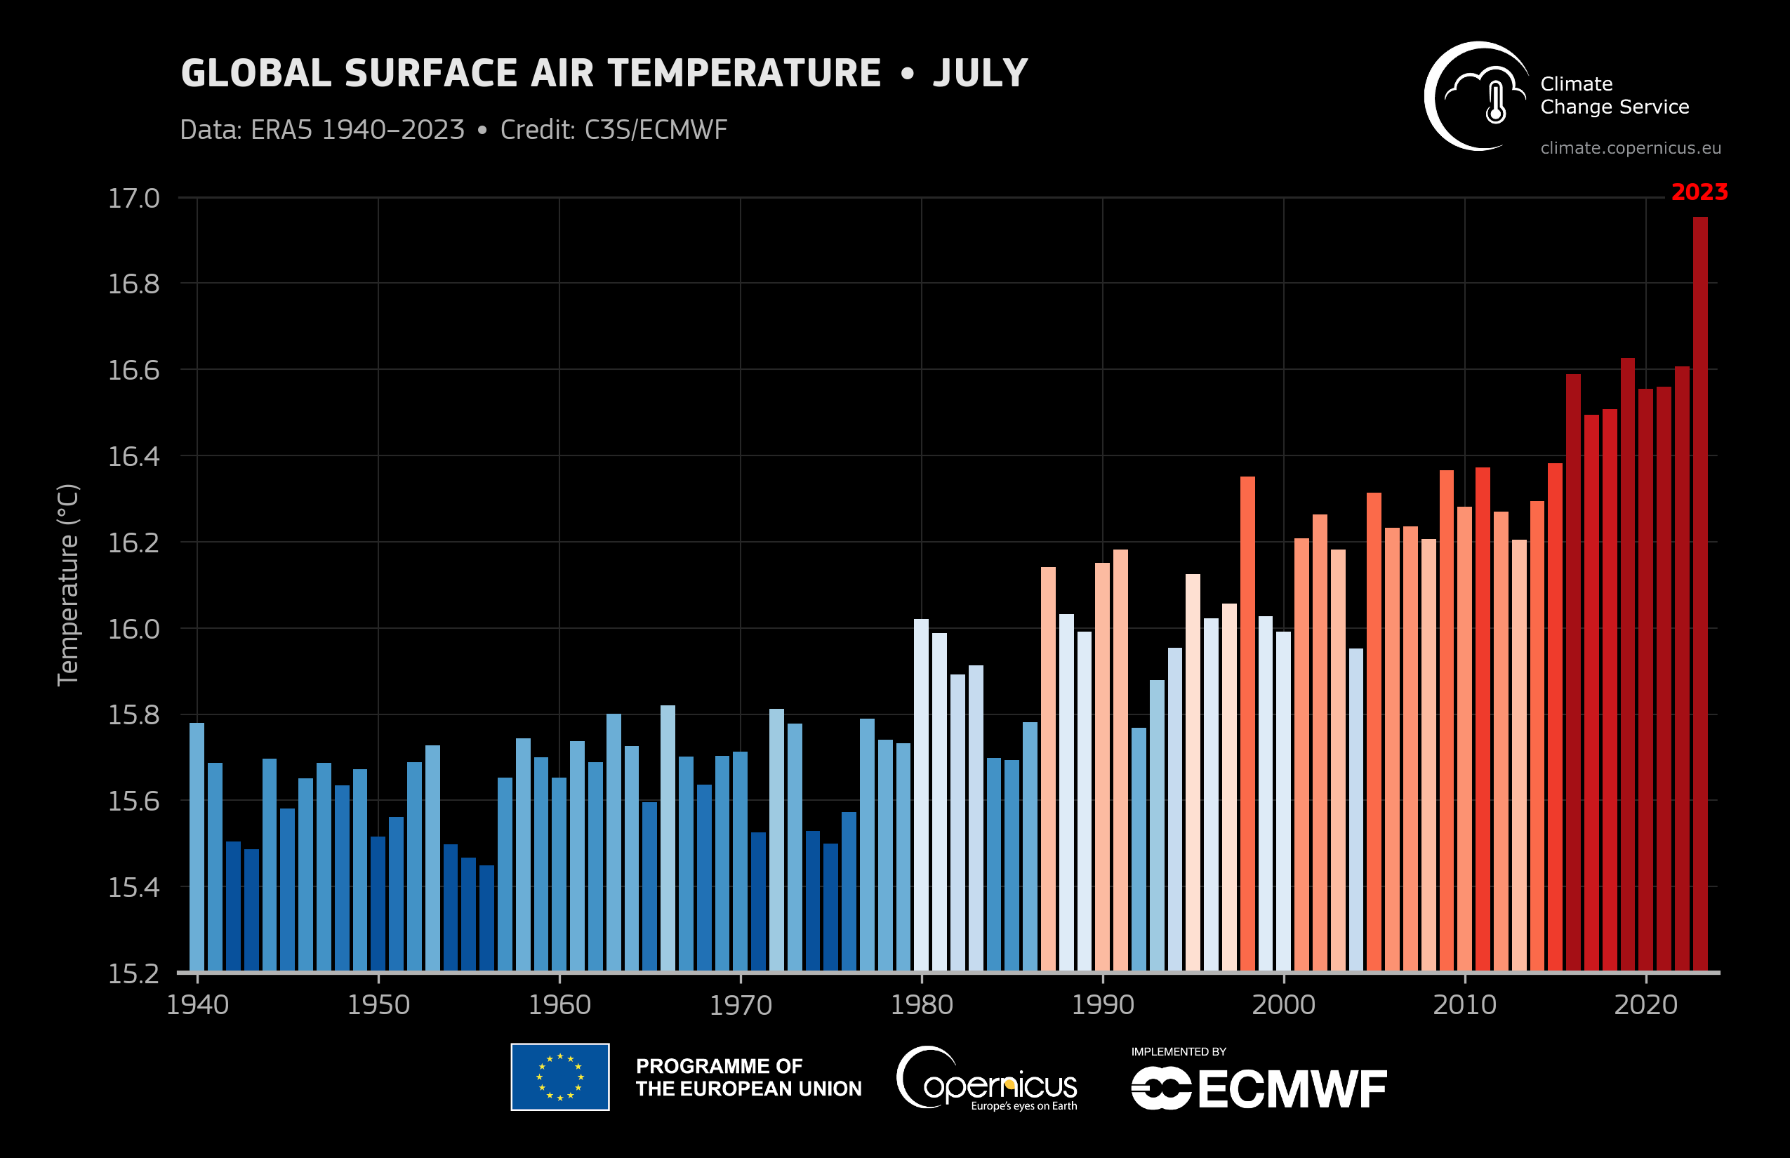
July 2023: Global air and ocean temperatures reach new record highs @CopernicusECMWF
More: https://climate.copernicus.eu/july-2023-global-air-and-ocean-temperatures-reach-new-record-highs
#Climate #ClimateCrisis #CopernicusClimate #OpenData #heatwave #EMCWF #Reanalysis
"These records have dire consequences for both people & the planet exposed to ever more frequent & intense extreme events”
#ClimateCrisis #ocean #ClimateAction #reanalysis #CopernicusClimate #OpenData #OpenSource #heatwave
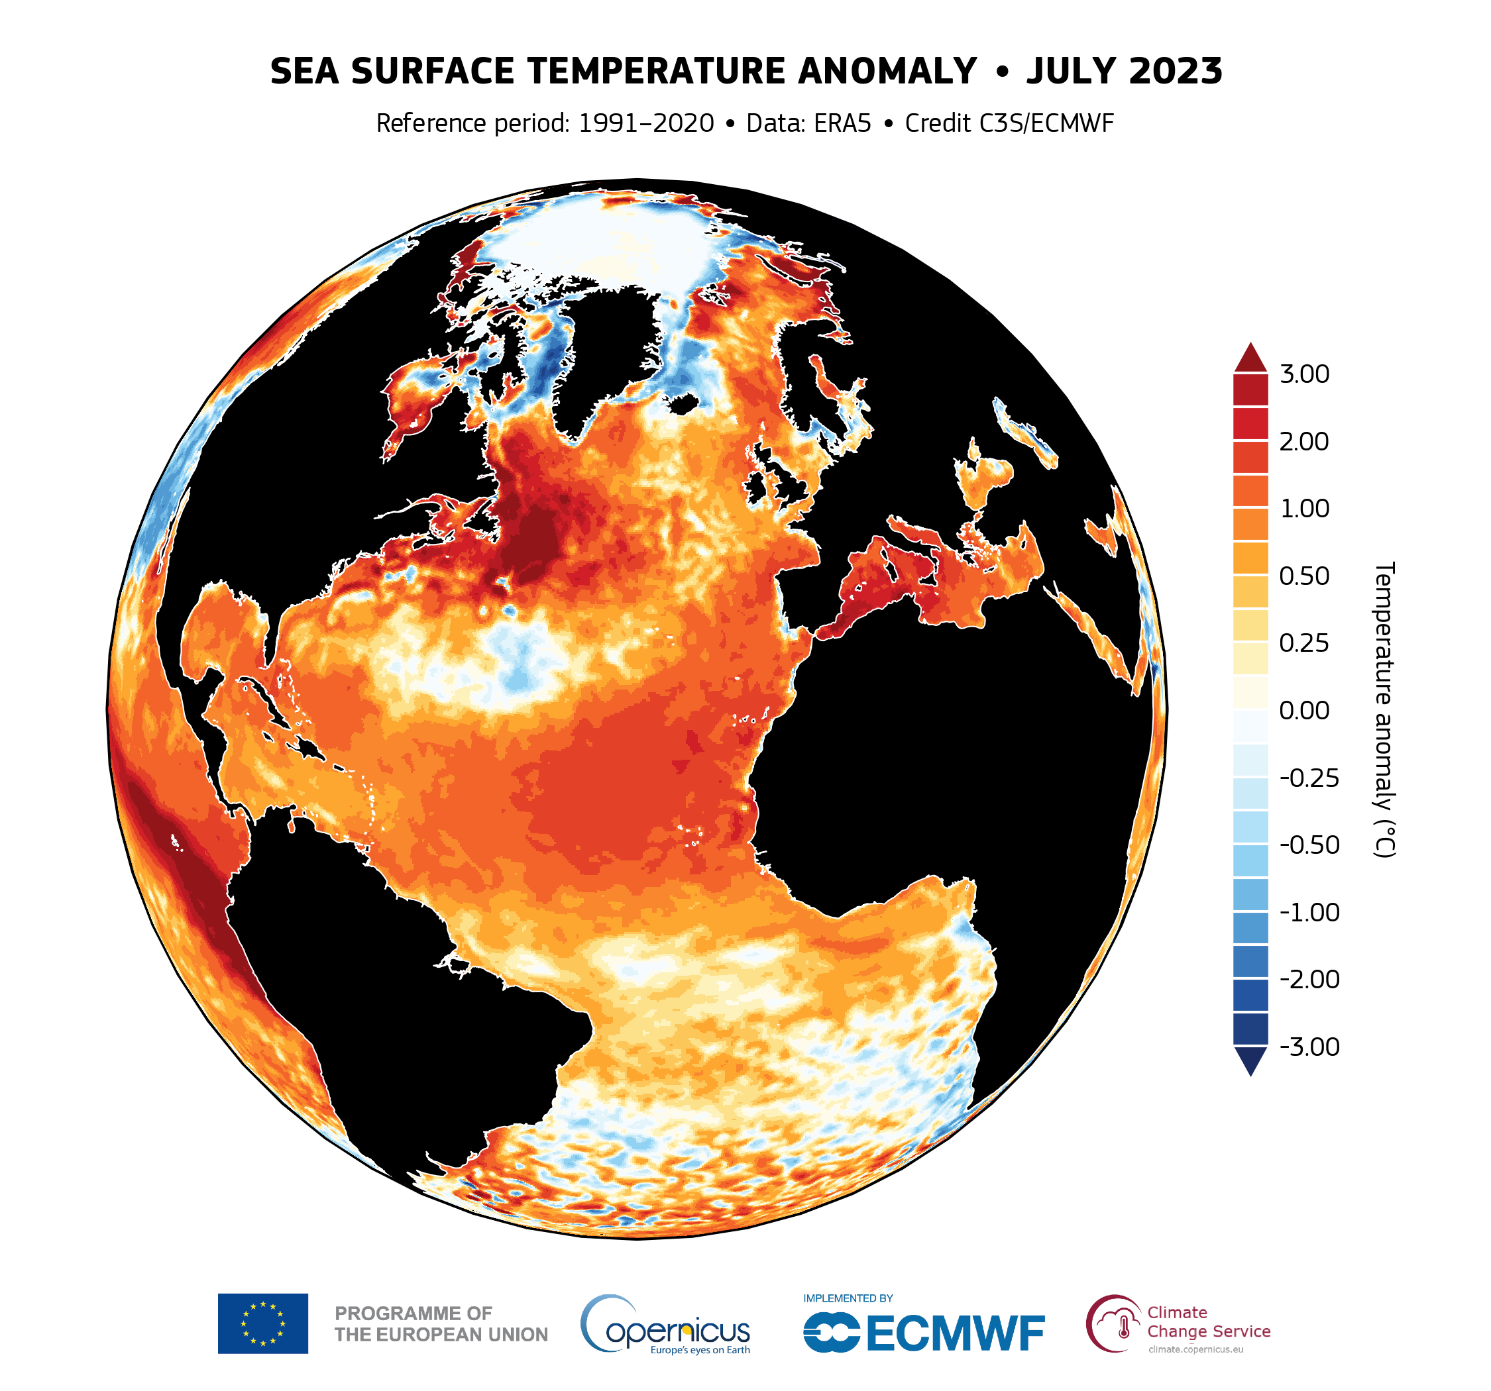
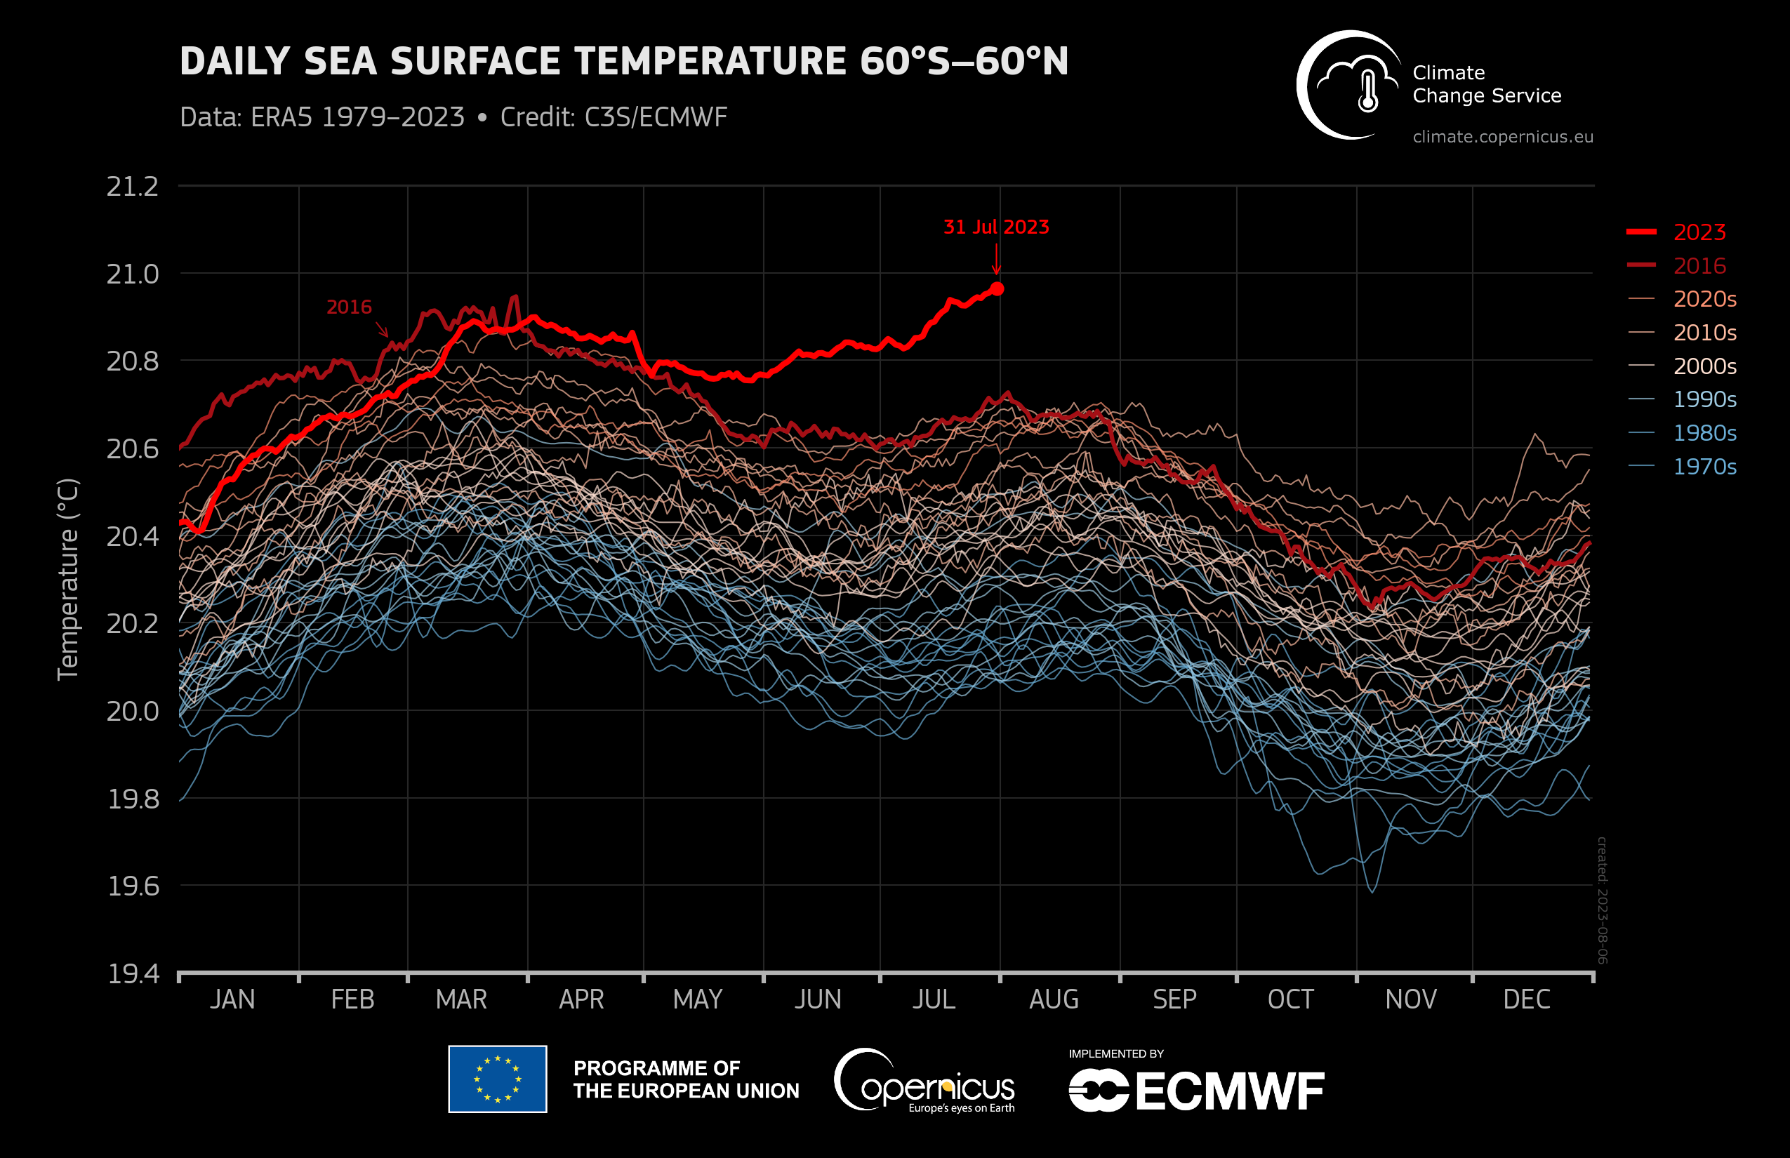
Our latest analysis on global (extrapolar) surface ocean temperature records in July 2023 @CopernicusECMWF
More: https://climate.copernicus.eu/global-sea-surface-temperature-reaches-record-high
#ClimateCrisis #ClimateAction #Reanalysis #CopernicusClimate #OpenData #Ocean #heatwave
As we have more heat waves we also suffer from more heat stress.
Heat stress is more than temperature and is a metric that describes how the environment impacts people (temperature, humidity, wind, soil etc.)
Last summer Europeans saw more heat stress than ever before.
Learn more here:
https://climate.copernicus.eu/esotc/2022/extreme-heat
#CopernicusClimate #ClimateCrisis #ClimateAction #Reanalysis #OpenData #ECMWF #extremes #heatwave #heatstress
*New Opportunity*
Interested in working at the cutting edge of #climate data with the #CopernicusClimate team?
Come work with us at @CopernicusECMWF and ECMWF in the reanalysis team building the next generation - ERA6
More: https://jobs.ecmwf.int/Job/JobDetail?JobId=73
#job #jobopportunity #new #opensource #OpenScience #ClimateCrisis #Reanalysis #EarthObservation #EOchat @LadiesOfLandsat
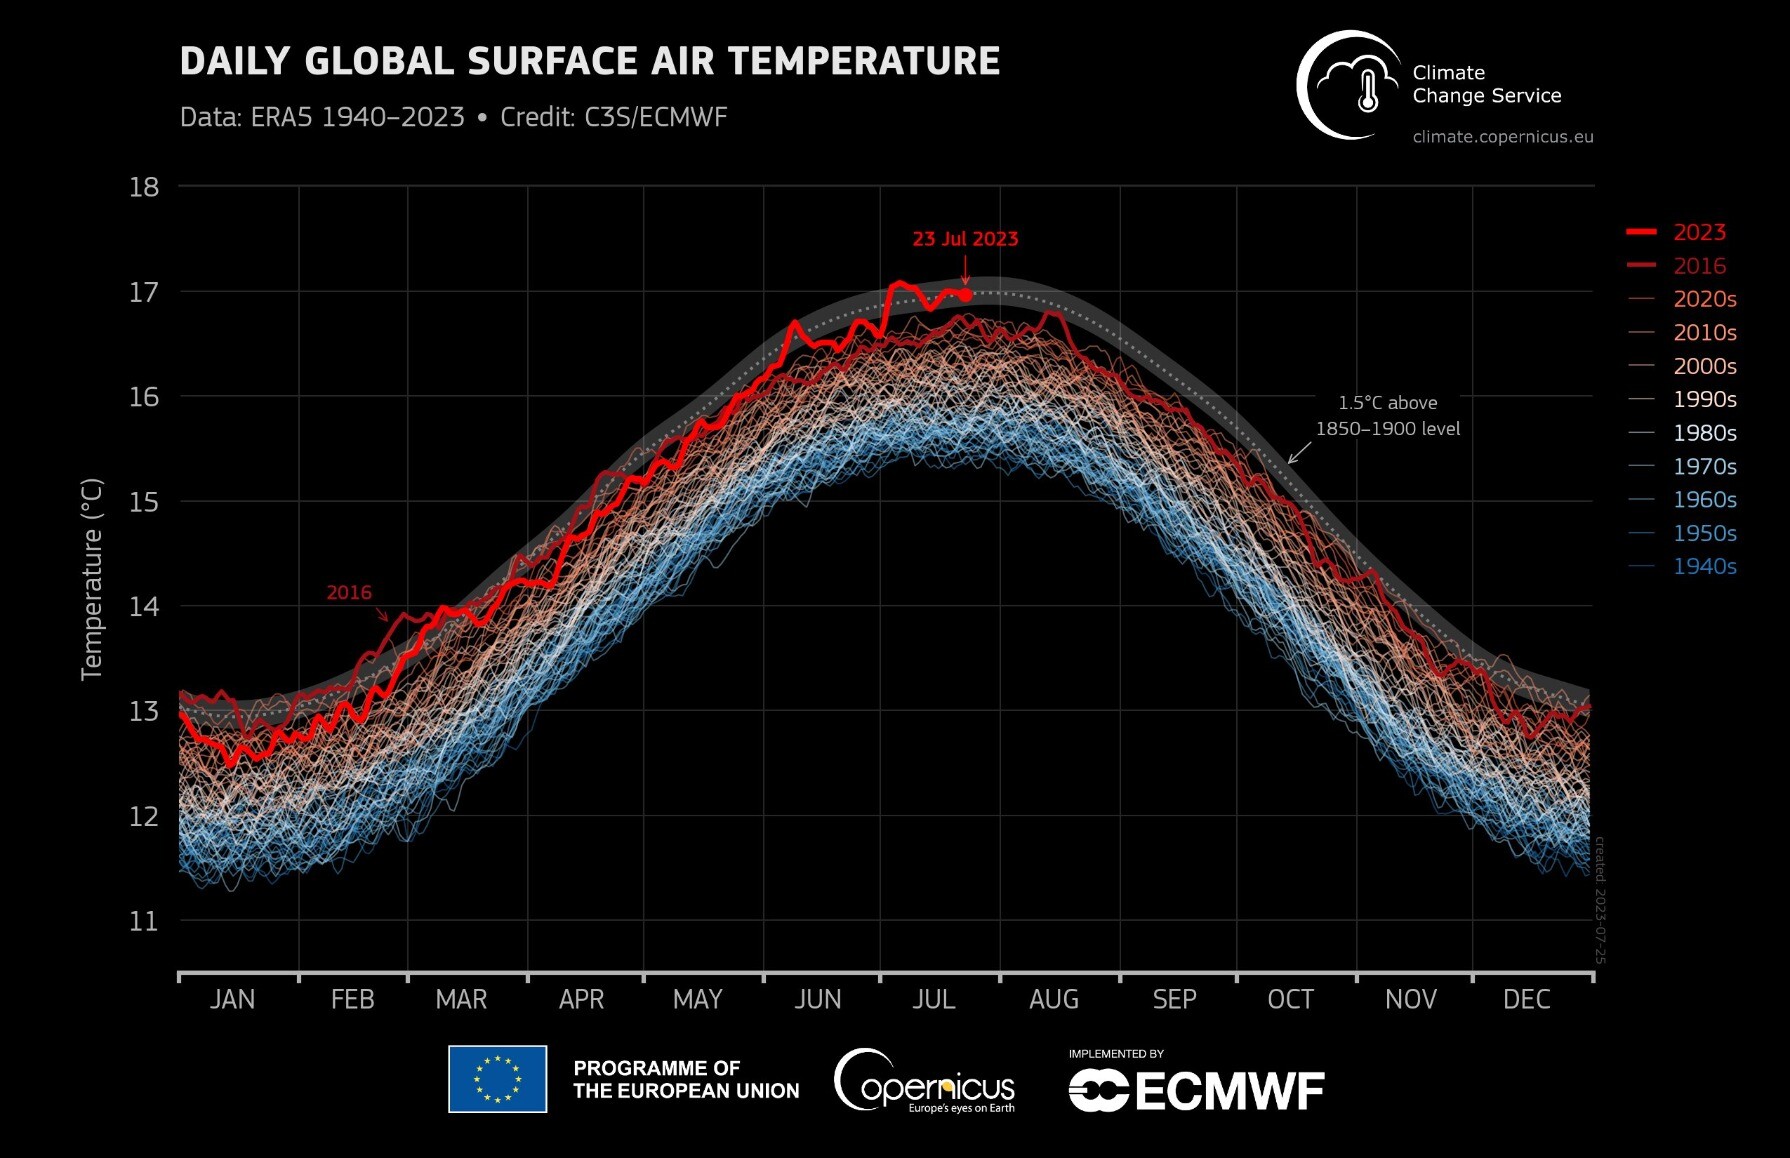
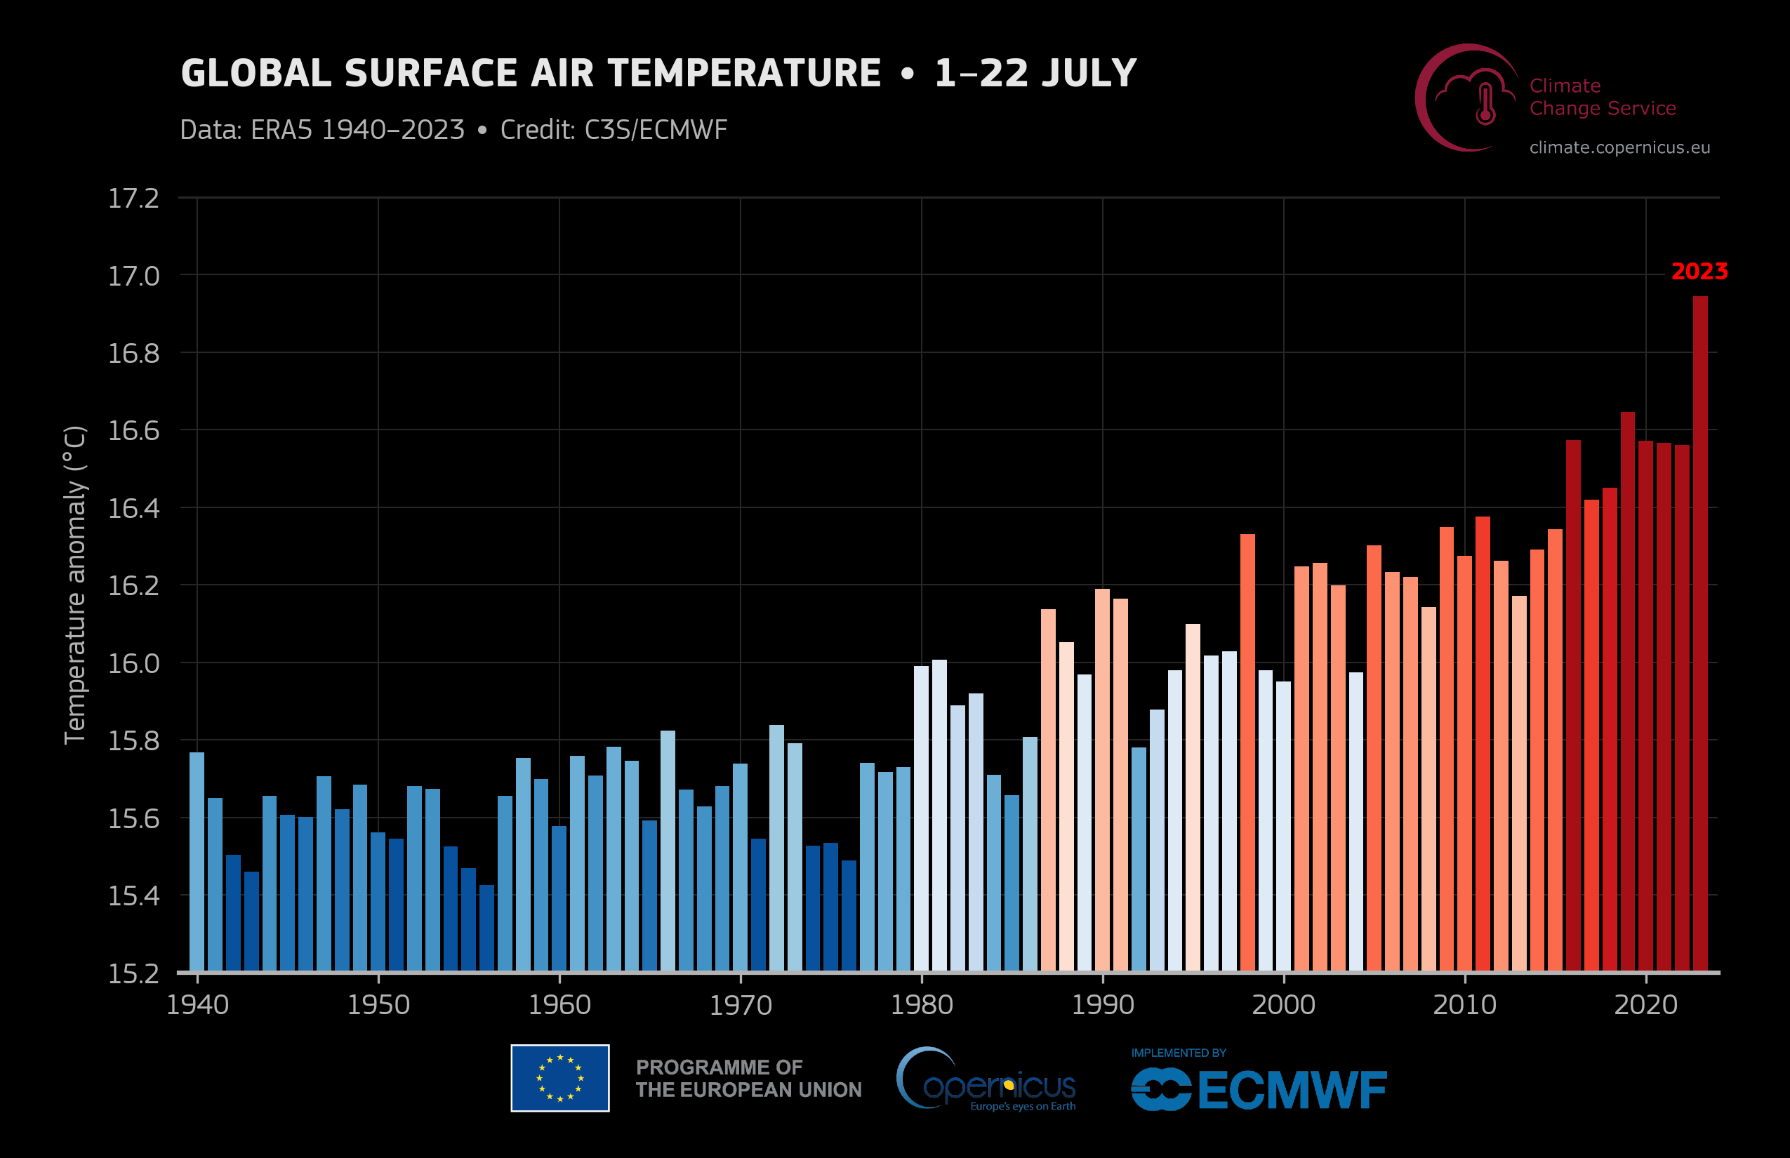
Data from the @copernicusecmwf the first 3 weeks of July have already broken several significant records, including:
Hottest day globally;
Hottest 3 weeks globally.
C3S data also show:
July 2023 likely to be hottest month on record.
More here: https://climate.copernicus.eu/july-2023-sees-multiple-global-temperature-records-broken
#ClimateCrisis #ClimateAction #OpenData #ERA5 #ECMWF #reanalysis #CopernicusClimate
🌡️📈 Europe has been experiencing some of the hottest temperatures of summer 2023 so far.
But what is influencing this #heatwave, what are its potential consequences, & is #ClimateChange affecting it?
Find out in our new article 👉
#climatecrisis #Climate #opendata #CopernicusClimate #ERA5 #heatwave #Reanalysis