#CMIP6

2025-06-11

Way back in 2022, as the world tried to readjust back to "normal" following COVID - I helped to co-organise a bootcamp with sponsorhop from the @wcrp_climate IASC, @esaclimate and a generous dollop of help from @PolarRES and @dmidk colleagues.
We gathered 10 senior scientist mentors and 22 students in an old torpedo research station (now used by Roskilde University) for 10 days. It was an extremely intense period but the 4th paper produced by this talented group has just come out.
I consider facilitating #EarlyCareerScientists to work on important science problems an extremely rewarding part of my job, and I'm looking forward to the next one already as part of our PISCO project.

In the mean time, go and read this extremely cool work, collecting together a huge number of radiosonde observations going back to the 1950s over the Arctic Ocean and using them to assess how well CMIP6 models represent lower atmosphere.

#CMIP6 #ClimateModels #Arctic #ArcticClimate #SeaIce

agupubs.onlinelibrary.wiley.co

2025-04-08

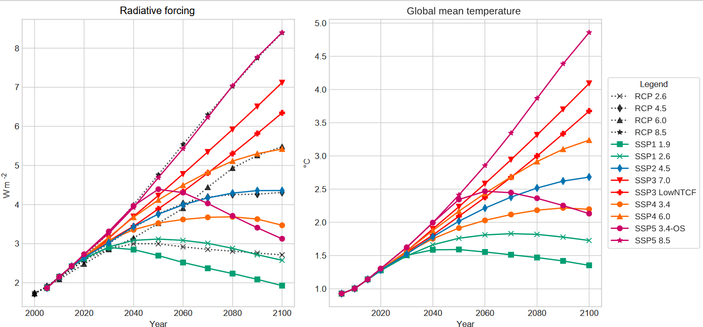
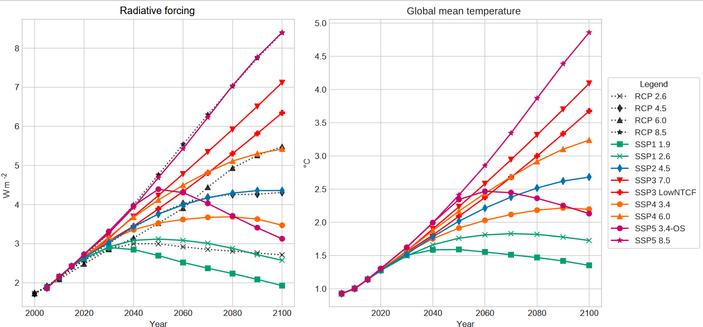
Looking up the old #CMIP6 emissions pathways for a thing - and while I wish I lived in SSP1, it feels a lot more like SSP3 or 5 right now.

Beats me why they call #Economics the Dismal Science...🫠

Full link to paper: gmd.copernicus.org/articles/12

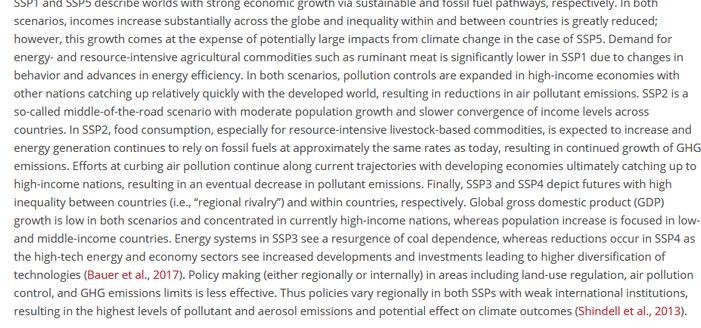
two graphs showing radiative forcing on the left side and global mean temperature on the right. Both have multiple colourful lines showing different trajectories but generally increasing from low on the left to high on the right, corresponding to different possible climate change futures.SSP1 and SSP5 describe worlds with strong economic growth via sustainable and fossil fuel pathways, respectively. In both scenarios, incomes increase substantially across the globe and inequality within and between countries is greatly reduced; however, this growth comes at the expense of potentially large impacts from climate change in the case of SSP5. Demand for energy- and resource-intensive agricultural commodities such as ruminant meat is significantly lower in SSP1 due to changes in behavior and advances in energy efficiency. In both scenarios, pollution controls are expanded in high-income economies with other nations catching up relatively quickly with the developed world, resulting in reductions in air pollutant emissions. SSP2 is a so-called middle-of-the-road scenario with moderate population growth and slower convergence of income levels across countries. In SSP2, food consumption, especially for resource-intensive livestock-based commodities, is expected to increase and energy generation continues to rely on fossil fuels at approximately the same rates as today, resulting in continued growth of GHG emissions. Efforts at curbing air pollution continue along current trajectories with developing economies ultimately catching up to high-income nations, resulting in an eventual decrease in pollutant emissions.

Looking up the old #CMIP6 emissions pathways for a thing - and while I wish I lived in SSP1, it feels a lot more like SSP3 or 5 right now. Beats me why they call #Economics the Dismal Science...🫠

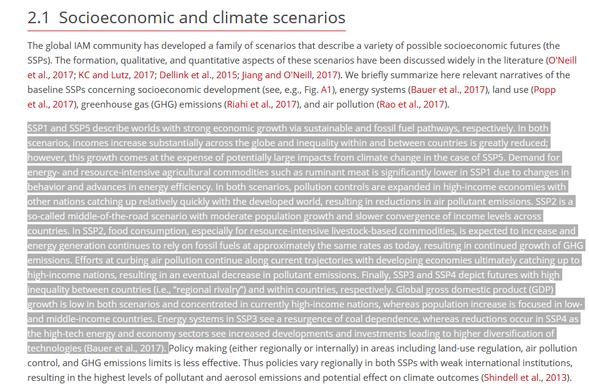
SSP1 and SSP5 describe worlds with strong economic growth via sustainable and fossil fuel pathways, respectively. In both scenarios, incomes increase substantially across the globe and inequality within and between countries is greatly reduced; however, this growth comes at the expense of potentially large impacts from climate change in the case of SSP5. Demand for energy- and resource-intensive agricultural commodities such as ruminant meat is significantly lower in SSP1 due to changes in behavior and advances in energy efficiency. In both scenarios, pollution controls are expanded in high-income economies with other nations catching up relatively quickly with the developed world, resulting in reductions in air pollutant emissions. SSP2 is a so-called middle-of-the-road scenario with moderate population growth and slower convergence of income levels across countries. In SSP2, food consumption, especially for resource-intensive livestock-based commodities, is expected to increase and energy generation continues to rely on fossil fuels at approximately the same rates as today, resulting in continued growth of GHG emissions. Efforts at curbing air pollution continue along current trajectories with developing economies ultimately catching up to high-income nations, resulting in an eventual decrease in pollutant emissions. Finally, SSP3 and SSP4 depict futures with high inequality between countries (i.e., “regional rivalry”) and within countries, respectively. Global gross domesttwo graphs showing radiative forcing on the left side and global mean temperature on the right. Both have multiple colourful lines showing different trajectories but generally increasing from low on the left to high on the right, corresponding to different possible climate change futures.

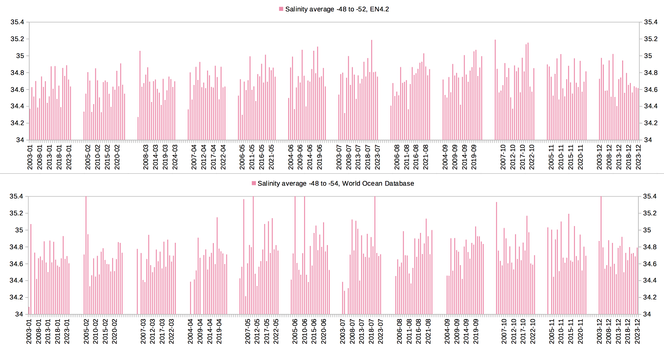
The promised plots.
I'll show data since 2003 only because only then did real measurements really kick off. Before that, measurements were so spotty with 1 in January in one year, then 3 years nothing, then 5 measurements in for example August and so on.
Data source for measurements is #NOAA ncei.noaa.gov/access/world-oce

The other plot is from a #ReAnalysis called EN4.2 metoffice.gov.uk/hadobs/en4/do
It is based on the same NOAA data, and goes back to 1900. EN4.2 has better quality assurance than my download. And EN4.2 is able to calculate the likely values in adjacent coordinates and adjacent months.

Among other Reanalyses, EN4.2 has also been used in the newest preprint by the Dutch team around #vanWesten. It sees AMOC tip in 2065 in RCP8.5 and in 2085 in RCP4.5. But it is based on biased Reanalyses and known-to-be too stable #CMIP6: arxiv.org/pdf/2407.19909

Whereas the first new preprint by van Westen's team, which tips AMOC 2037-2064, uses only real measurements of the 3 dedicated monitoring arrays in the North, tropical and South #Atlantic. arxiv.org/pdf/2406.11738
Here, the caveat is: very short data series.

With measurements being so spotty, I only show monthly salinity 2003ff in down to 10m depth. And only from the area in the South Atlantic. Averaged on a 2 by 2 degree grid from Argentina's coast to longitude -48, and latitudes 40-48 South.

Sorry, not sorry: neither dataset shows a smoking gun. 😁
#FridaysForFuture #ChartsForFuture

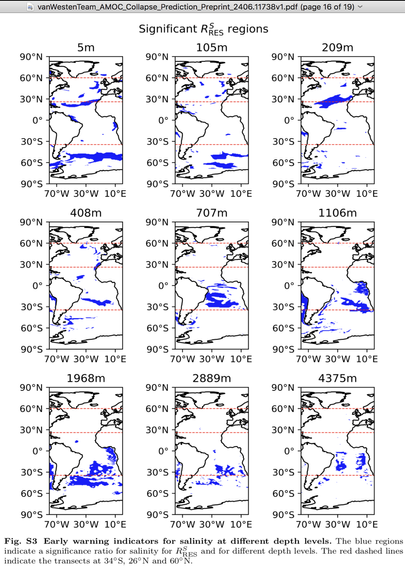
Figure 3 in a) 
Caption: "Early warning indicators for salinity at different depth levels. The blue regions indicate a significance ratio for salinity and for different depth levels."

It shows 9 maps of the Atlantic for depth levels from 5m to 4375m. Each map has some highlighted areas in blue where salinity in their analysis was significantly altered just before AMOC tipps. 
5m depth shows significance at 30 degrees North all across the Atlantic, and at 40 to 48 degrees South.2 bar charts with salinity in the South Atlantic at down to 10m depth. 
Top chart is ReAnalysis EN4.2, bottom chart Word Ocean Database hosted on NOAA's website. 

EN4.2 shows a strong rise in the months August and September. August shows no variability at all. All other months do not show a rise. But rather large variability year on year. Except for December where variability has ceased in 2017. 

The other chart shows a few gaps where a month had no measurement at all. 
Strong variability, in parts going beyond the chart range (my lack of quality assurance). Variability ceased in 2017 for September and December.  
A rise is visible in March, June, August, September. 

July sees a continuous drop in variability since 2006.

"
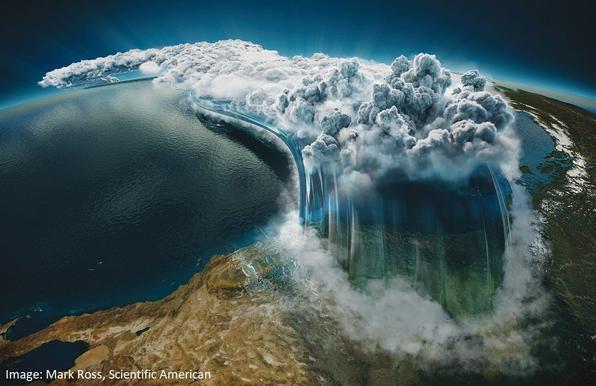
Verschiebung von Wolken vom Tag zur Nacht verstärkt die globale Erwärmung

In einem wärmer werdenden Klima verändern sich die Wolkenmuster so, dass sie die globale Erwärmung noch verstärken. Eine Pressemitteilung der Universität Leipzig.
"
raumfahrer.net/verschiebung-vo

20.6.2024

#Albedo #CMIP6 #Erderwärmung #Klima #Klimakrise #Klimamodellierung #Klimawandel #Leipzig #Raumfahrt #Satellitendaten #Treibhausgas #Wetter #Wolken

Elio Campitellieliocamp
2024-05-06

YES! Found the issue. The pipeline was processing models and it turned out I had downloaded multiple versions of the same model. Filtering to keep only one version solved the issue!

I hate CMIP6.

Elio Campitellieliocamp
2024-04-02

My rant of the day is that using data is a PITA and I absolutely hate it.

2024-03-04

Cool new @nature paper just dropped colleagues at #DMI suggesting #CMIP6 models may have #Arctic warming about right, when compared to @osi_saf #Satellite data rather than #ERA5

"We find that the CMIP6 simulations in the central Arctic, with generally thicker ice and snow, align well with satellite observations ... By contrast, climate reanalyses like ERA5 exhibit widespread warm biases exceeding 2 °C in the same region."

nature.com/articles/s43247-024

2024-02-02
Elio Campitellieliocamp
2024-02-01

🧵
Ok, today's project is to improve the system I use in rcmip6 to download models:

The package searches for CMIP6 models and returns a data.frame with one instance per row. Then it goes through each row downloading the files associated with each instance. This involves downloading the information of the files, checking if they exist if, the checksum matches and downloading if necessary.

Doing this sequentially is slow: so how to parallelise it?

1/n

MPI für MeteorologieMPI_Meteo@wisskomm.social
2024-01-16

Announcing the new MPI Grand Ensemble! In a multinational collaboration, Dirk Olonscheck and other #MPIScientists produced 30 realisations of the historical climate and 5 of the #CMIP6 emissions scenarios.

With high-frequency output and comparability to higher resolution simulations, this data is specifically suited to investigate regional climate extremes.

It's also valuable for assessing climate pledges and not to mention how it can train AI! Read more here tinyurl.com/bde6aahz

Schematic showing the difference between the surface temperature from GSAT observations and MPI-GE CMIP6 models and the projected difference upto the year 2100.
💧🌏 Greg CocksGregCocks@techhub.social
2023-12-12

[The] New High-Resolution Climate Models Are A Breakthrough In Understanding Australia's Future
--
theconversation.com/our-new-hi <-- shared technical article
--
doi.org/10.1029/2023EF003548 <-- shared paper
--
“KEY POINTS
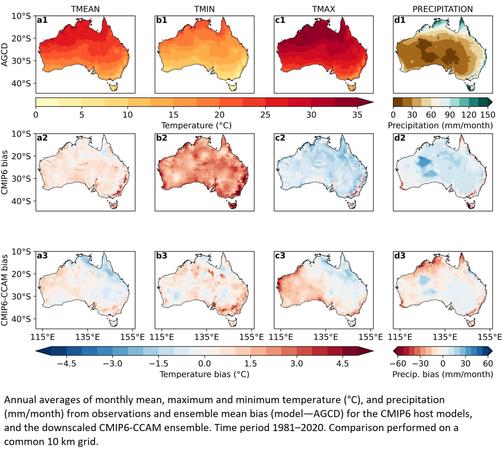
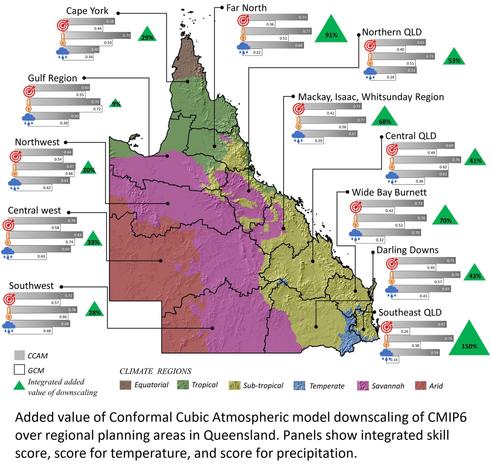
• [They] dynamically downscaled 15 CMIP6 global climate model simulations over Australia to a 10 km spatial resolution using the Conformal Cubic Atmospheric model
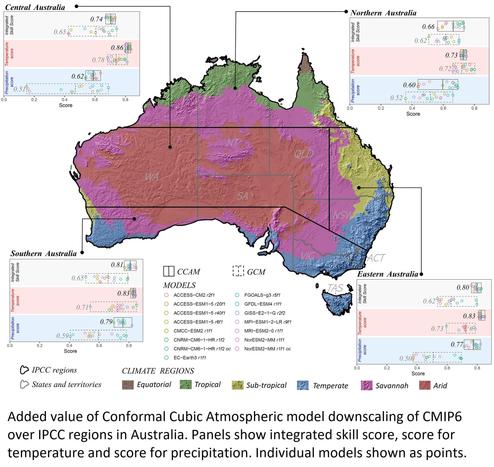
• Two new assessment metrics are proposed to assess model performance and added value of downscaling
• The integrated added value of downscaling can be as high as 150% over highly populated areas..."
#GIS #spatial #mapping #modeling #Australia #climatechange #extremeweather #wildfires #flooding #floods #coast #coastal #stormdamage #risk #hazard #heatwaves #bushfires #precipitation #heat #temperature #humanimpacts #climatemodel #CMIP6 #CCAM #globalclimatemodel #GCM #climatecrisis #climateadaptation #climaterisk #climatescience #spatialanalysis #spatiotemporal

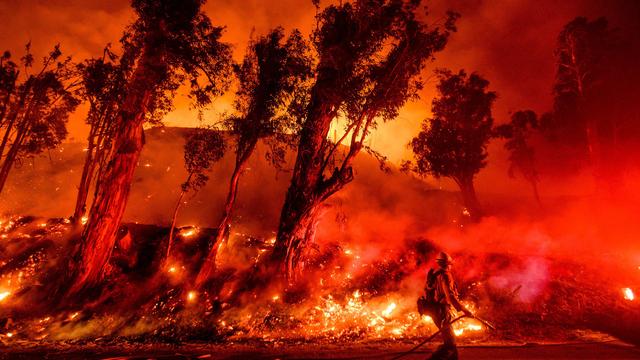
photo - bushfire - Australiamaps / spatial analyses - Australia - Annual averages of monthly mean, maximum and minimum temperature (°C), and precipitation (mm/month) from observations and ensemble mean bias (model—AGCD) for the CMIP6 host models, and the downscaled CMIP6-CCAM ensemble. Time period 1981–2020. Comparison performed on a common 10 km grid.map / spatial analysis - Australia - Added value of Conformal Cubic Atmospheric model downscaling of CMIP6 over IPCC regions in Australia. Panels show integrated skill score, score for temperature and score for precipitation. Individual models shown as points.map / spatial analysis / charts - Australia - Added value of Conformal Cubic Atmospheric model downscaling of CMIP6 over regional planning areas in Queensland. Panels show integrated skill score, score for temperature, and score for precipitation.
Julius Buseckejbusecke@hachyderm.io
2023-11-30

If anyone is interested in the machinery behind the NSF-LEAP supported #CMIP6 ingestion to Anlysis-Ready Cloud-Optimized zarr stores, check out the recording of this Pangeo Showcase Talk I gave yesterday!

discourse.pangeo.io/t/pangeo-s

Julius Buseckejbusecke@hachyderm.io
2023-11-30

Paper Alert 🚨

bg.copernicus.org/articles/20/

More #CMIP6 #Oxygen science, this time in the Indian Ocean out in Biogeosciences (#openaccess)

The #OMZ in the Indian Ocean contracts at the lowest oxygen levels but expands in the outer levels. But the unique circulation of the Indian makes this even more interesting 🤩

Super excited to see this work published! Amazing work Sam!

Dr. Robert RohdeRARohde@fediscience.org
2023-10-11

Given the highly unlikely nature of this abrupt record, it suggests that models may not be fully representing recent climate changes.

This could be due to recent reductions in man-made aerosol emissions, the 2022 Hunga Tonga volcano eruption, or other factors.

#ClimateChange #GlobalWarming #CMIP6 #HungaTonga

4/

Dr. Robert RohdeRARohde@fediscience.org
2023-10-11

September breaking the monthly global temperature record by 0.50 °C (0.90 °F) is unprecedented and highly unlikely.

An examination of CMIP6 climate models used to simulate global warming would lead us to estimate the chance of this occurring at ~1 in 10,000.

#ClimateChange #GlobalWarming #CMIP6 #Climate #Weather

3/

2023-10-02

My attention is drawn by my ace @PolarRES collaborators to this new article by Karpechko et al. on the #PolarVortex in the #Arctic in the #CMIP6 models. It's quite fascinating..

Model uncertainty contributes half of total uncertainty in projected strength of the Northern winter stratospheric polar vortex + is linked to uncertainty in projected regional surface temperature and precipitation. Models project an eastward shift of Northern winter stratospheric polar vortex

agupubs.onlinelibrary.wiley.co

2023-07-24

We ended our first week with Climate Modeling and now this knowledge will be the foundation to explore future projections of Earth’s climate by analyzing Earth System Models from the most recent Coupled Model Intercomparison Project #CMIP6. Our first talk by Helene Hewitt, CMIP panel chair, will introduce several topics, such as the latest IPCC report, paleoclimate, and future climate projections.
In the tutorials you’ll be guided by Brodie Pearson, with contributions from Julius Busecke @jbusecke and Tom Nicholas. You'll learn how to utilize CMIP6 models to analyze data to evaluate future climate change and possible socioeconomics scenarios, and how to integrate CIMP6 projections with data from observation.
#climatematch #climate

First Slide of 
"CMIP Future Projections of Climate " by Helene HewittIPCC Physical Basis course cover - with a picture of  Brodie Pearson
2023-07-21

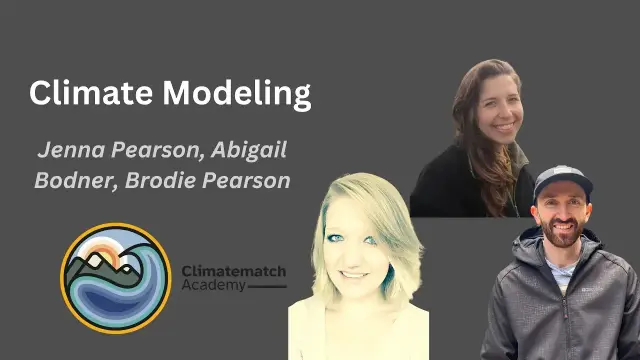
As our first week comes to an end, we want to express our gratitude to Prof Brian Rose for his introductory presentation on Climate Models, as well as to our speakers, Jenna Pearson, Abigail Bodner, and Brodie Pearson, who have prepared a series of tutorials to lead you from fundamental climate models, with just a few variable, to more Earth System Models based on #CESM2 from the recent Coupled Model Intercomparison Project #CMIP6

#climatematch #climate #modeling #EarthSystems

Climatematch Clinate Modeling
Jenna Pearson, Abigail Bodner, Brodie Pearson

Client Info

Server: https://mastodon.social
Version: 2025.04
Repository: https://github.com/cyevgeniy/lmst