#SeaSurface temperature record in the southwestern #Pacific: Coral colony from Fiji reveals warmest temperatures in over 600 years // #SeaSurfaceTemperatures #ecology #corals #paleoclimatology #ClimateResearch #PacificOcean @ScienceAdvances @uni_mainz_eng
https://nachrichten.idw-online.de/2024/09/18/sea-surface-temperature-record-in-the-southwestern-pacific-coral-colony-reveals-warmest-temperatures-in-over-600-years
#seasurface
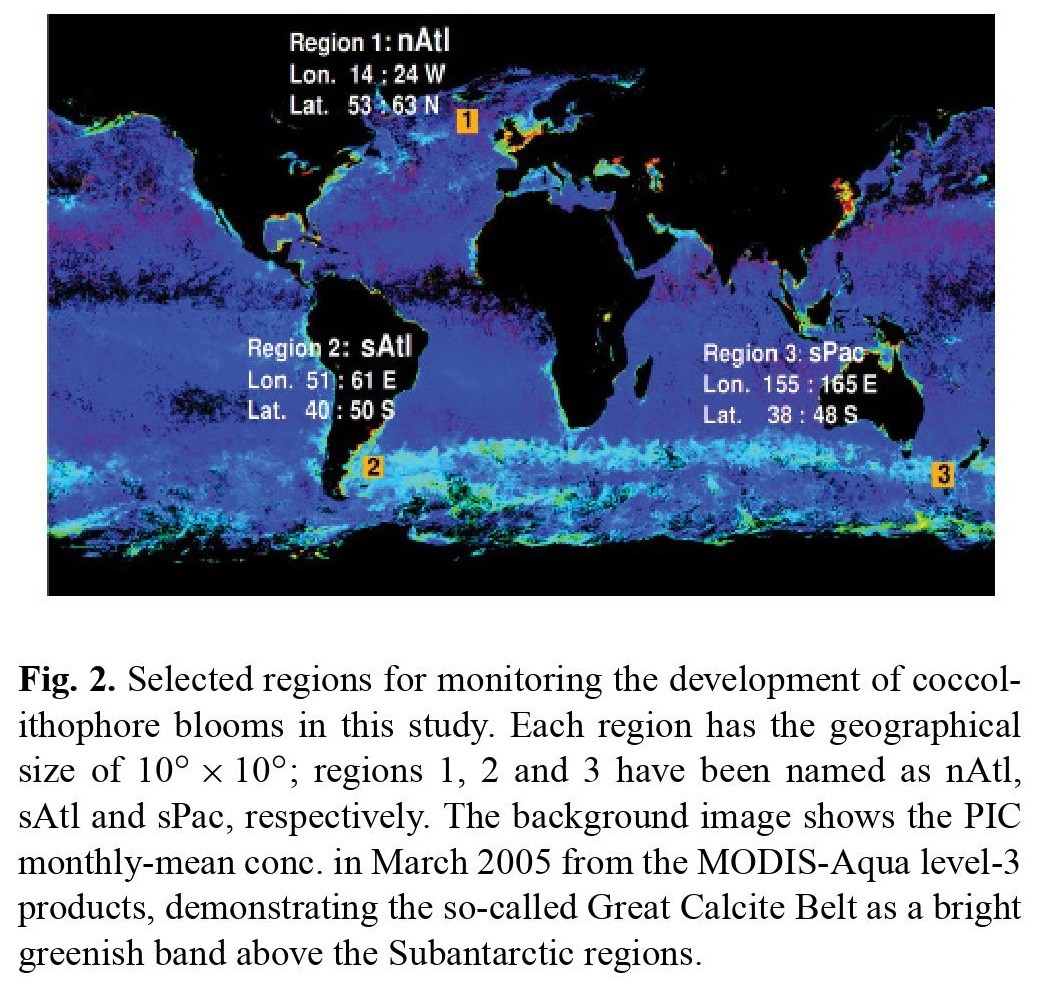
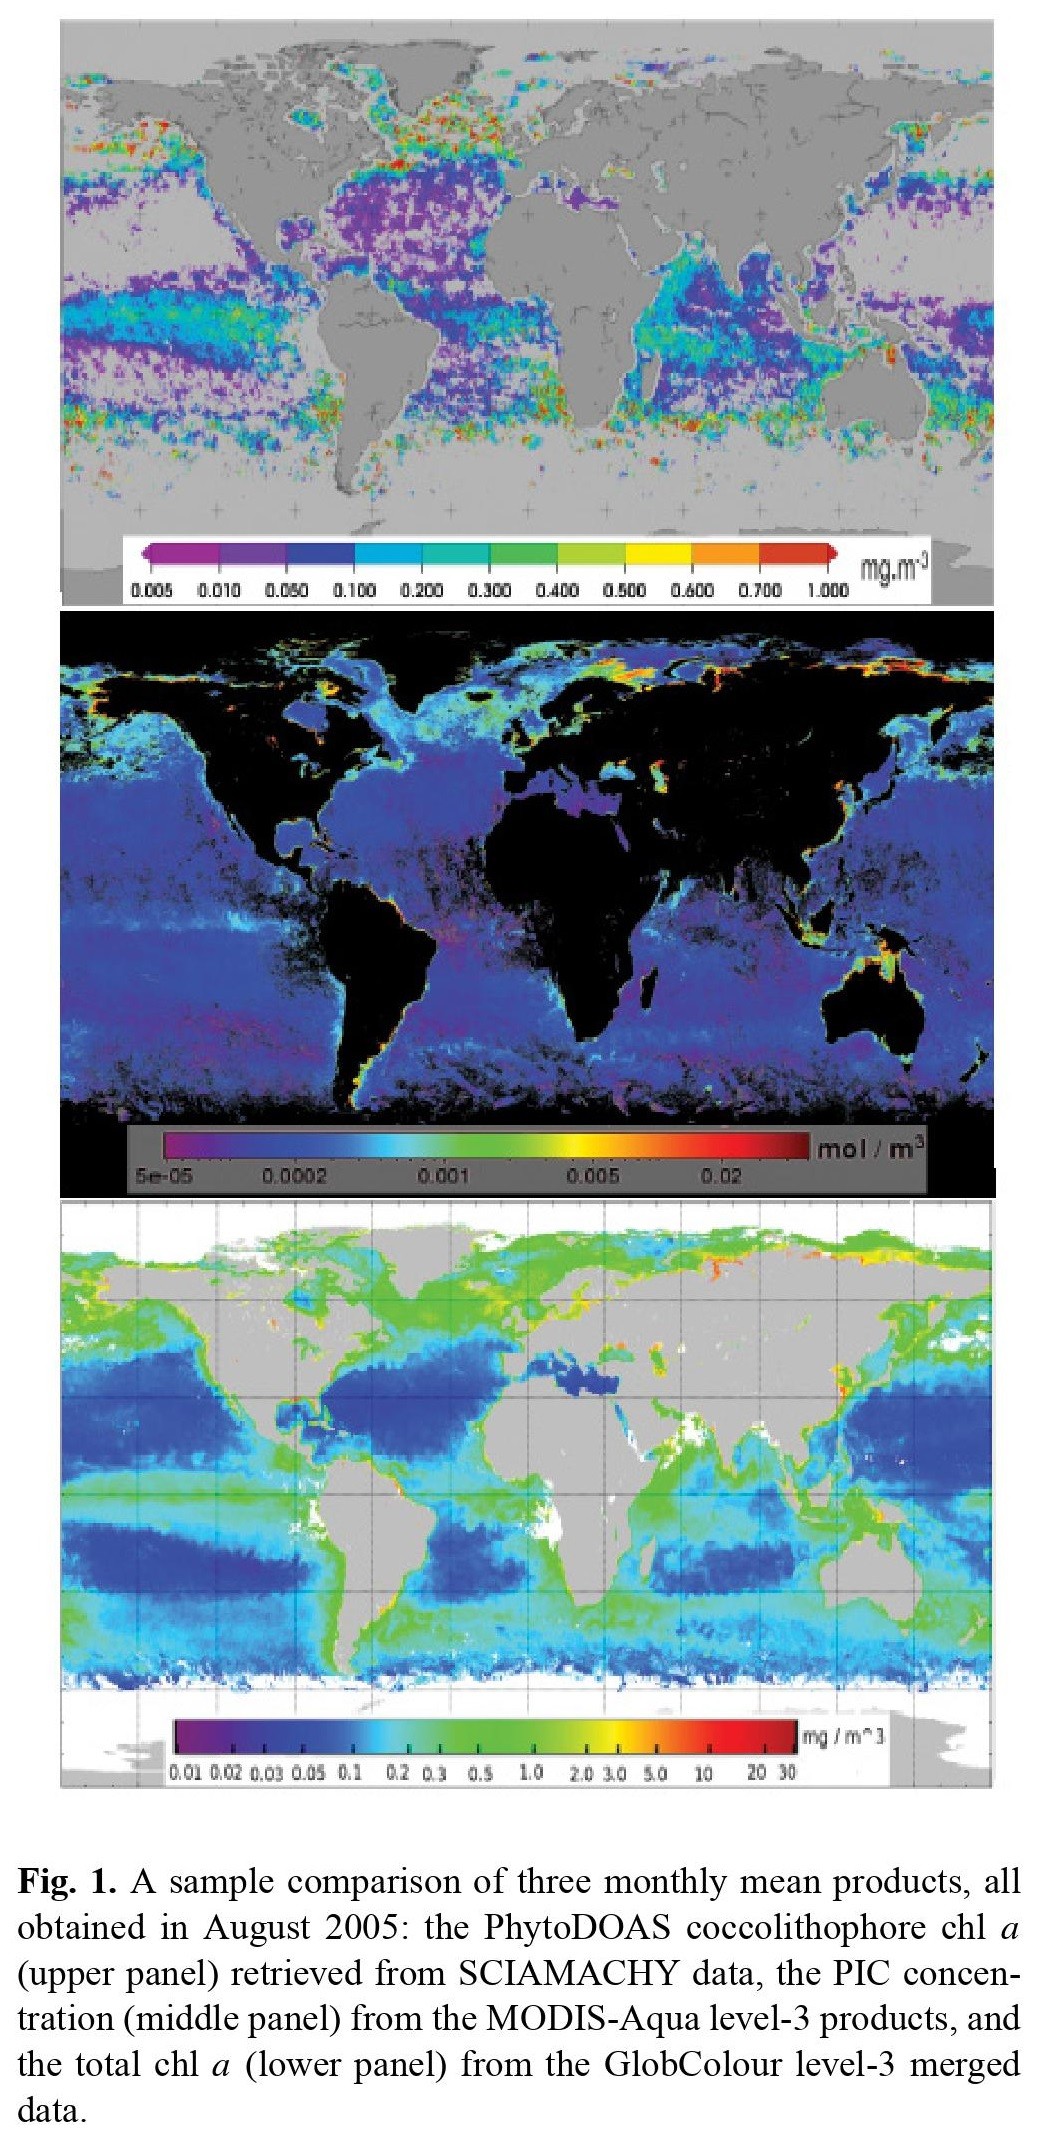
Remote Sensing Of Coccolithophore Blooms In Selected Oceanic Regions Using The Phytodoas Method Applied To Hyper-Spectral Satellite Data
-- https://doi.org/10.5194/bg-9-2127-2012 <-- shared paper
--
#GIS #spatial #mapping #marine #ocean #remotesensing #earthobservation #coccolithophore #bloom #satellite #SCIAMACHY #hyperspectral #ENVISAT #PhytoDOAS #GlobColour #phytoplankton #plankton #geophysics #seasurface #temperature #mixedlayerdepth #windspeed #modeling #corrleation #biomass #spatialanalysis #spatiotemporal #timeseries
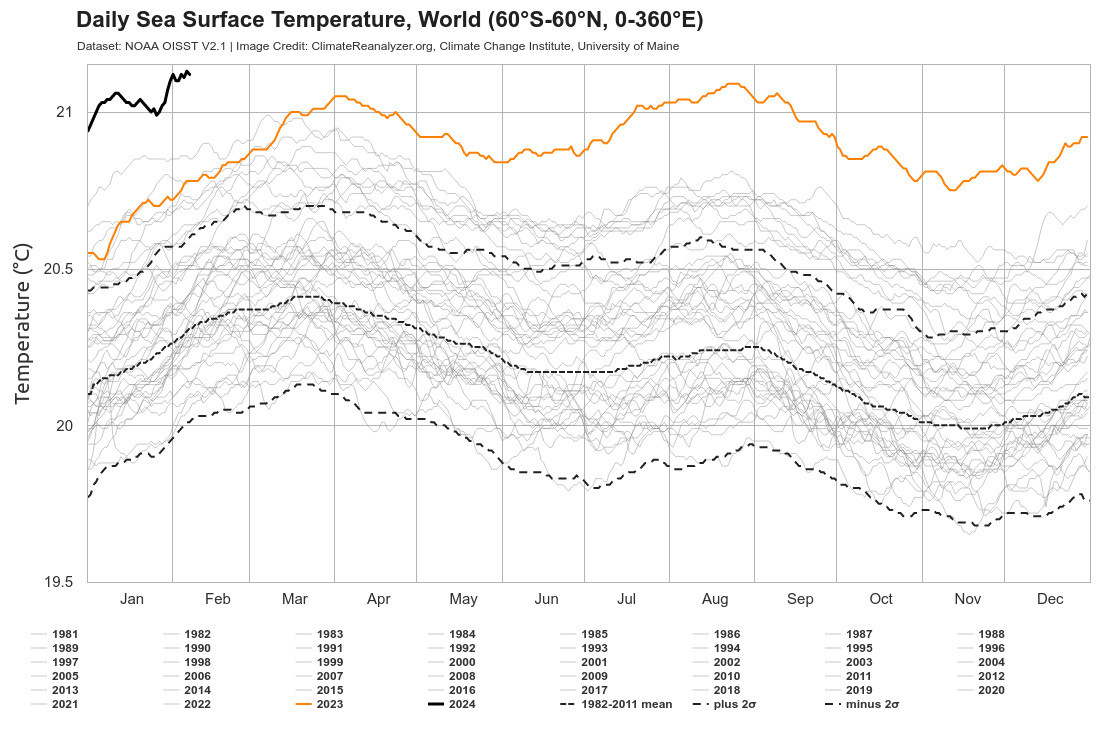
On Climate Reanalyzer there is a very interesting tool, the Daily Sea Surface Temperature. And looking to the plot (it's updated on february 7th) we see that the temperature is arrived (at least) at the record of the last year
https://climatereanalyzer.org/clim/sst_daily/
thanks to @andreabettini for the original sharing
See [NASA’s] SWOT Mission’s Unprecedented View of Global Sea Levels
--
https://www.nasa.gov/missions/swot/see-swot-missions-unprecedented-view-of-global-sea-levels/ <-- shared technical article
--
https://youtu.be/obIkUQtSJgk?si=Lim-RjLmOALDSt6i <-- video animation
--
https://swot.jpl.nasa.gov/ <-- project home page
--
Animation Details: “This animation shows global sea level data collected by the Surface Water and Ocean Topography satellite from July 26 to Aug. 16. Red and orange indicate higher-than-average ocean heights, while blue represents lower-than-average heights…”
#GIS #spatial #mapping #remotesensing #global #animation #model #modeling #SLR #sealevel #sealevelrise #climatechange #radar #hydrospatial #SurfaceWaterandOceanTopography #SWOT #satellite #interferometer #seasurface #height #coast #coastal #visualisation #surfacewater #river #waterbodies #lakes #oceans #marine
@nasa
Data Behind Our #Warming #Oceans# NCEI’s Daily Optimum Interpolation #SeaSurface #Temperature DOISST also helps scientists identify #marine #heatwave trends such as noted increase in #ArcticOcean (DOISST) provides global data coverage, blended data, and daily product production needed to identify marine #heatwaves & track their intensity, duration & real coverage. DOISST also helps scientists identify marine heatwave trends such as the noted increase in the Arctic Ocean. https://www.ncei.noaa.gov/news/data-behind-our-warming-oceans
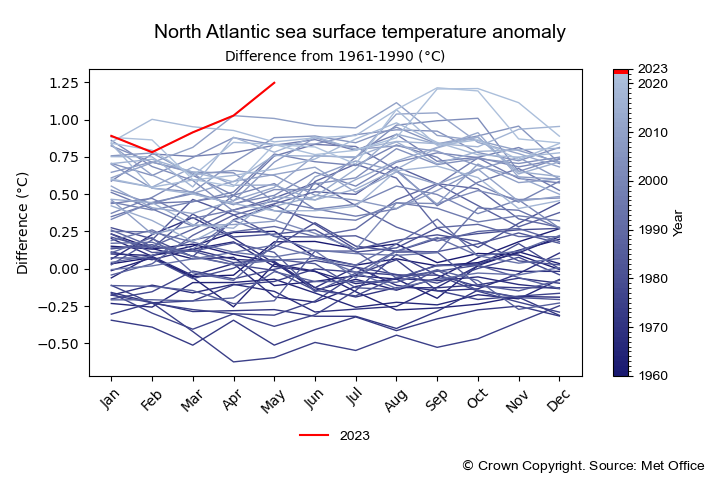
Ocean Heat Is Off The Charts—Here's What That Means For Humans And Ecosystems Around The World
--
https://phys.org/news/2023-06-ocean-chartshere-humans-ecosystems-world.html <-- shared technical article
--
#GIS #spatial #mapping #gischat #global #spatialanalysis #ocean #temperatures #climatechange #globalwarming #globalimpacts #marine #water #seaice #remotesensing #spatiotemporal #elniño #lanina #record #monitoring #seasurface #weather #currents #winds #sealevelrise #SLR #world #impacts #globalimpact #globalhealth #globalheating #ecosystems #environment #humanimpact
A Century Of Observed Temperature Change In The Indian Ocean
--
https://doi.org/10.1029/2022GL098217 <-- shared paper
--
“KEY POINTS:
• Historical observations of subsurface Indian Ocean temperature are recovered from expeditions in the late 19th and early 20th century
• Indian Ocean warming over the 20th century extends to 750 m depth
• Pattern of temperature change is consistent with surface warming and a poleward shift of the gyre over the last half of the 20th century..."
#GIS #spatial #mapping #temperature #ocean #sea #seasurface #IndianOcean #history #change #statistics #spatiotemporal #climatechange #warming #record #spatialanalysis #remotesensing #gyre #datacollection #research
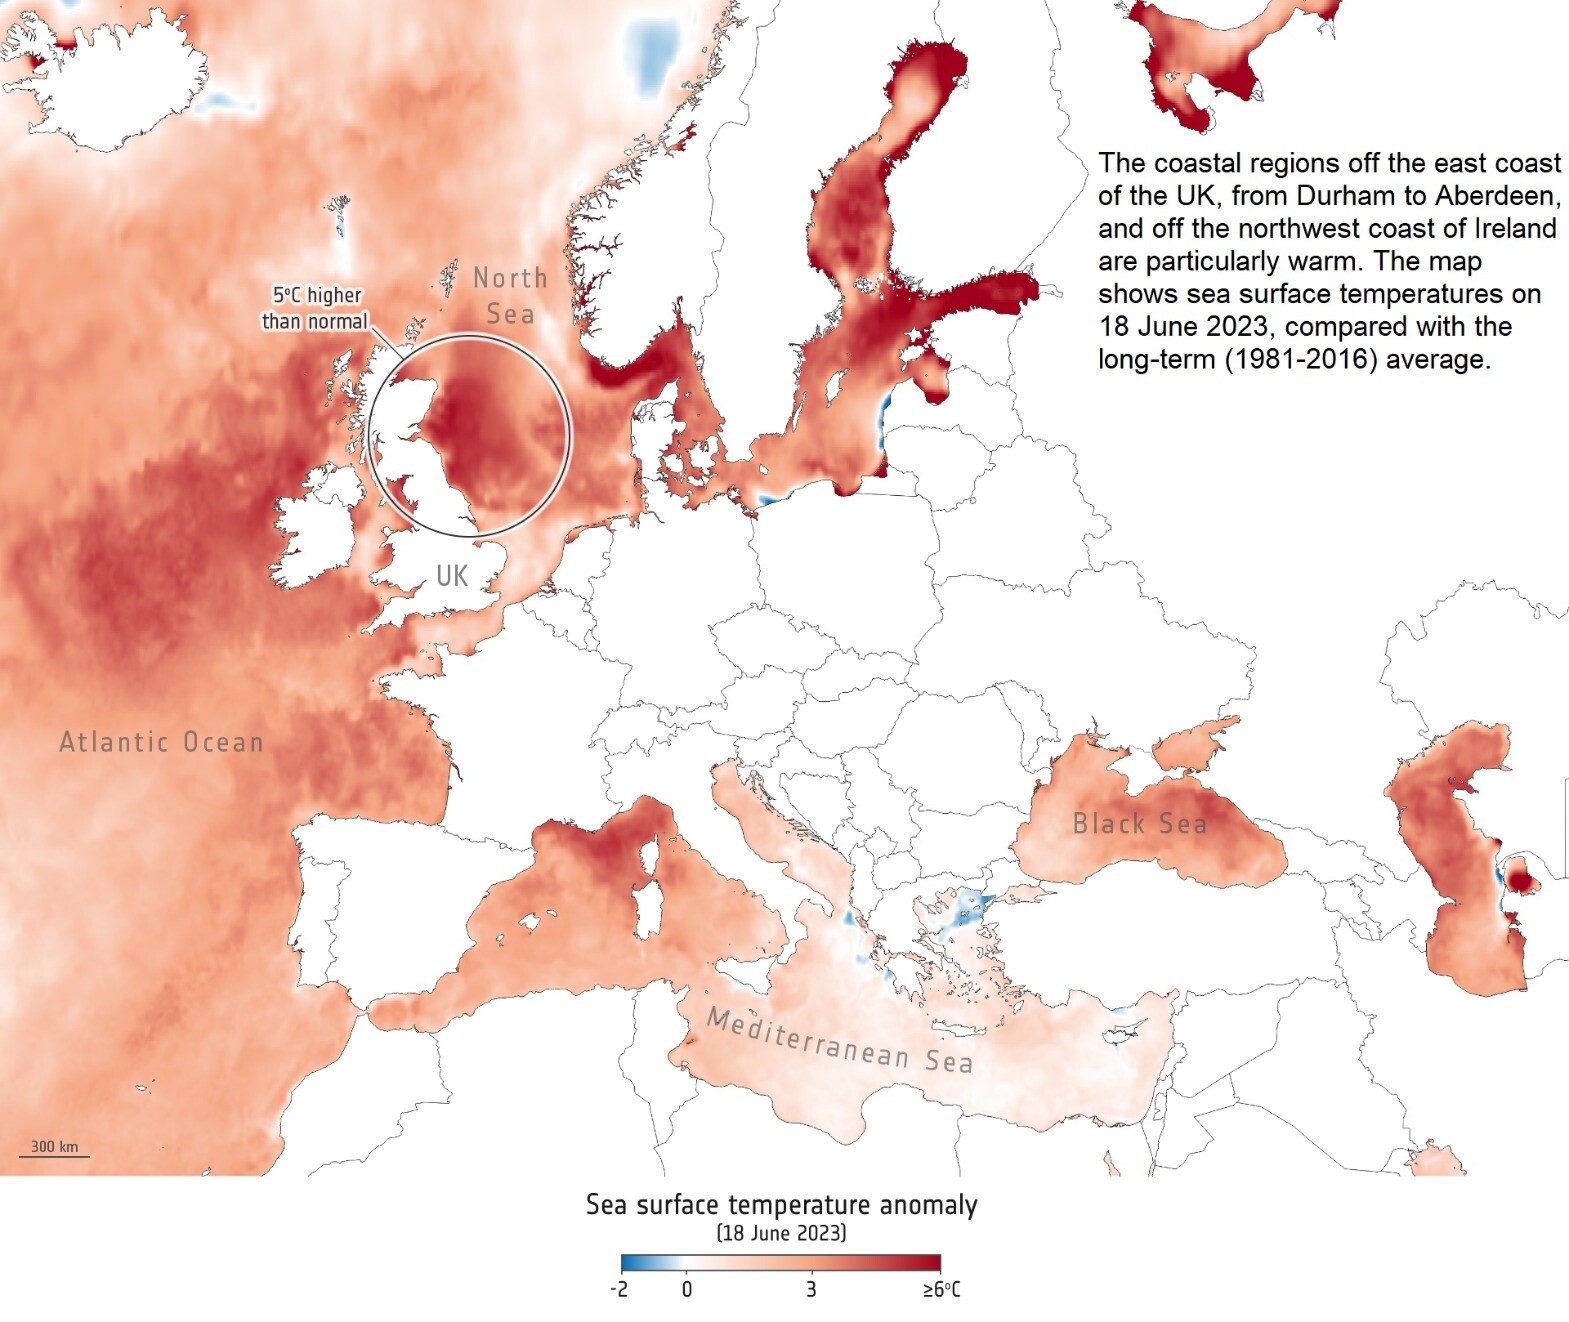
UK Suffers Marine Heatwave [earth observation]
--
https://www.esa.int/ESA_Multimedia/Images/2023/06/UK_suffers_marine_heatwave <-- shared technical article
--
#GIS #spatial #mapping #earthobservation #UK #Europe #remotesensing #satellite #copernicus #water #climatechange #marine #data #events #temperature #warming #heatwave #extremeweather #oceanography #ecosystems #extremeheat #marineheatwave #fisheries #aquaculture #global #seasurface #watertemperature #England #Britian
@ESA

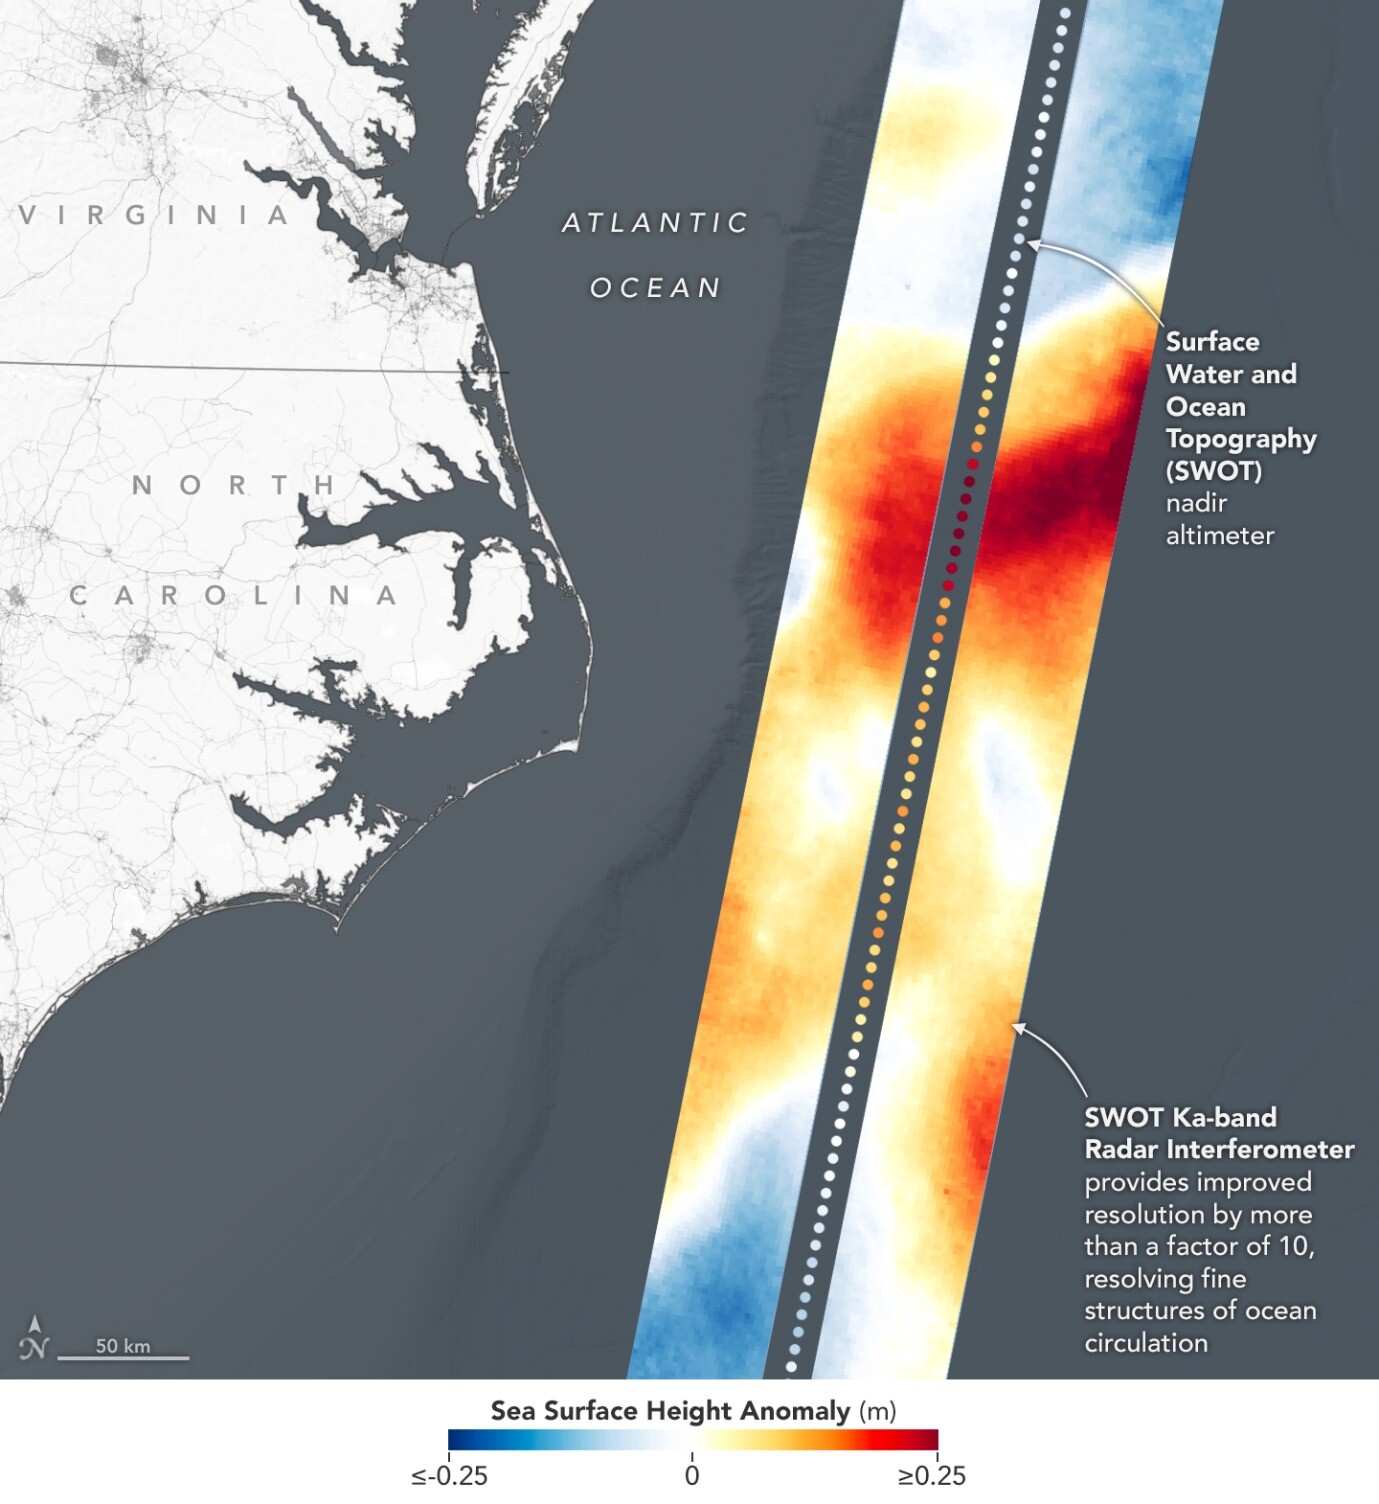
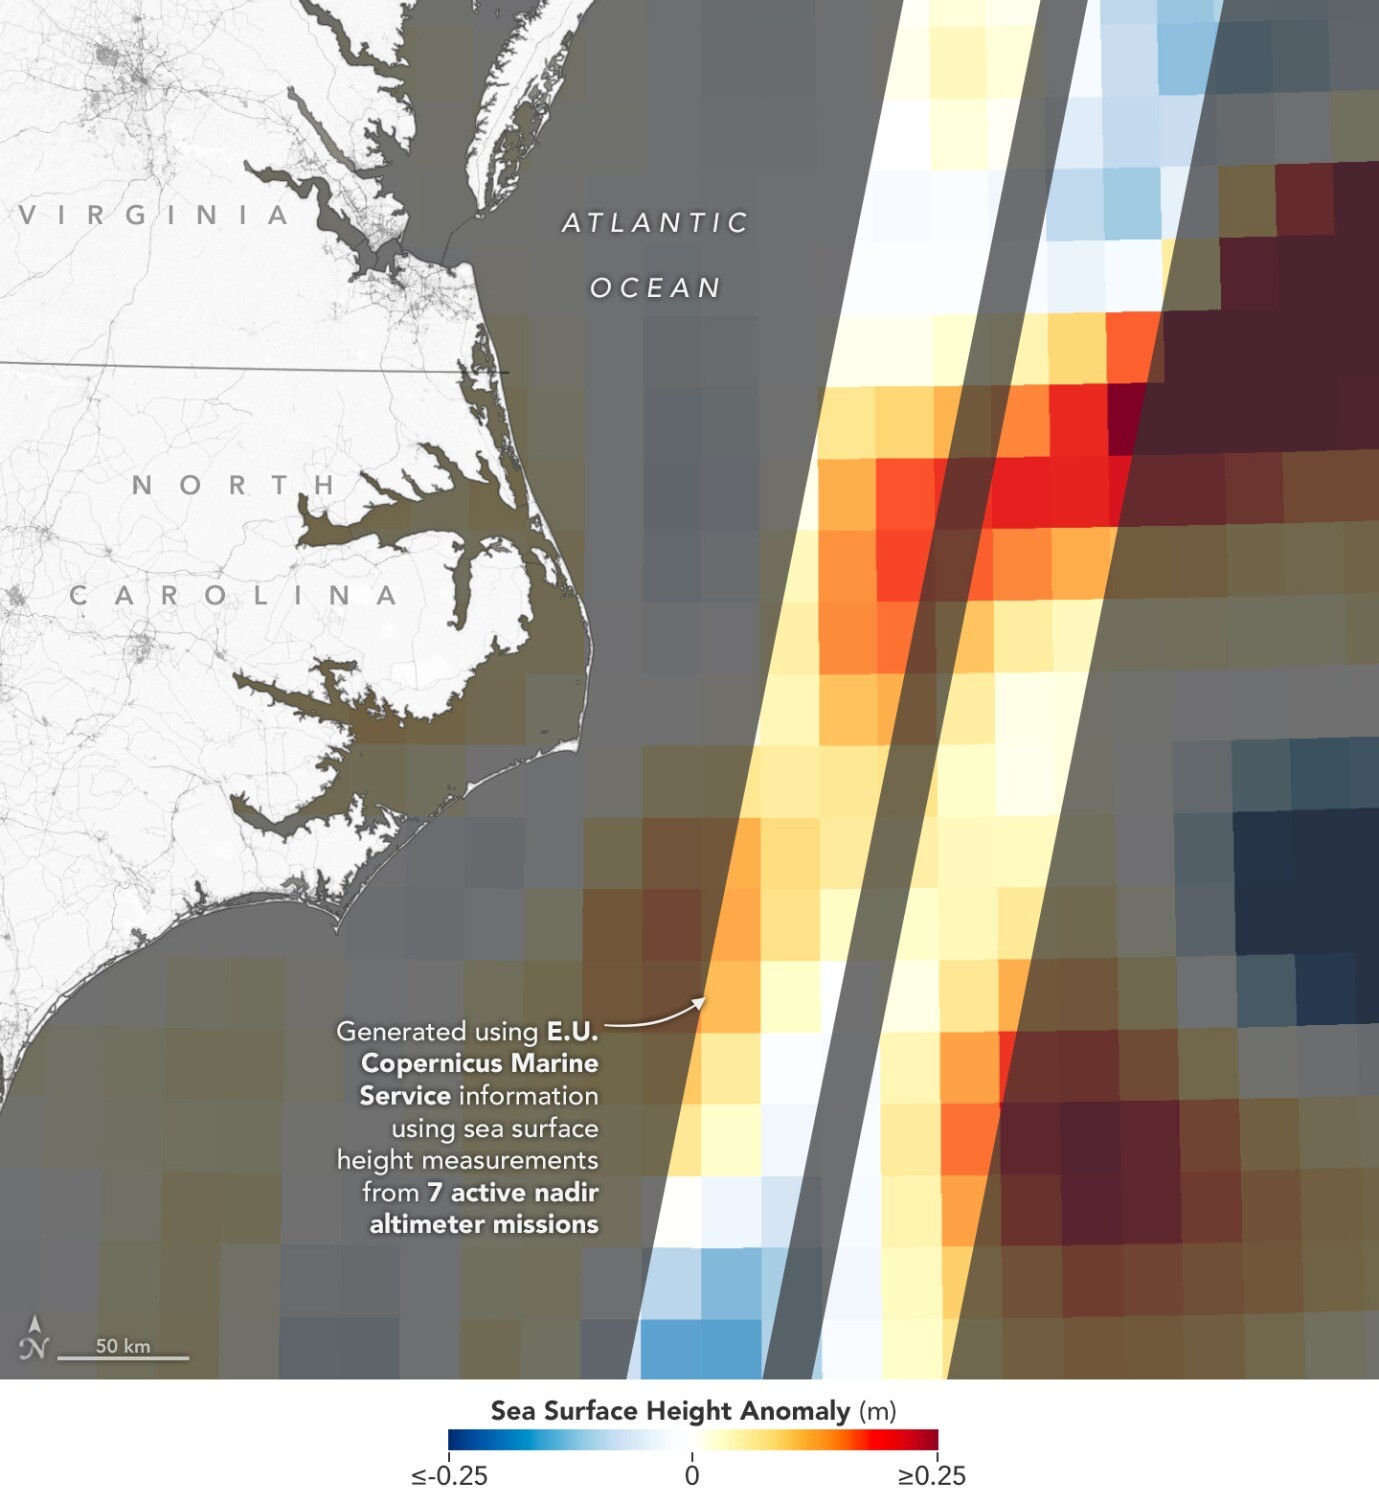
NASA-CNES SWOT measures Surface Water and Ocean Topography at ten time higher resolution than previous satellites. #SurfaceWater #OceanTopography #NASA #CNES #SeaSurface #oceans #lakes #rivers
#Sentinel1 satellites can see right through #hurricanes measuring the #SeaSurface below to help predict their paths. http://www.esa.int/Our_Activities/Observing_the_Earth/Copernicus/Sentinel-1/Sentinel-1_sees_through_hurricanes #Sentinel-1
RT @ESA_EO: #Sentinel1 satellites can see right through #hurricanes measuring the #SeaSurface below to help predict their paths… source: https://twitter.com/esa/status/923096686683217920
Client Info
Server: https://mastodon.social
Version: 2025.04
Repository: https://github.com/cyevgeniy/lmst