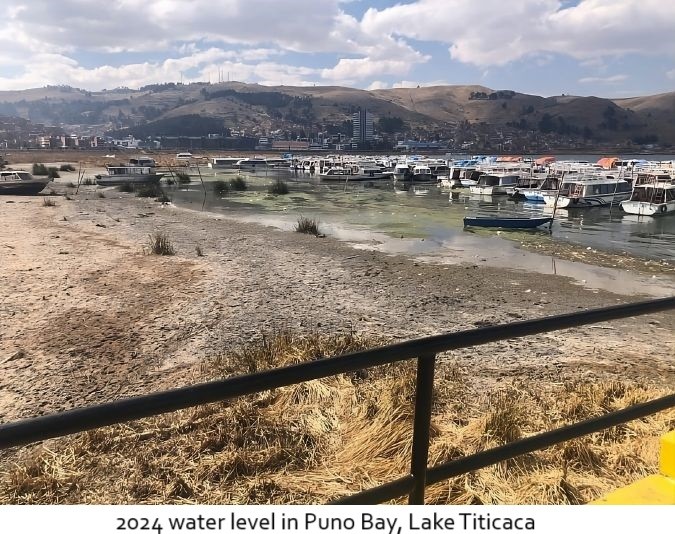
Surveying Lake Titicaca [2024]
--
https://www.hydro-international.com/content/article/surveying-lake-titicaca <-- shared technical article
--
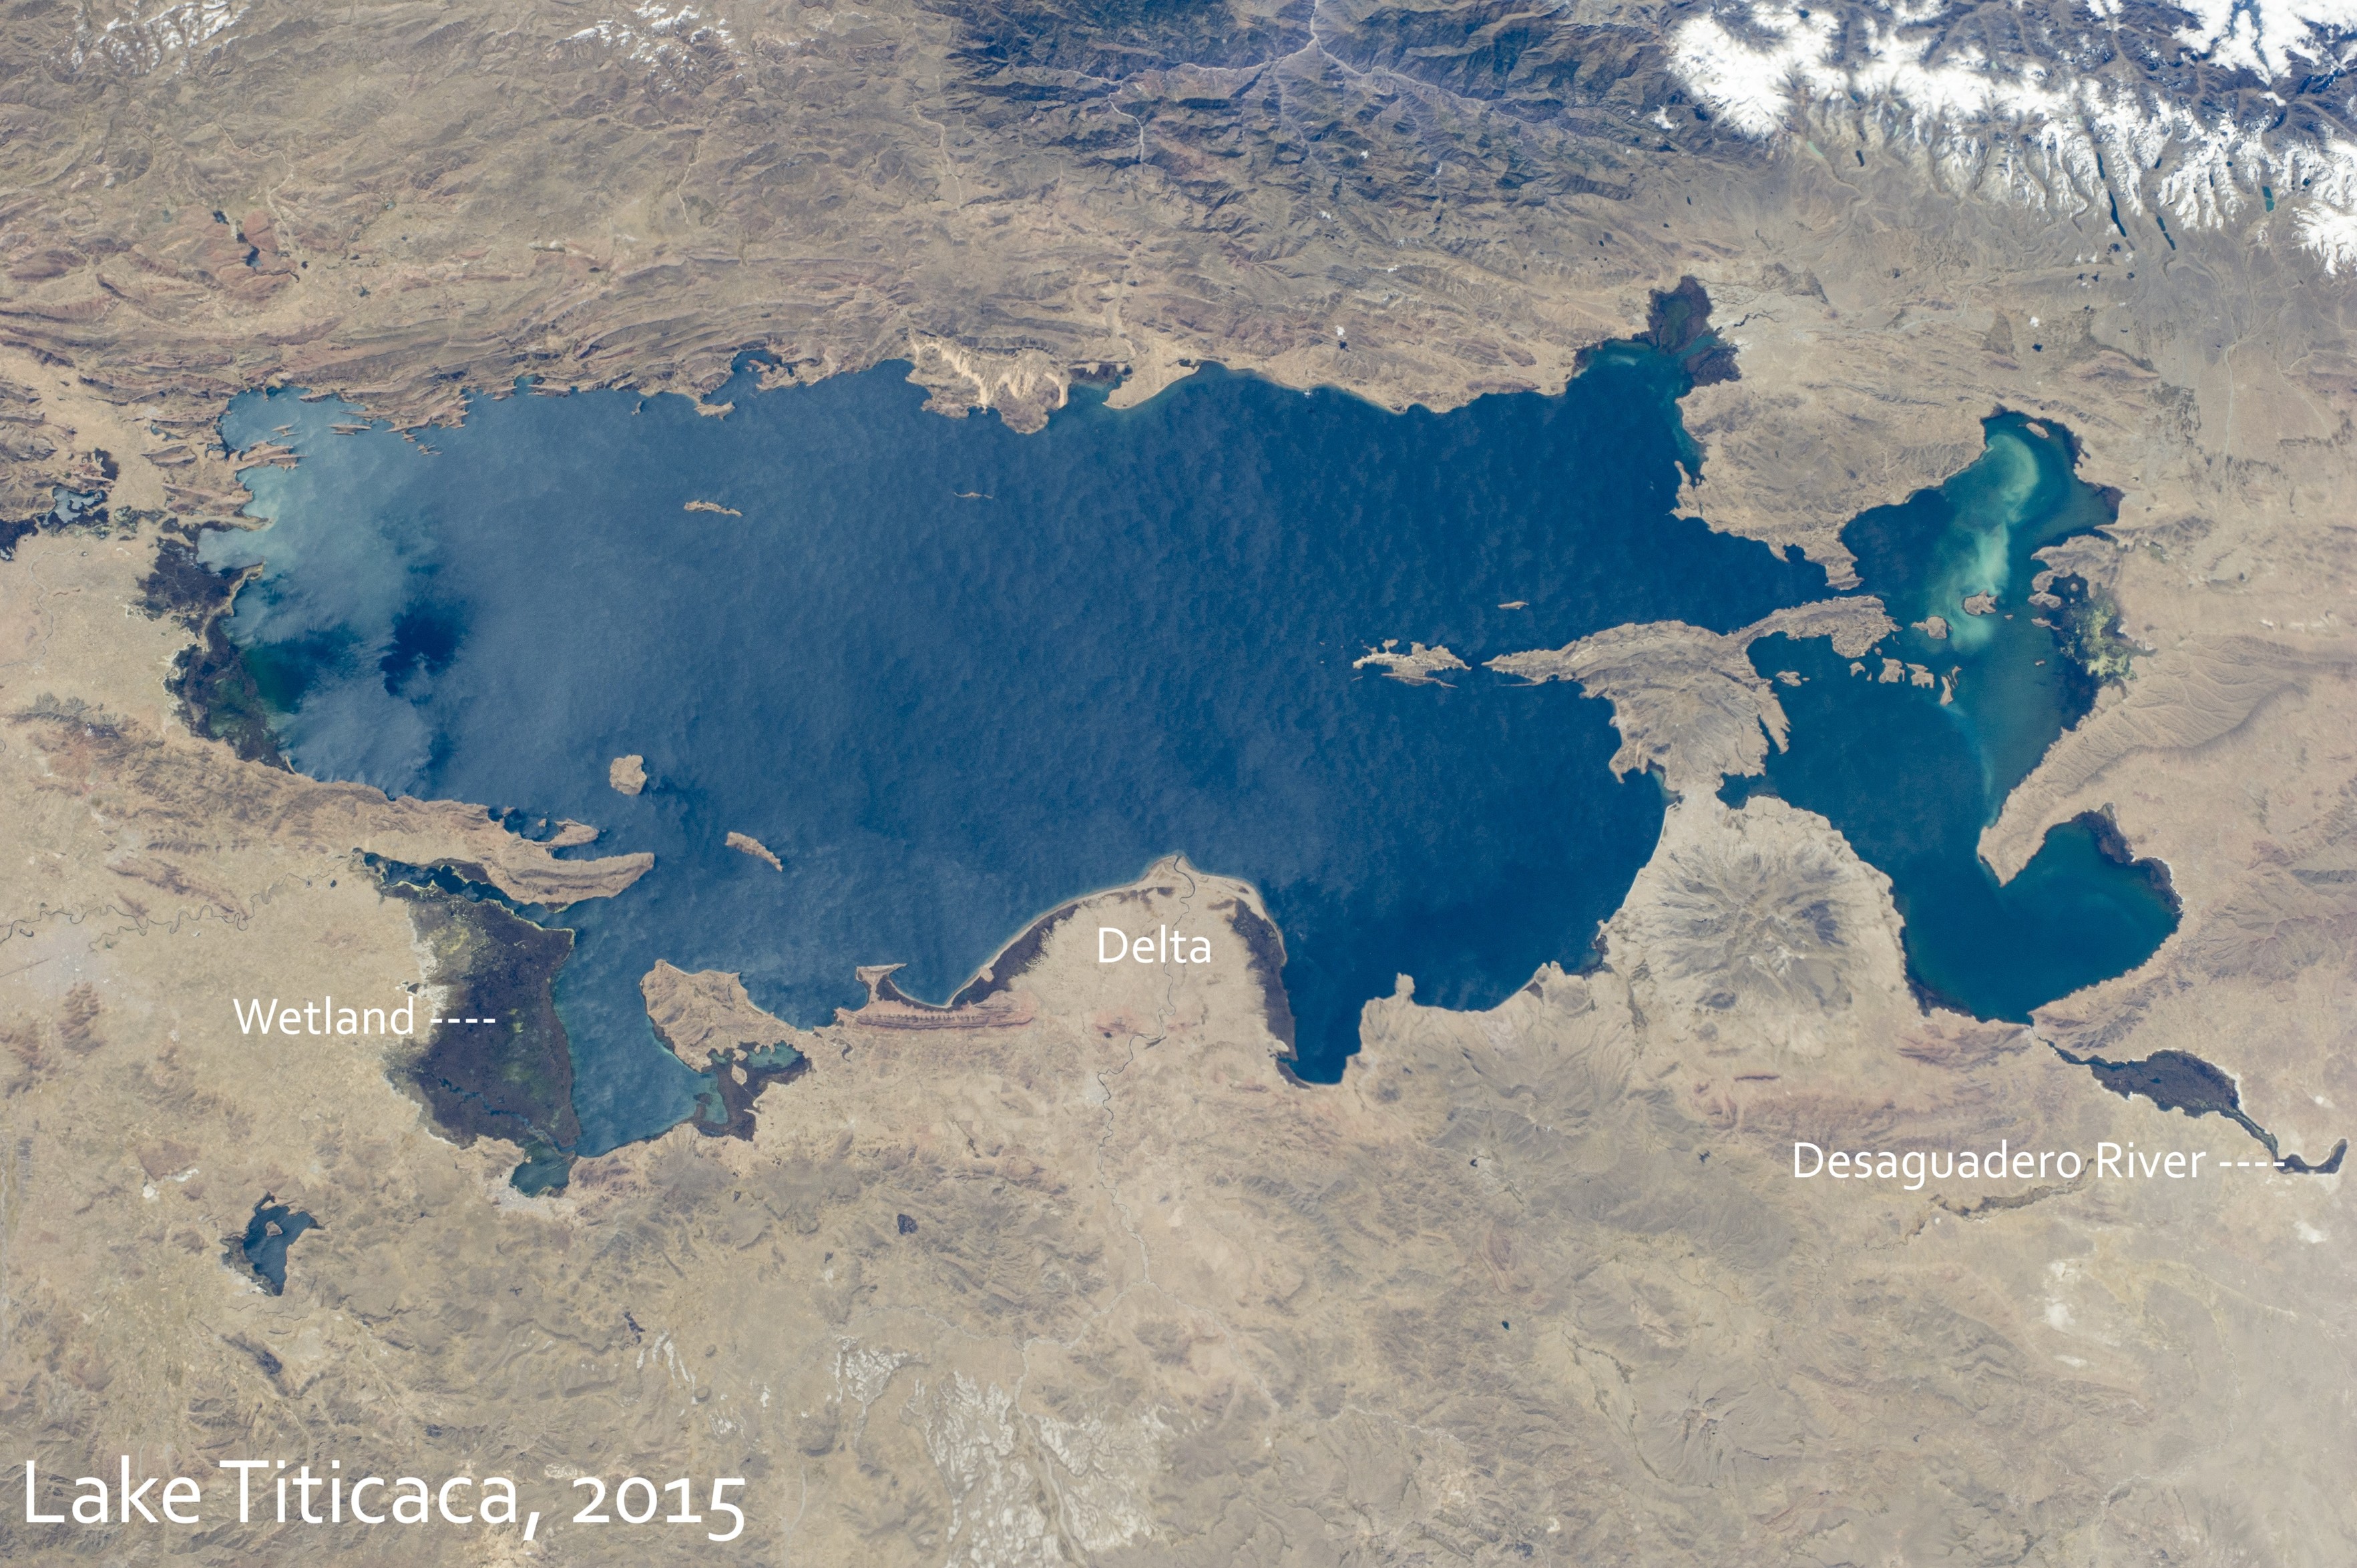
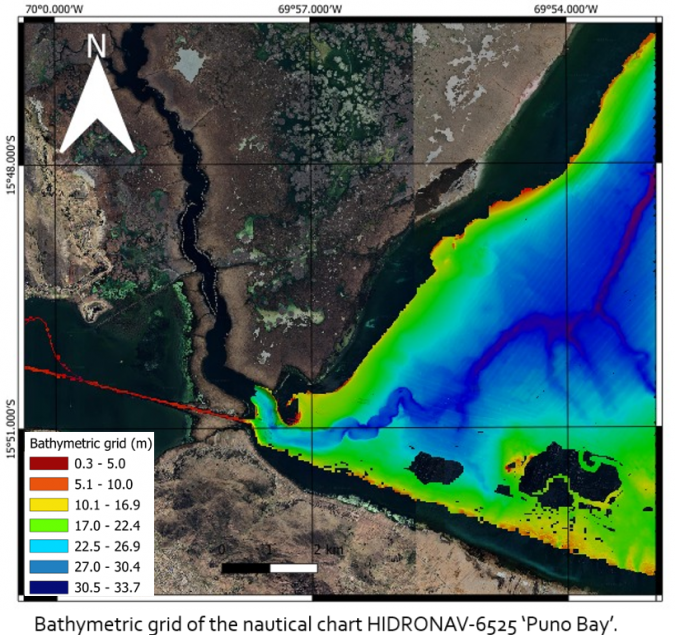
[A very comprehensive hydrographic and shallow geophysical study and mapping effort of Lake Titicaca…]
“In October 2024, officers from the Category “A” Specialization Programme in Hydrography for Naval Officers of the Peruvian Navy conducted their complex multidisciplinary field project at Lake Titicaca at Puno in Peru, which is the highest navigable lake in the world (3,800 metres above sea level). The purpose of this survey was to address issues in the lacustrine environment due to hydrological processes that have occurred in recent years in this water body.…”
#GIS #spatial #mapping #hydrospatial #hydrology #hydrography #LakeTiticaca #Bolvia #Puno #Peru #PeruvianNavy #lake #remotesensing #survey #lacustrine #vertical #multibeam #echsounder #sonar #geomatics #cartography #QGIS
#hydrospatial
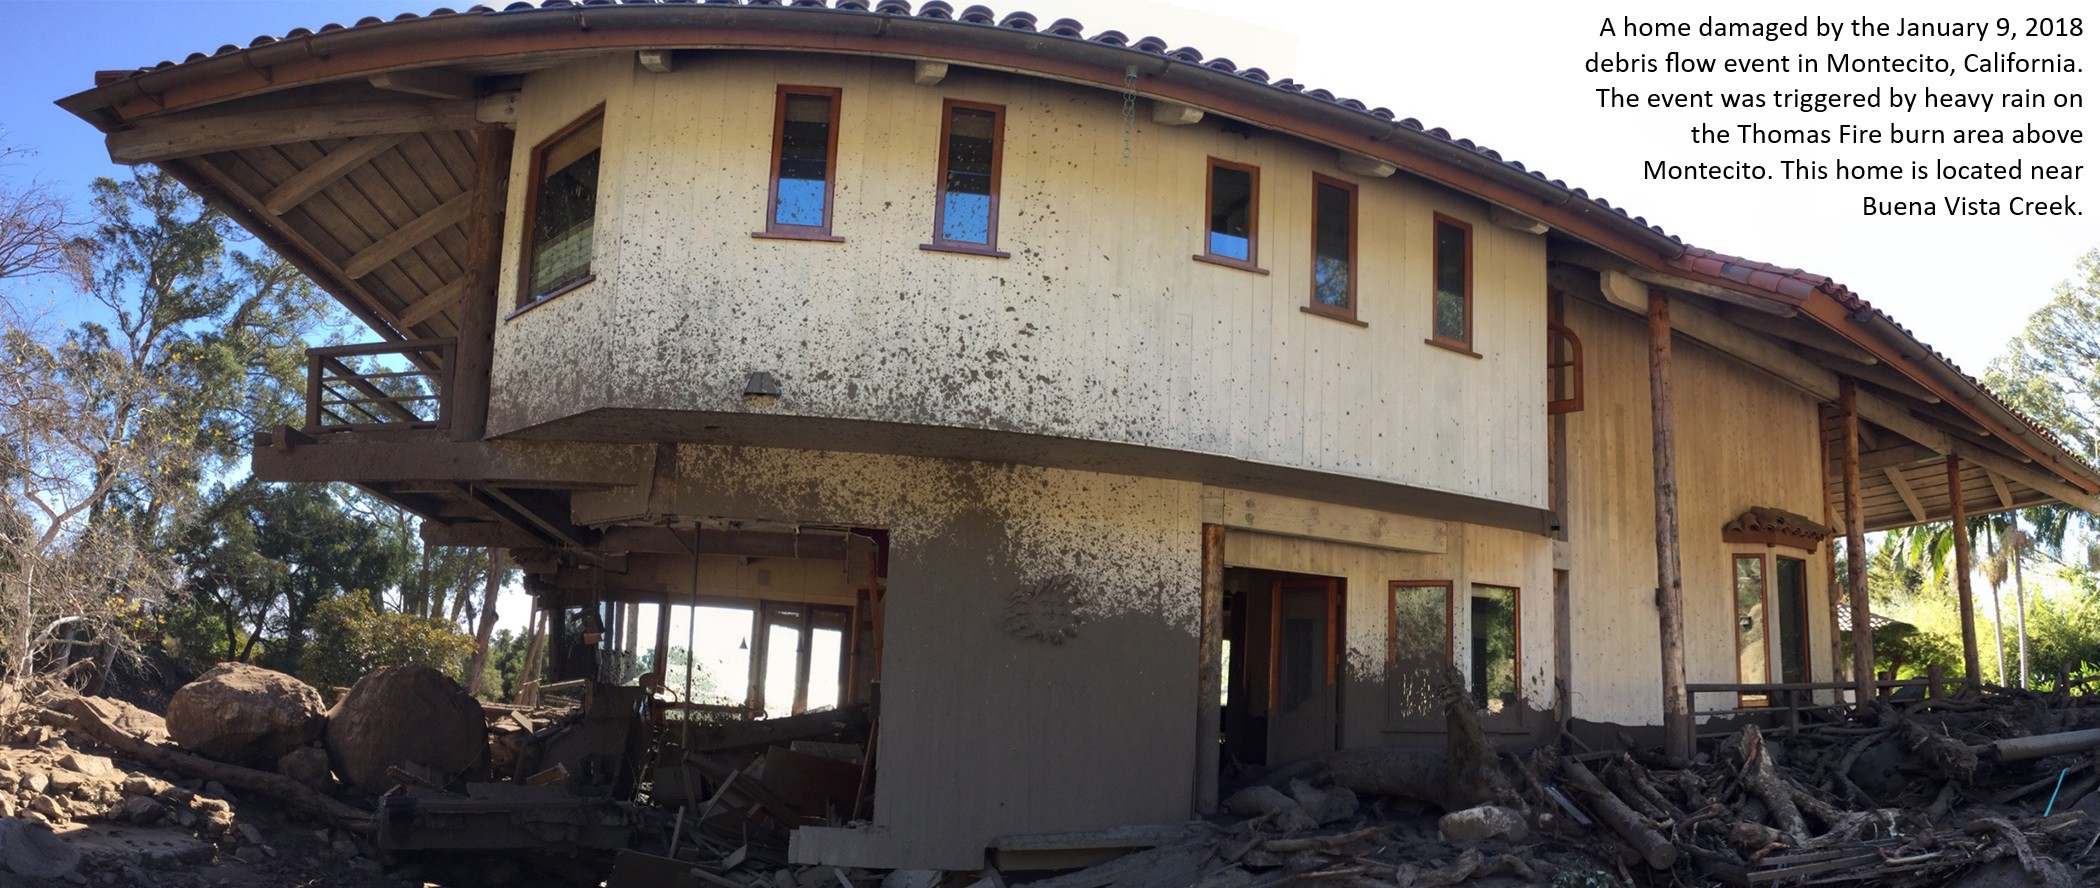
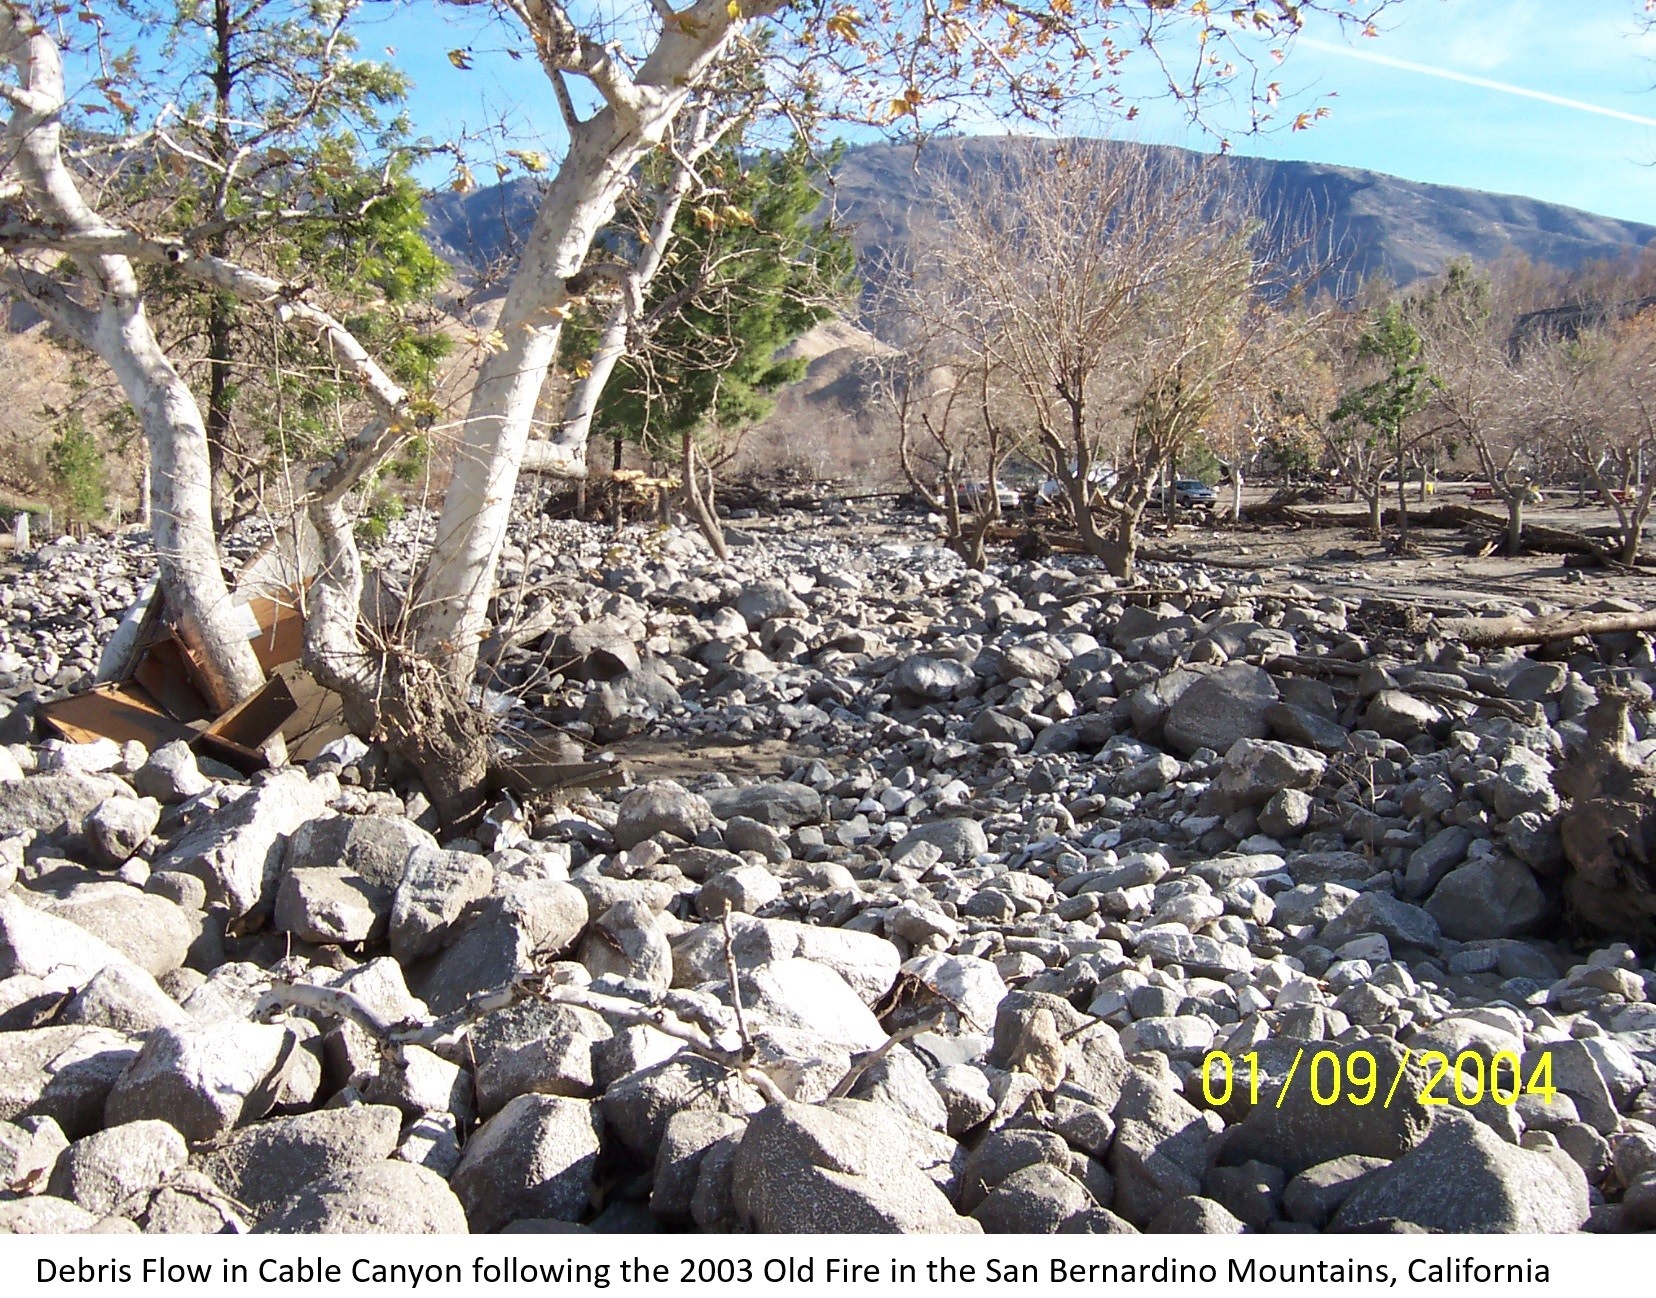
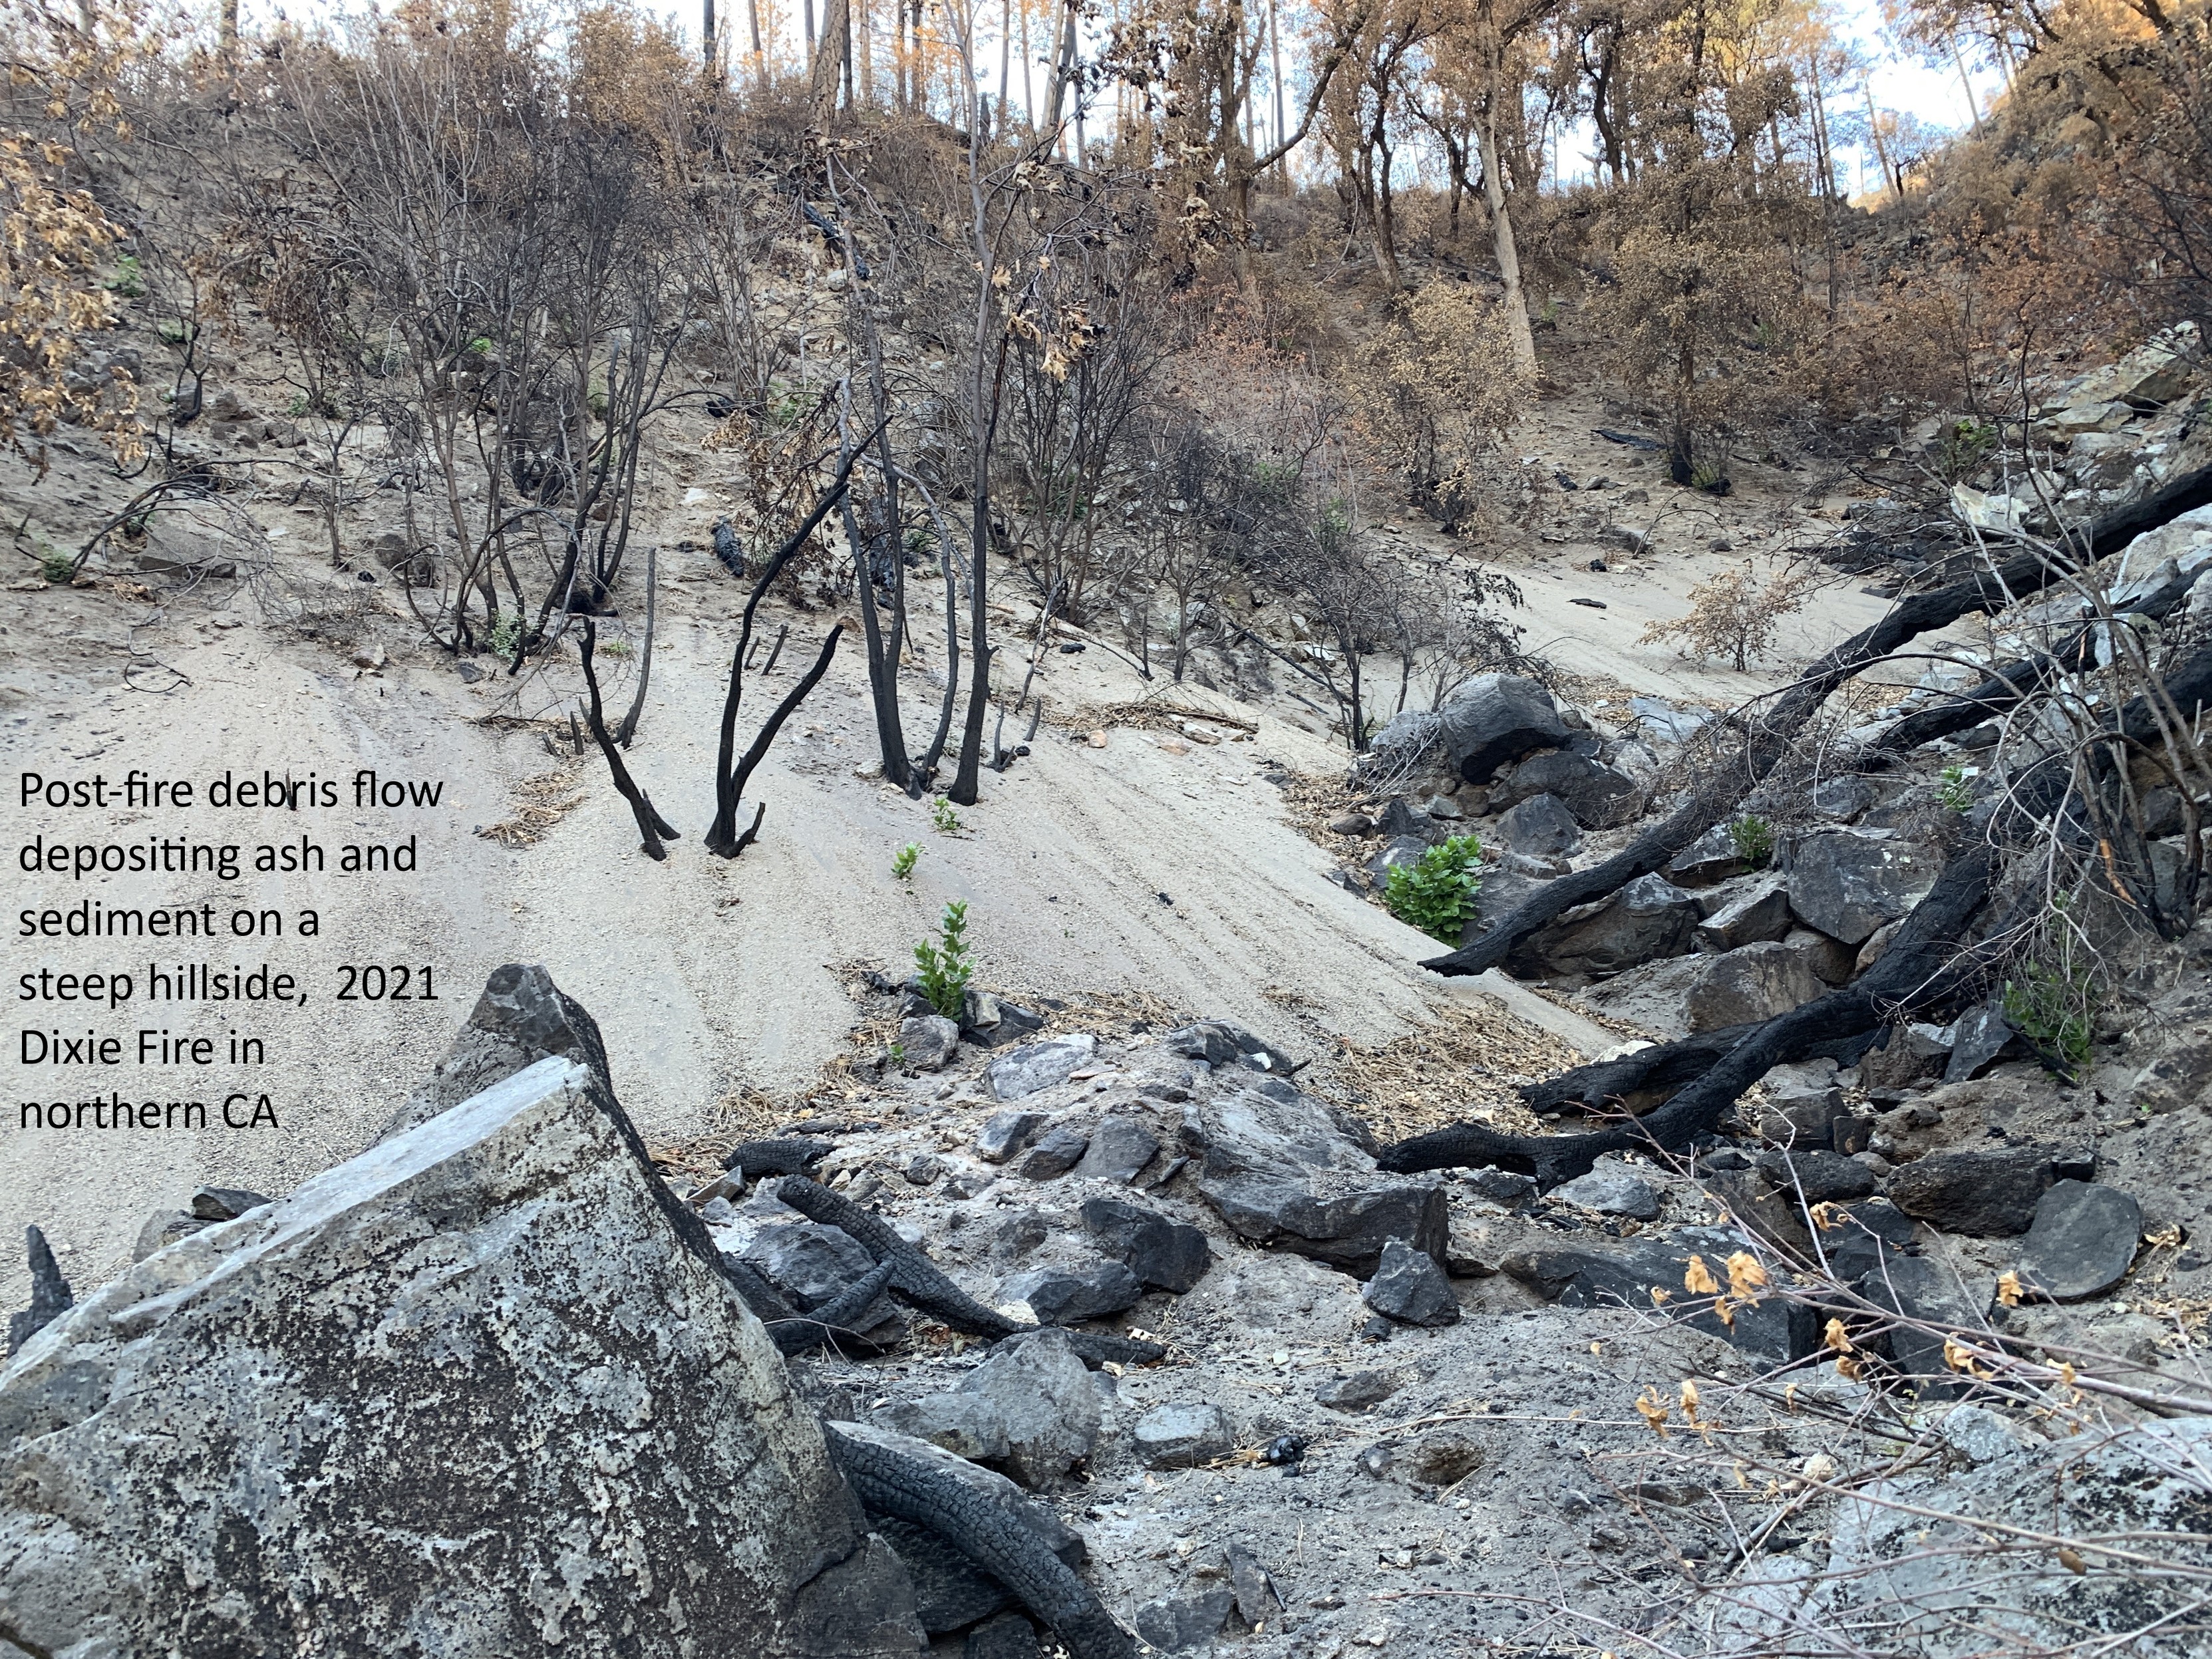
Postfire Debris-Flow Hazards
--
https://www.usgs.gov/programs/landslide-hazards/science/postfire-debris-flow-hazards <-- shared technical article / overview
--
http://alturl.com/po3yj <-- USGS Post-Fire Debris Flow Hazard Assessment Viewer
--
https://earthquake.usgs.gov/arcgis/rest/services/ls/ <-- Post-Fire Debris-Flow Hazards USGS spatial data / GIS Services
--
#GIS #spatial #mapping #USGS #LandslideHazardsProgram #NaturalHazards #3DEP #NGP #NationalGeospatialProgram #GIRT #GeospatialInformationResponseTeam #GIS #geology #hydrospatial #hydrology #landslides #debrisflows #fires #postfire #lidar #elevationdata #hazardassessments #preparedness #massmovement #engineeringgeology #risk #hazards #impacts #cost #economics #geomorphology #geomorphometry #spatialanalysis #spatiotemporal #remotesensing #soil #model #modeling #LosAngeles #LA #LosAngelesfires #California #wildfires #opendata
@USGS

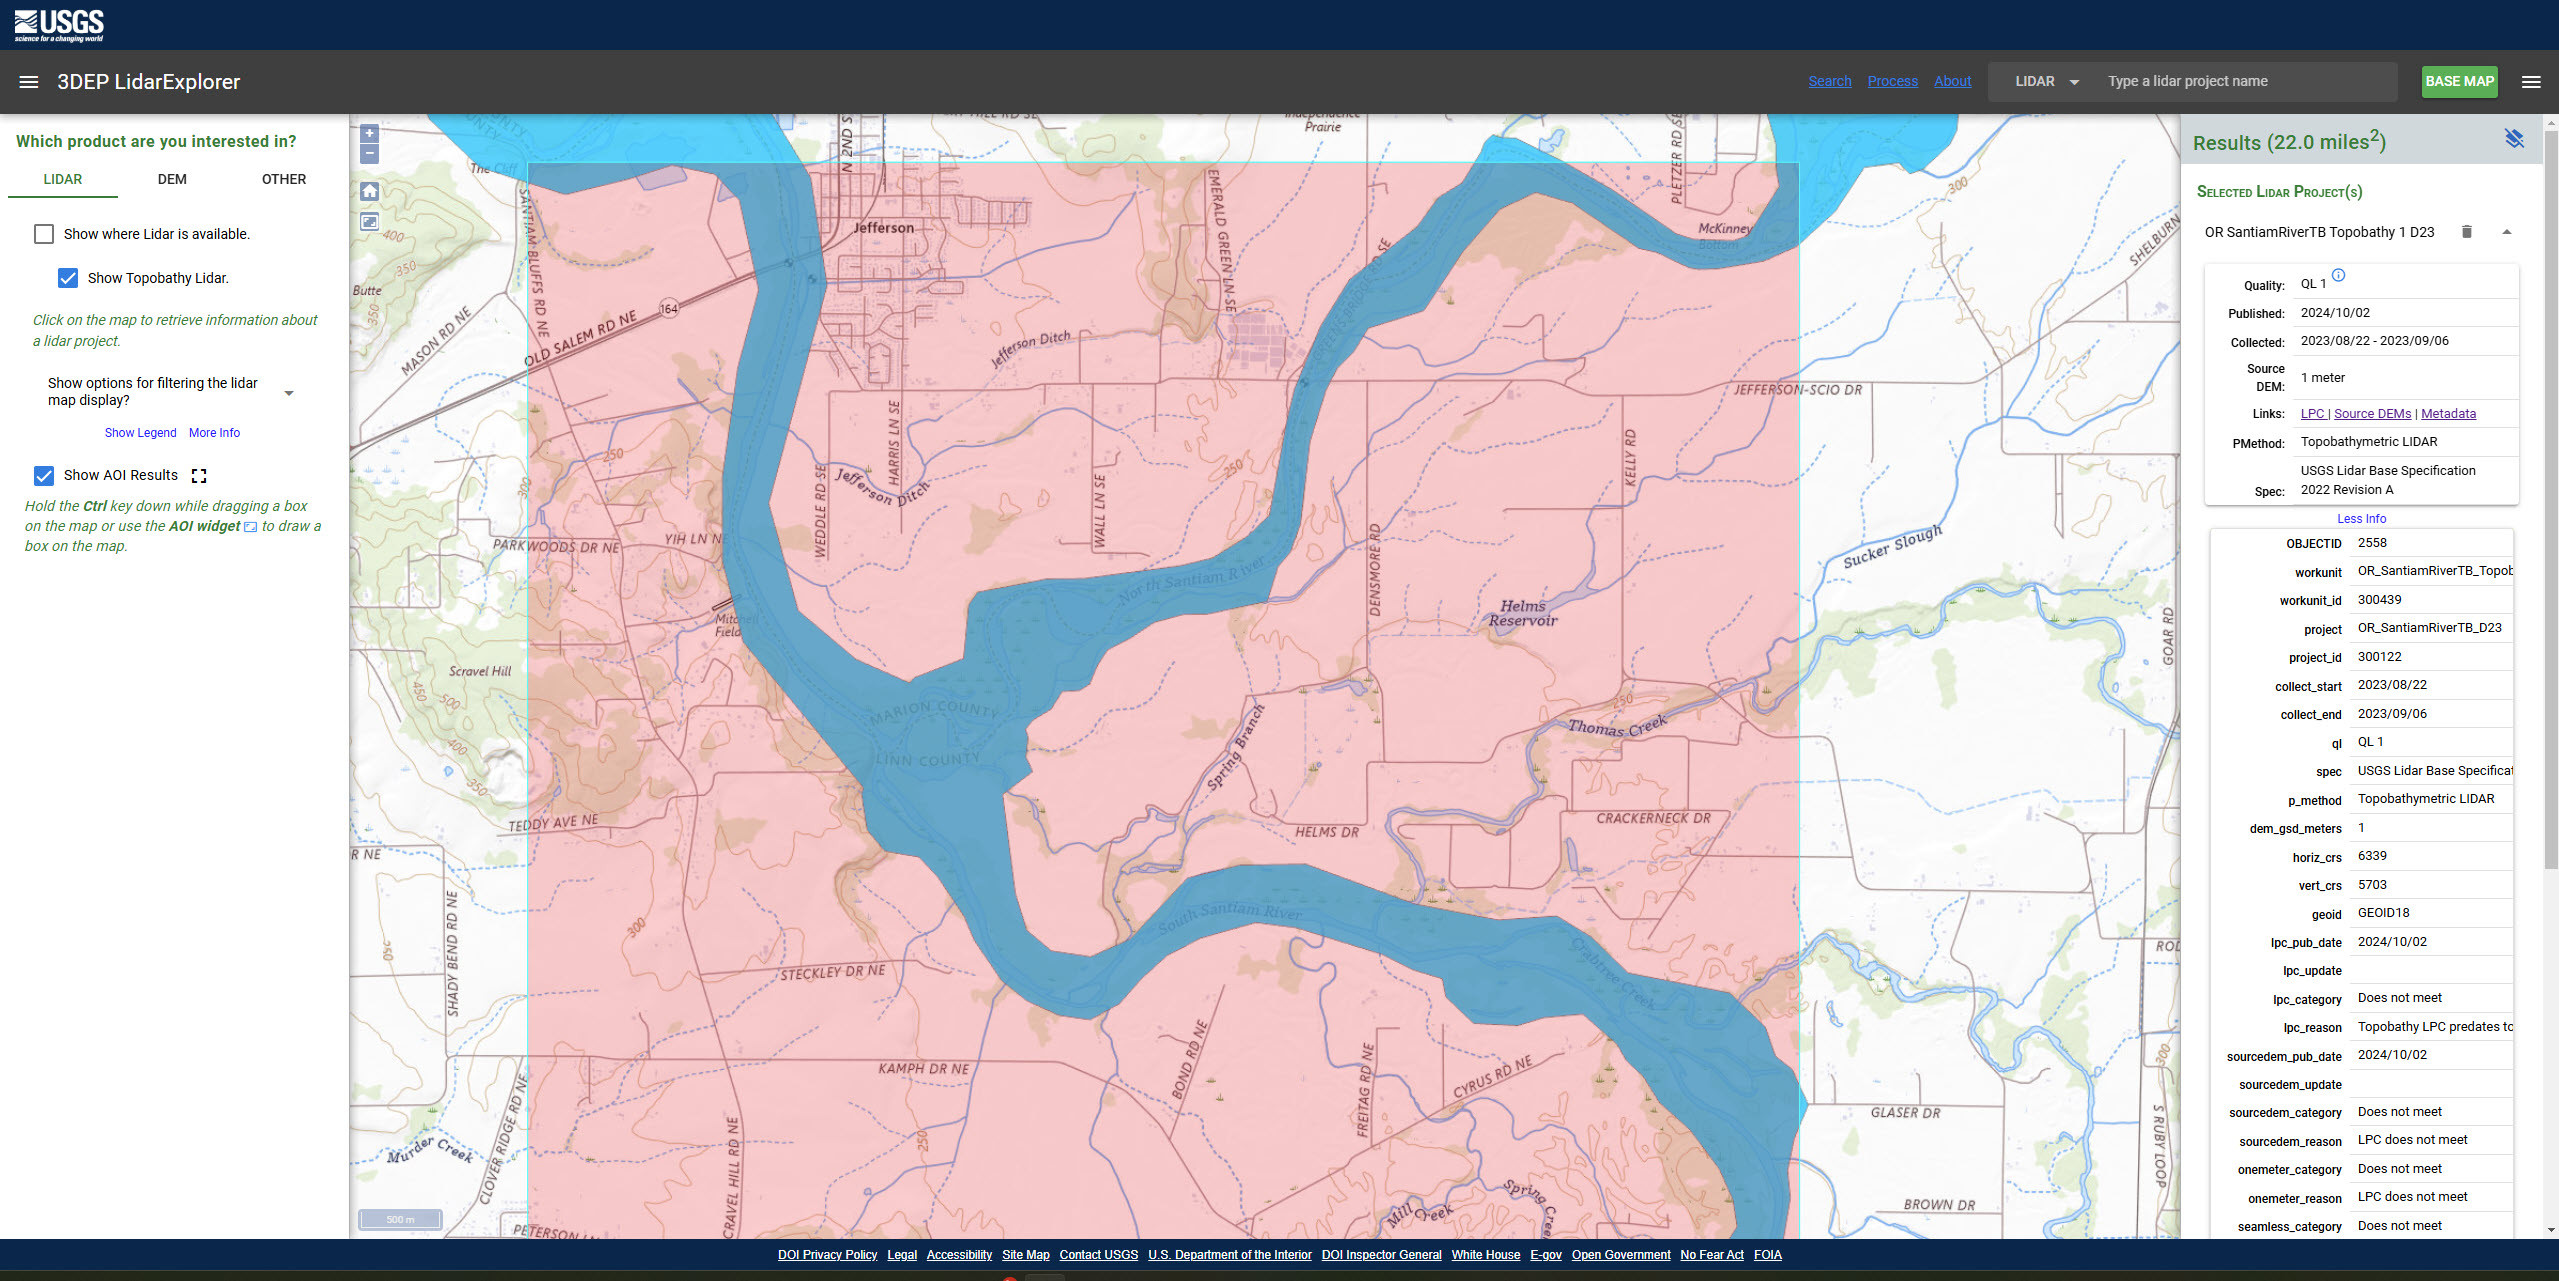
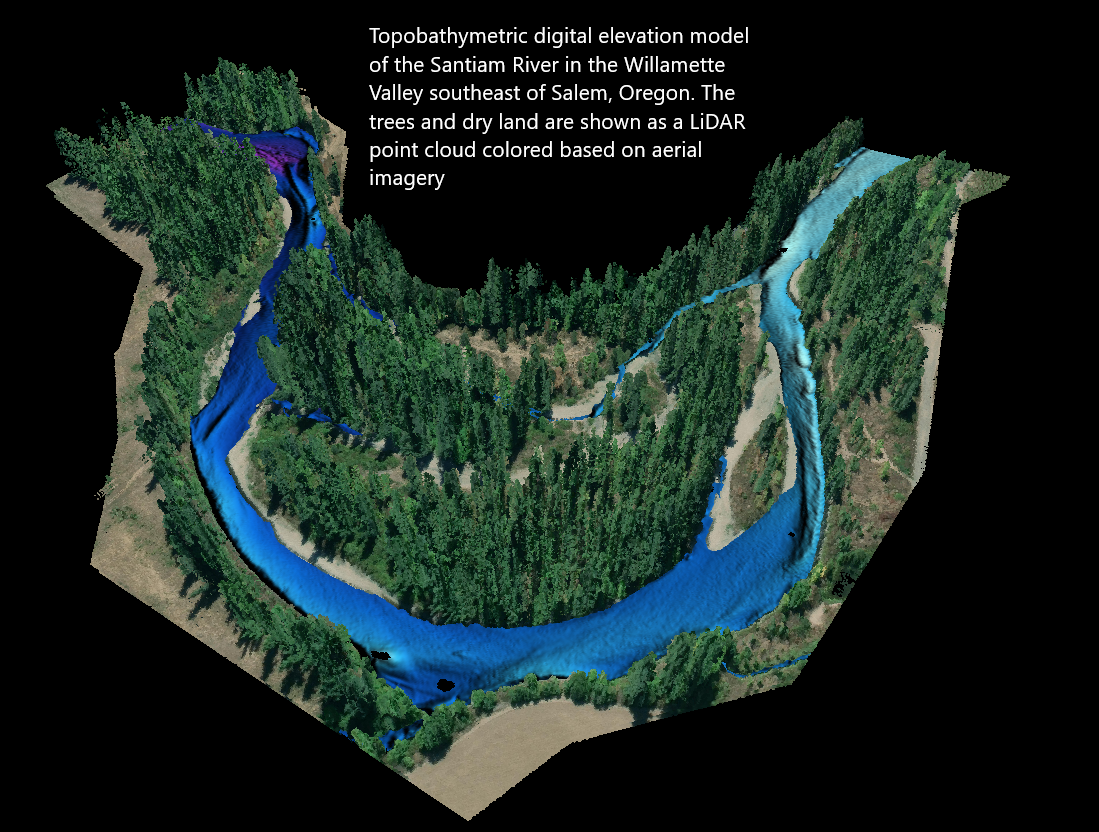
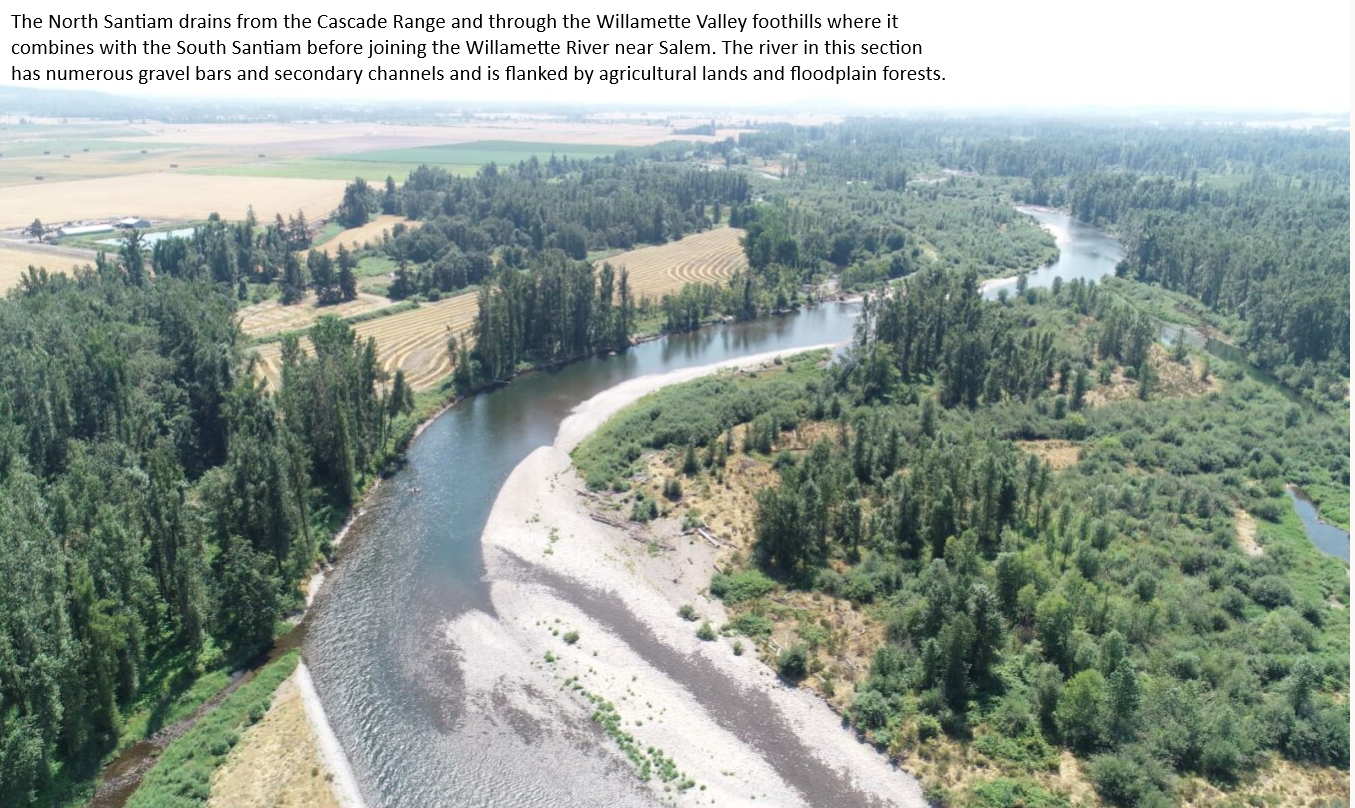
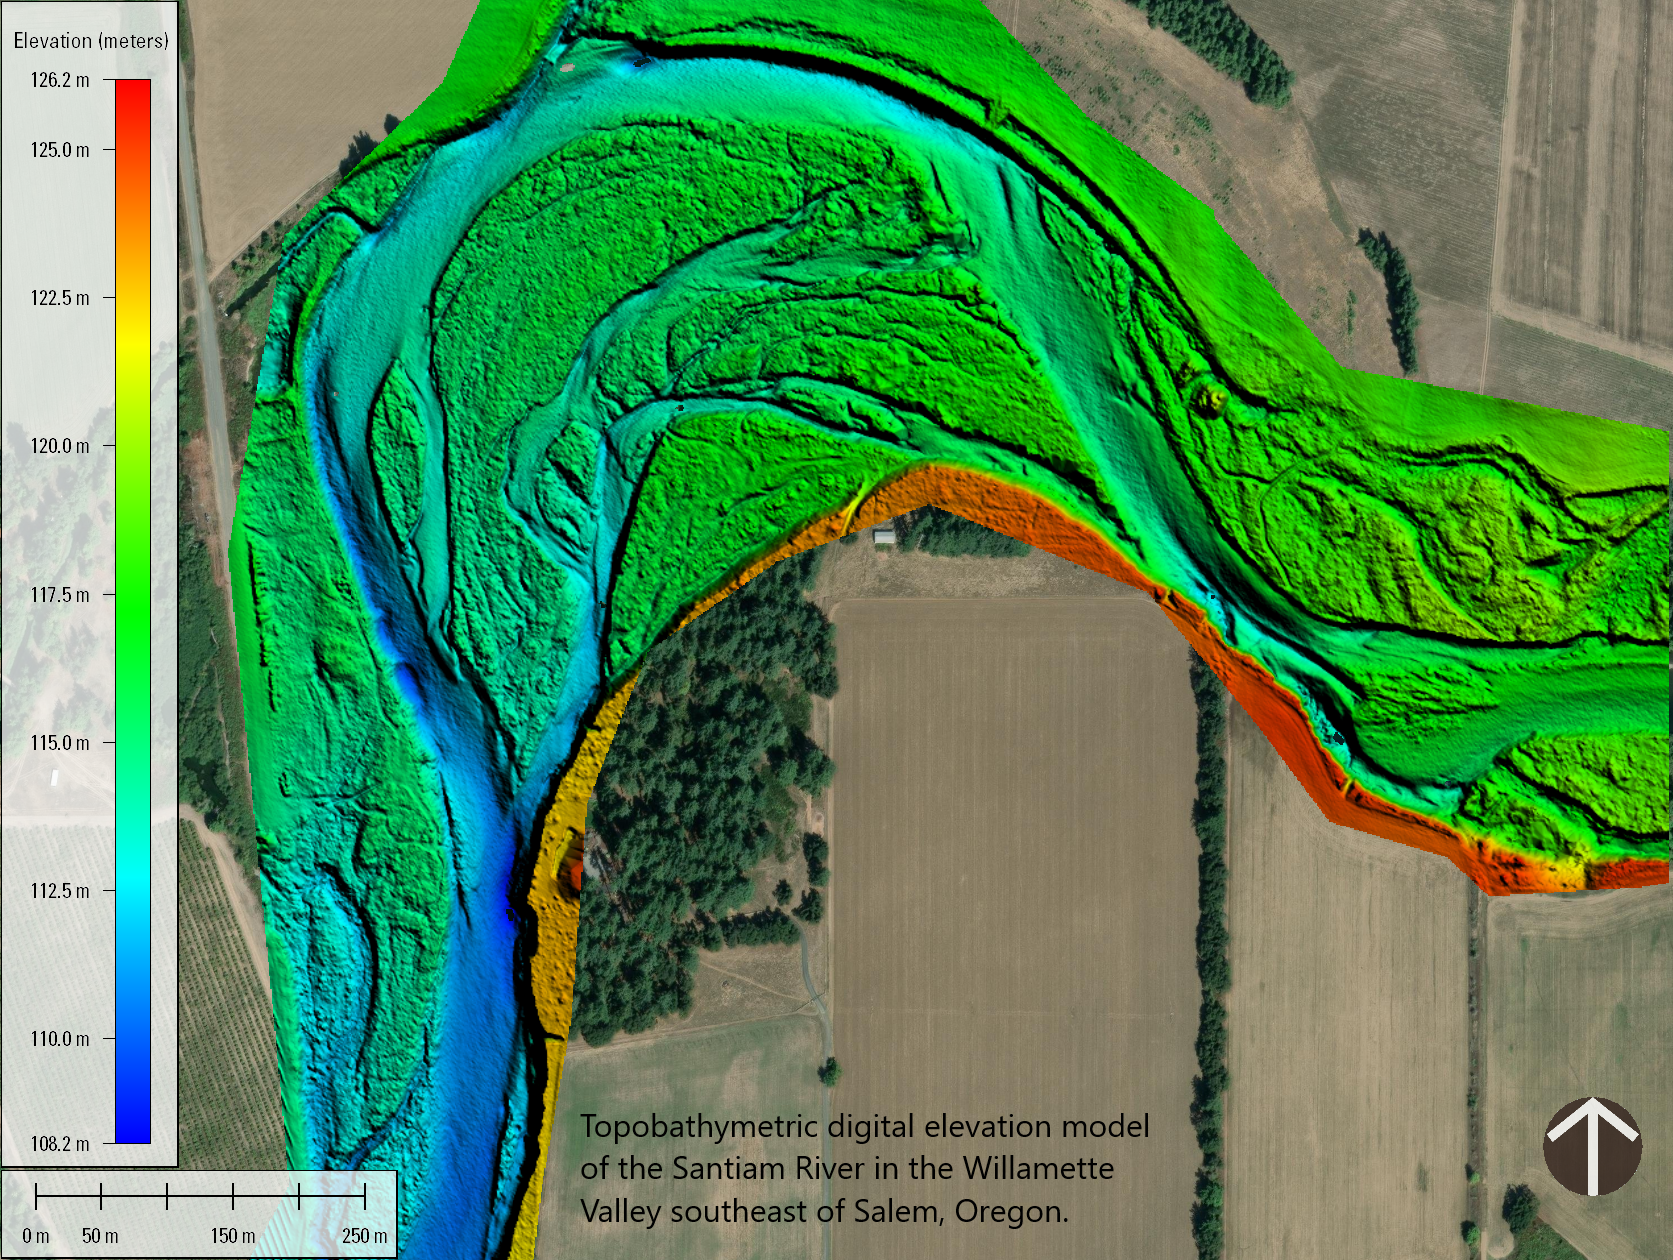
New USGS Dataset Uncovers The Santiam River’s Underwater Topography To Aid In Fish Habitat And Water Flow Management
--
https://www.usgs.gov/news/national-news-release/new-usgs-dataset-uncovers-santiam-rivers-underwater-topography-aid-fish <-- shared article
--
https://apps.nationalmap.gov/lidar-explorer/#/ <-- USGS 3DEP LiDAR Explorer (open data)
--
#GIS #spatial #mapping #remotesensing #LiDAR #topobathymetry #topobathy #example #usecase #wildfires #rivermanagement #climatechange #waterresources #SantiamRiver #Oregon #KlamathRiver #PotomacRiver #ColoradoRiver #USGS #USACE #3DEP #opendata #topography #elevation #3DTNM #water #hydrology #hydrospatial #pilotproject #prototype #infrastructure #navigation #engineering #riverbed #sediment #sedimentation #habitat #river #waterbody #flowmanagement #dams #salmon #steelhead #fish #WillametteValley #flood #flooding #risk #hazard #model #modeling #FIM #watersupply #agriculture
@USGS @USACE
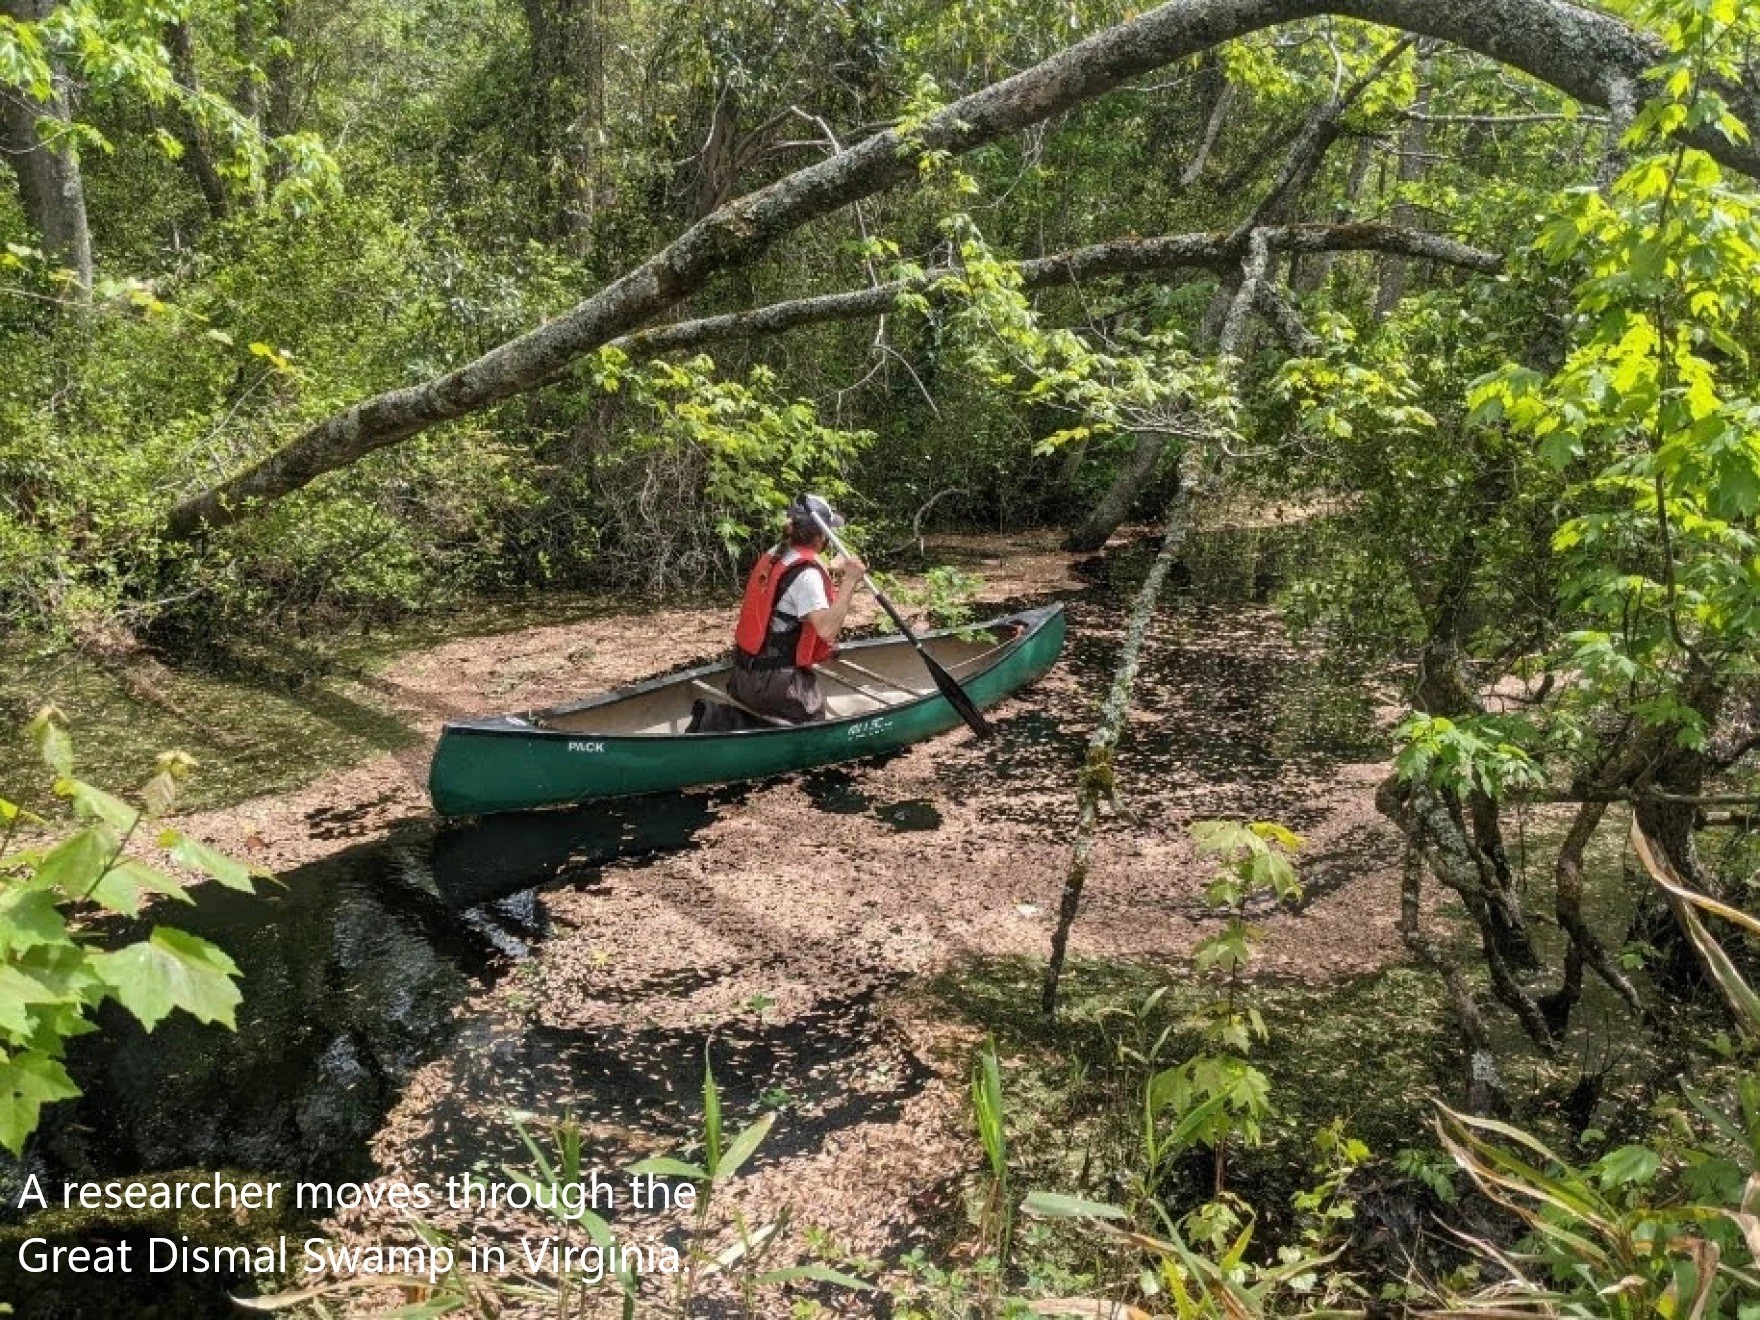
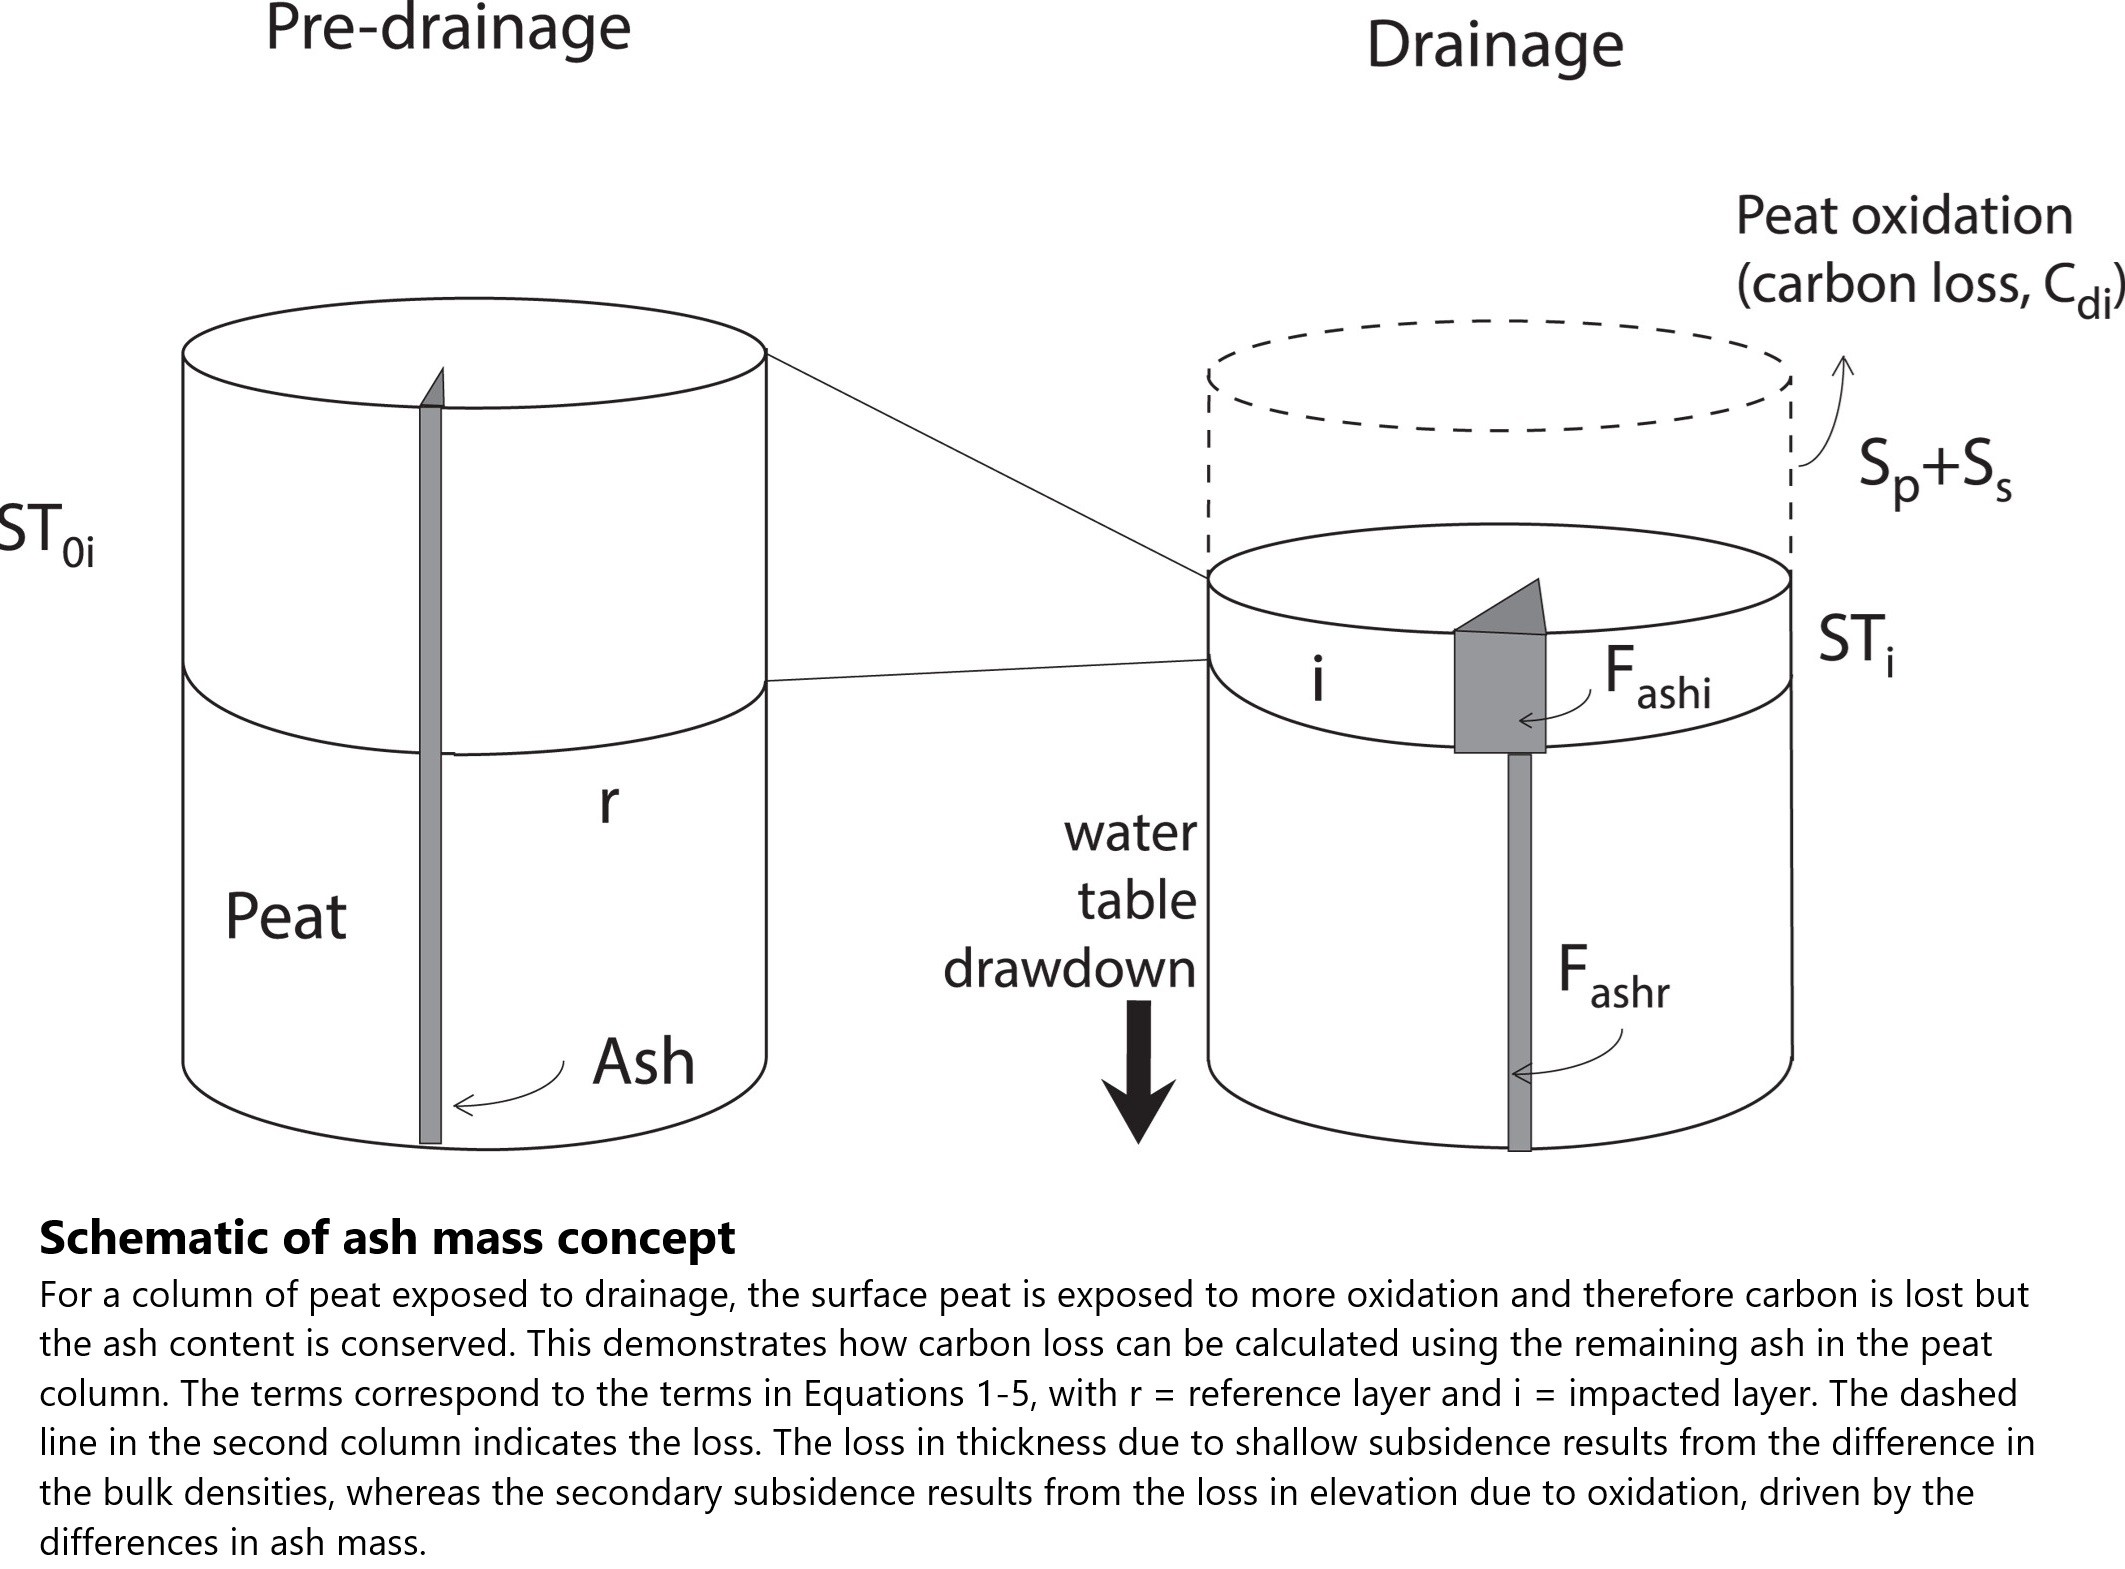
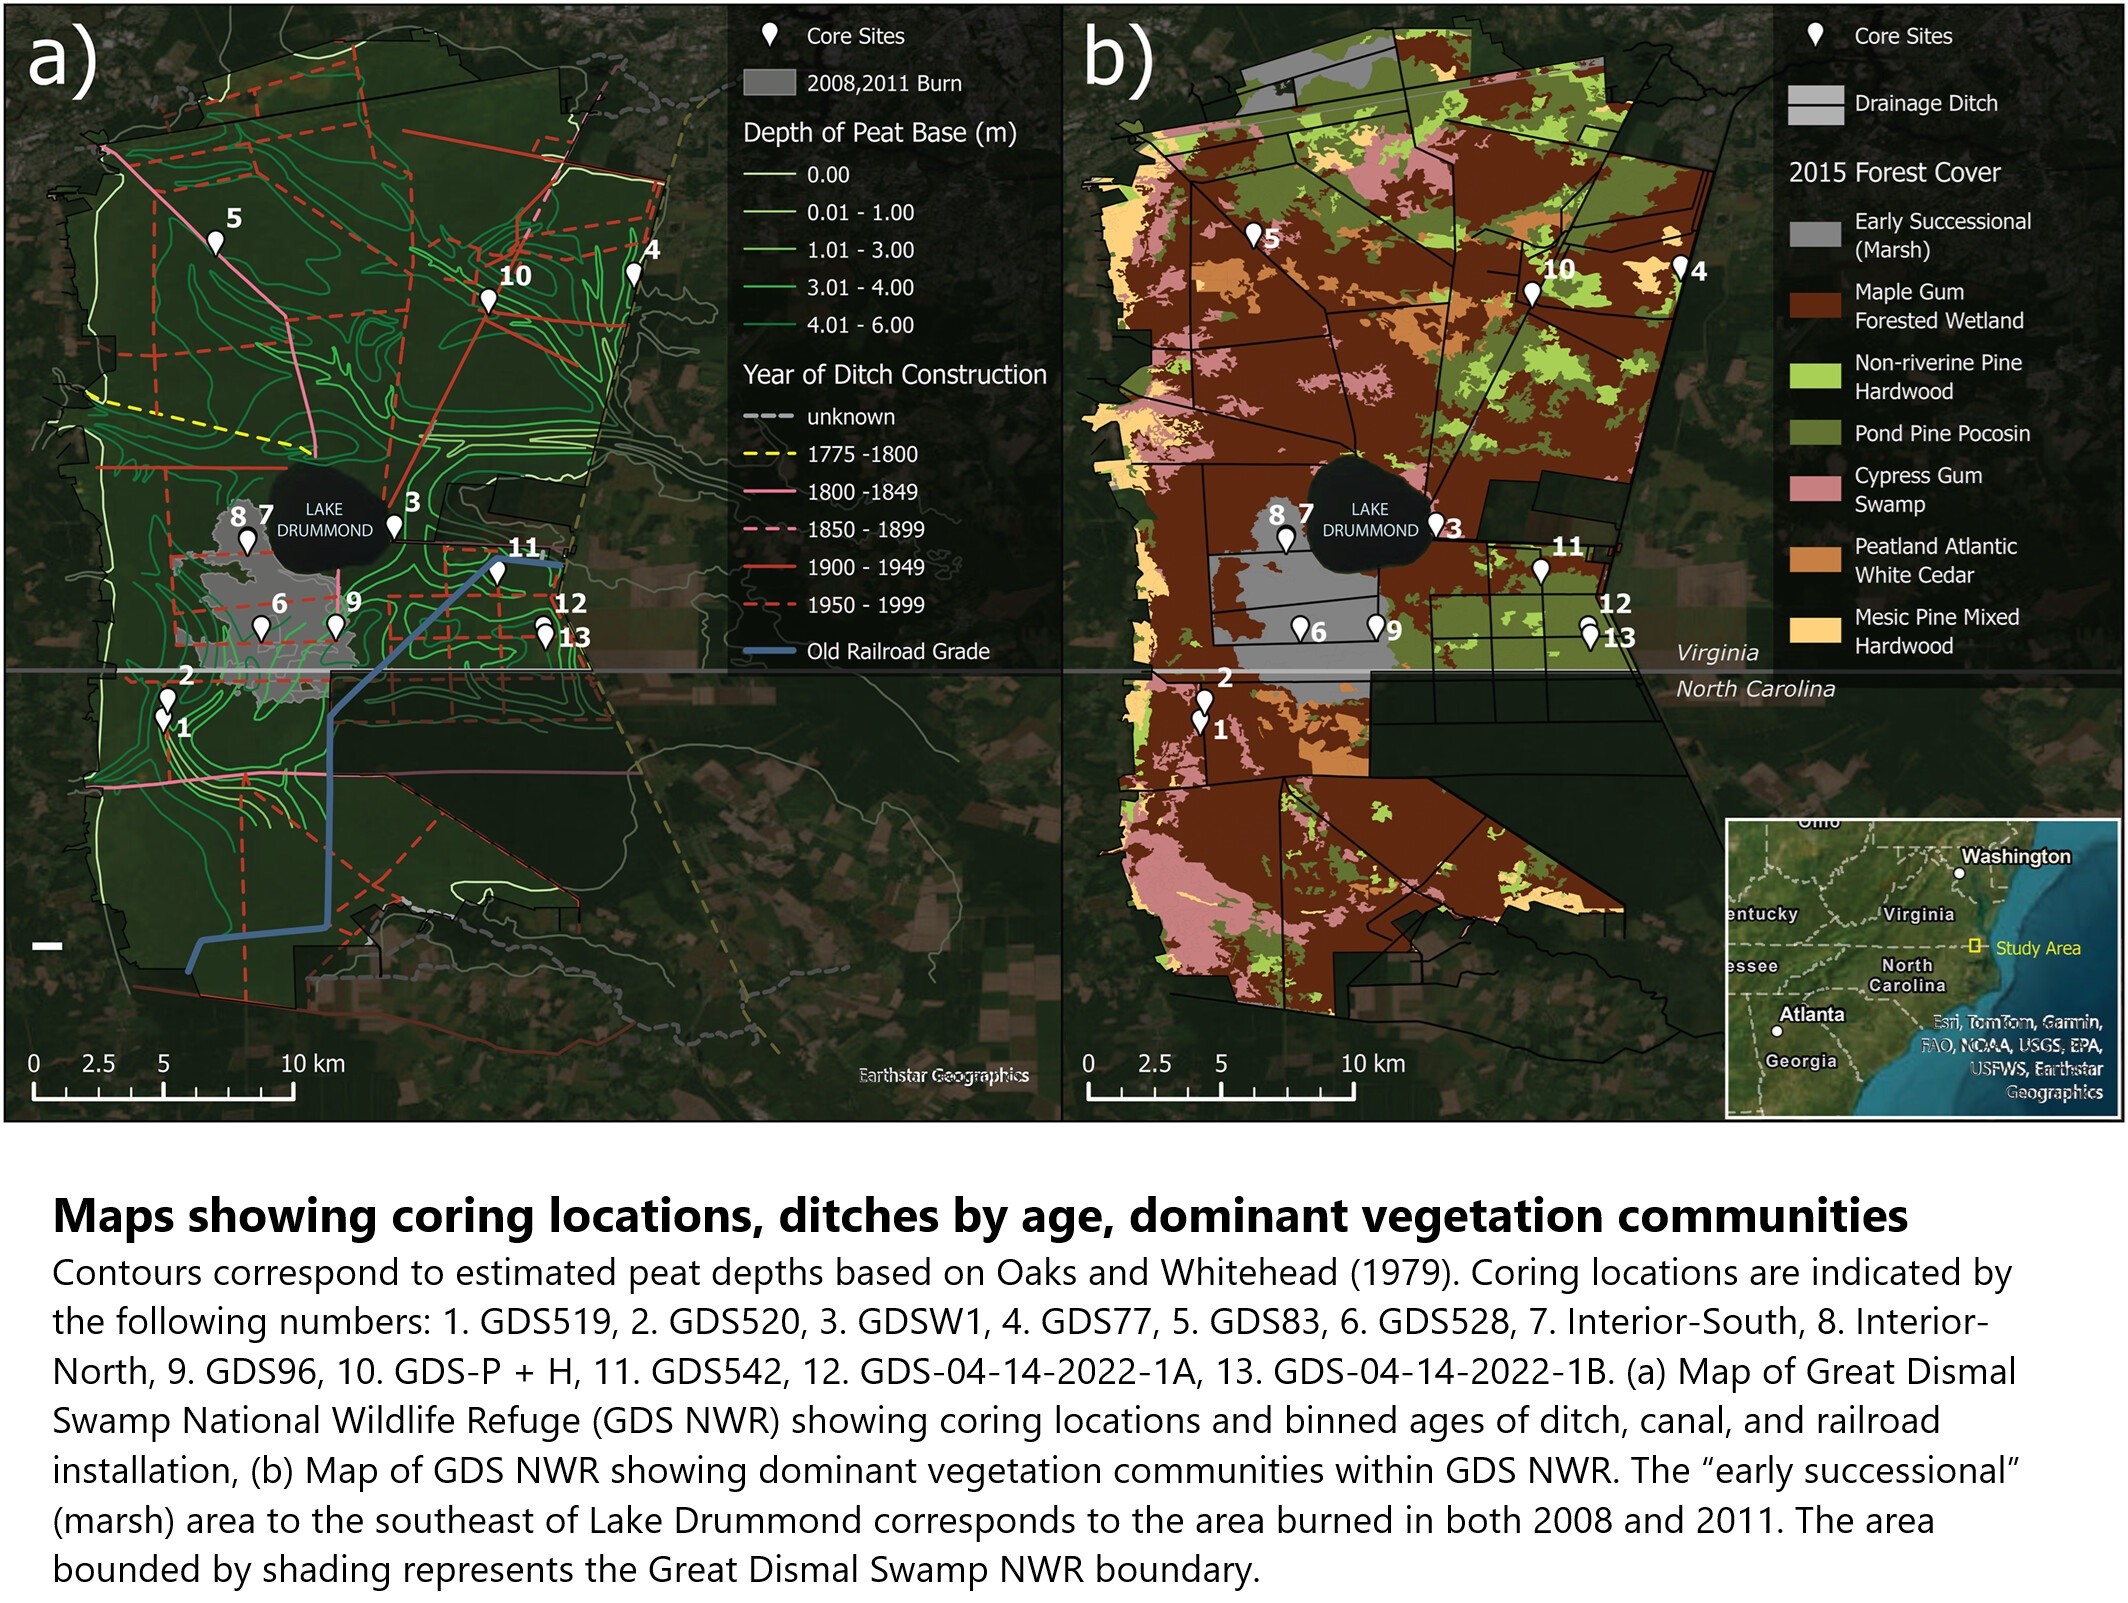
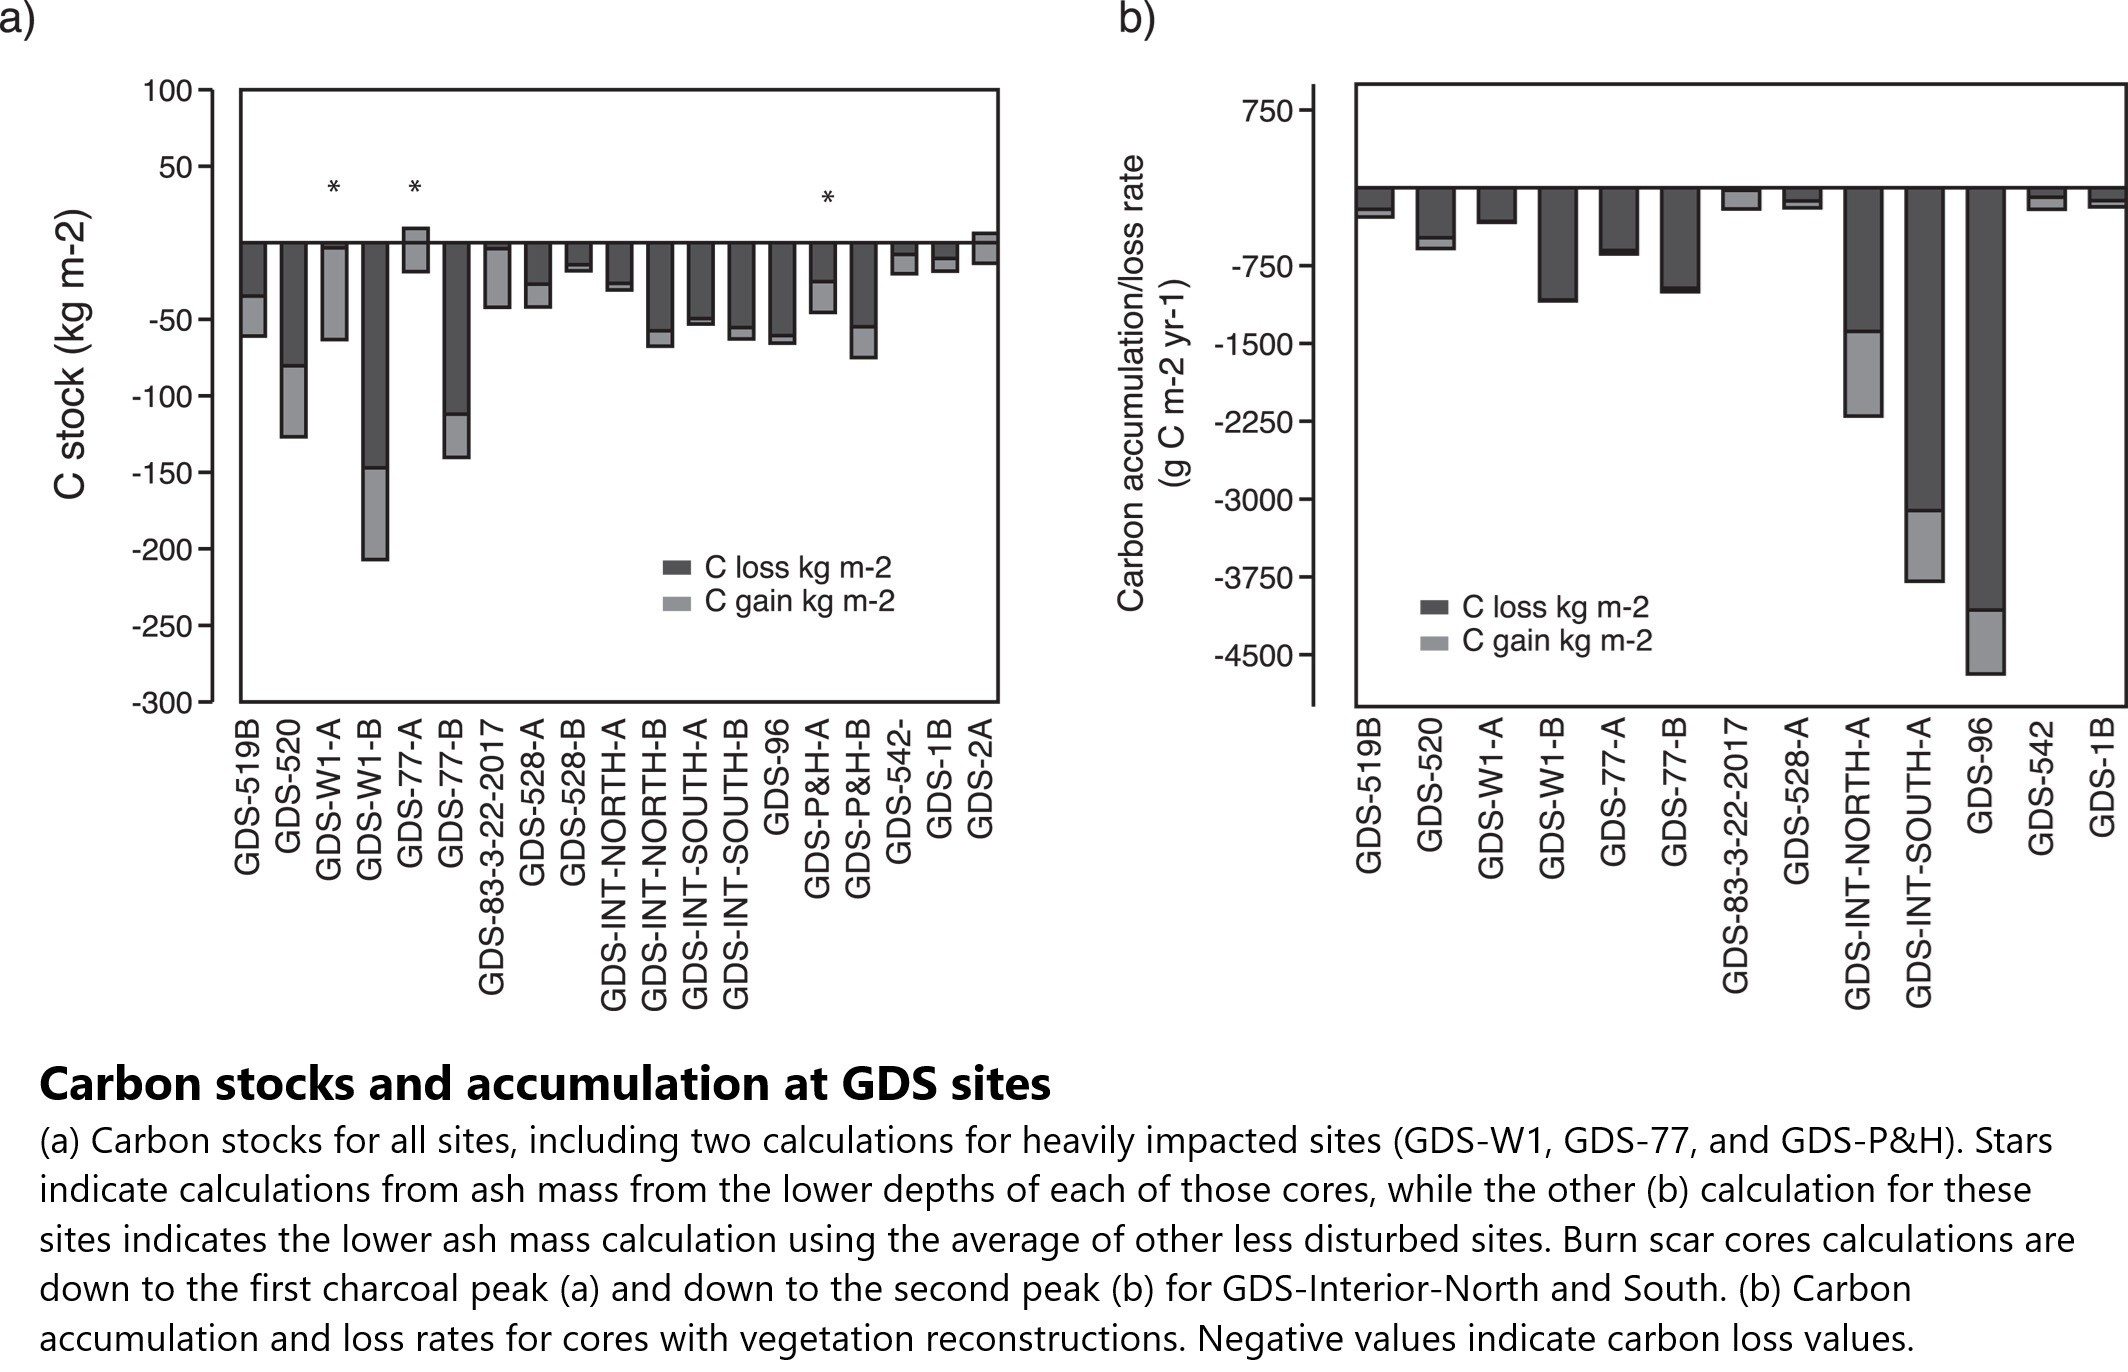
The Great Dismal Swamp Has Released Millions Of Tons Of Carbon Since The Colonial Era, Research Finds
--
https://www.whro.org/environment/2024-11-08/the-great-dismal-swamp-has-released-millions-of-tons-of-carbon-since-the-colonial-era-research-finds <-- shared article
--
https://doi.org/10.1029/2024JG008137 <-- shared paper
--
#GIS #spatial #mapping #climatechange #GreatDismalSwamp #carbon #NorthCarolina #Virginia #USA #engineering #water #hydrology #swamp #habitat #biodiversity #humanimpacts #carbondioxide #landuse #change #wetlands #peatlands #carbonsink #methane #model #spatialanalysis #spatiotemporal #research #peat #peatswamp #drainage #ditches #engineering #reclamation #peatfire #mitigation #ecosystem #carbonloss #hydrospatial
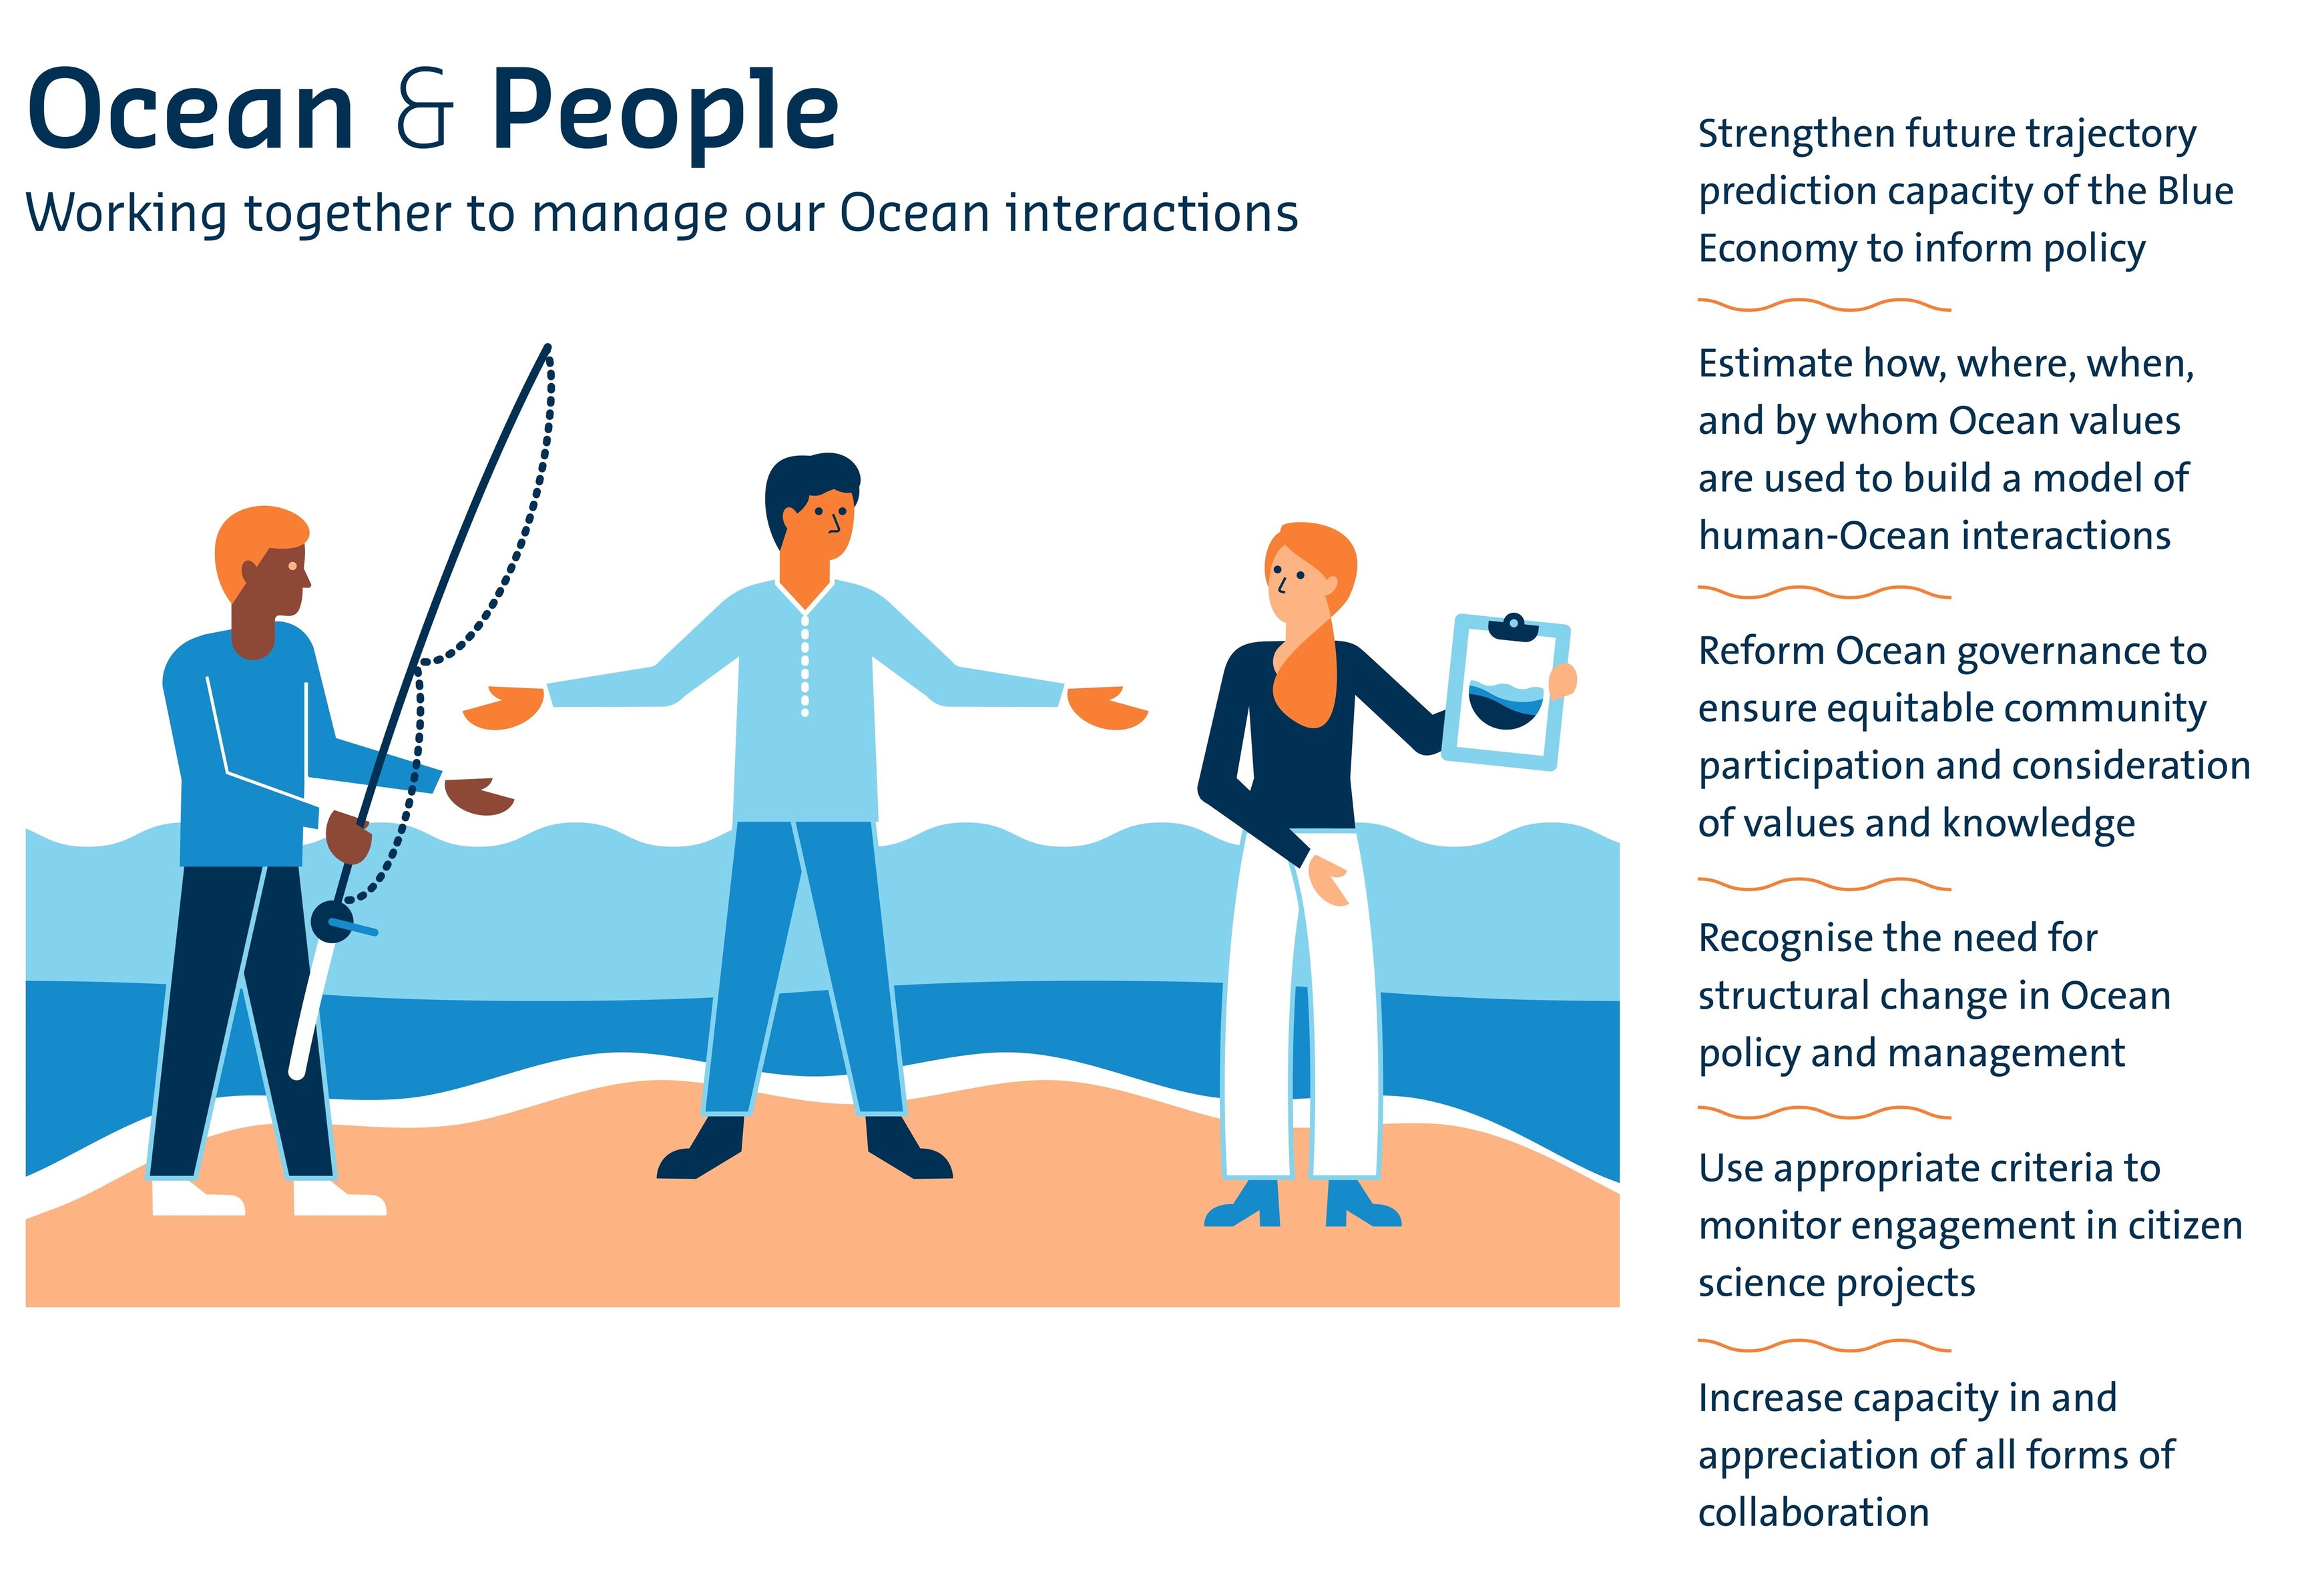
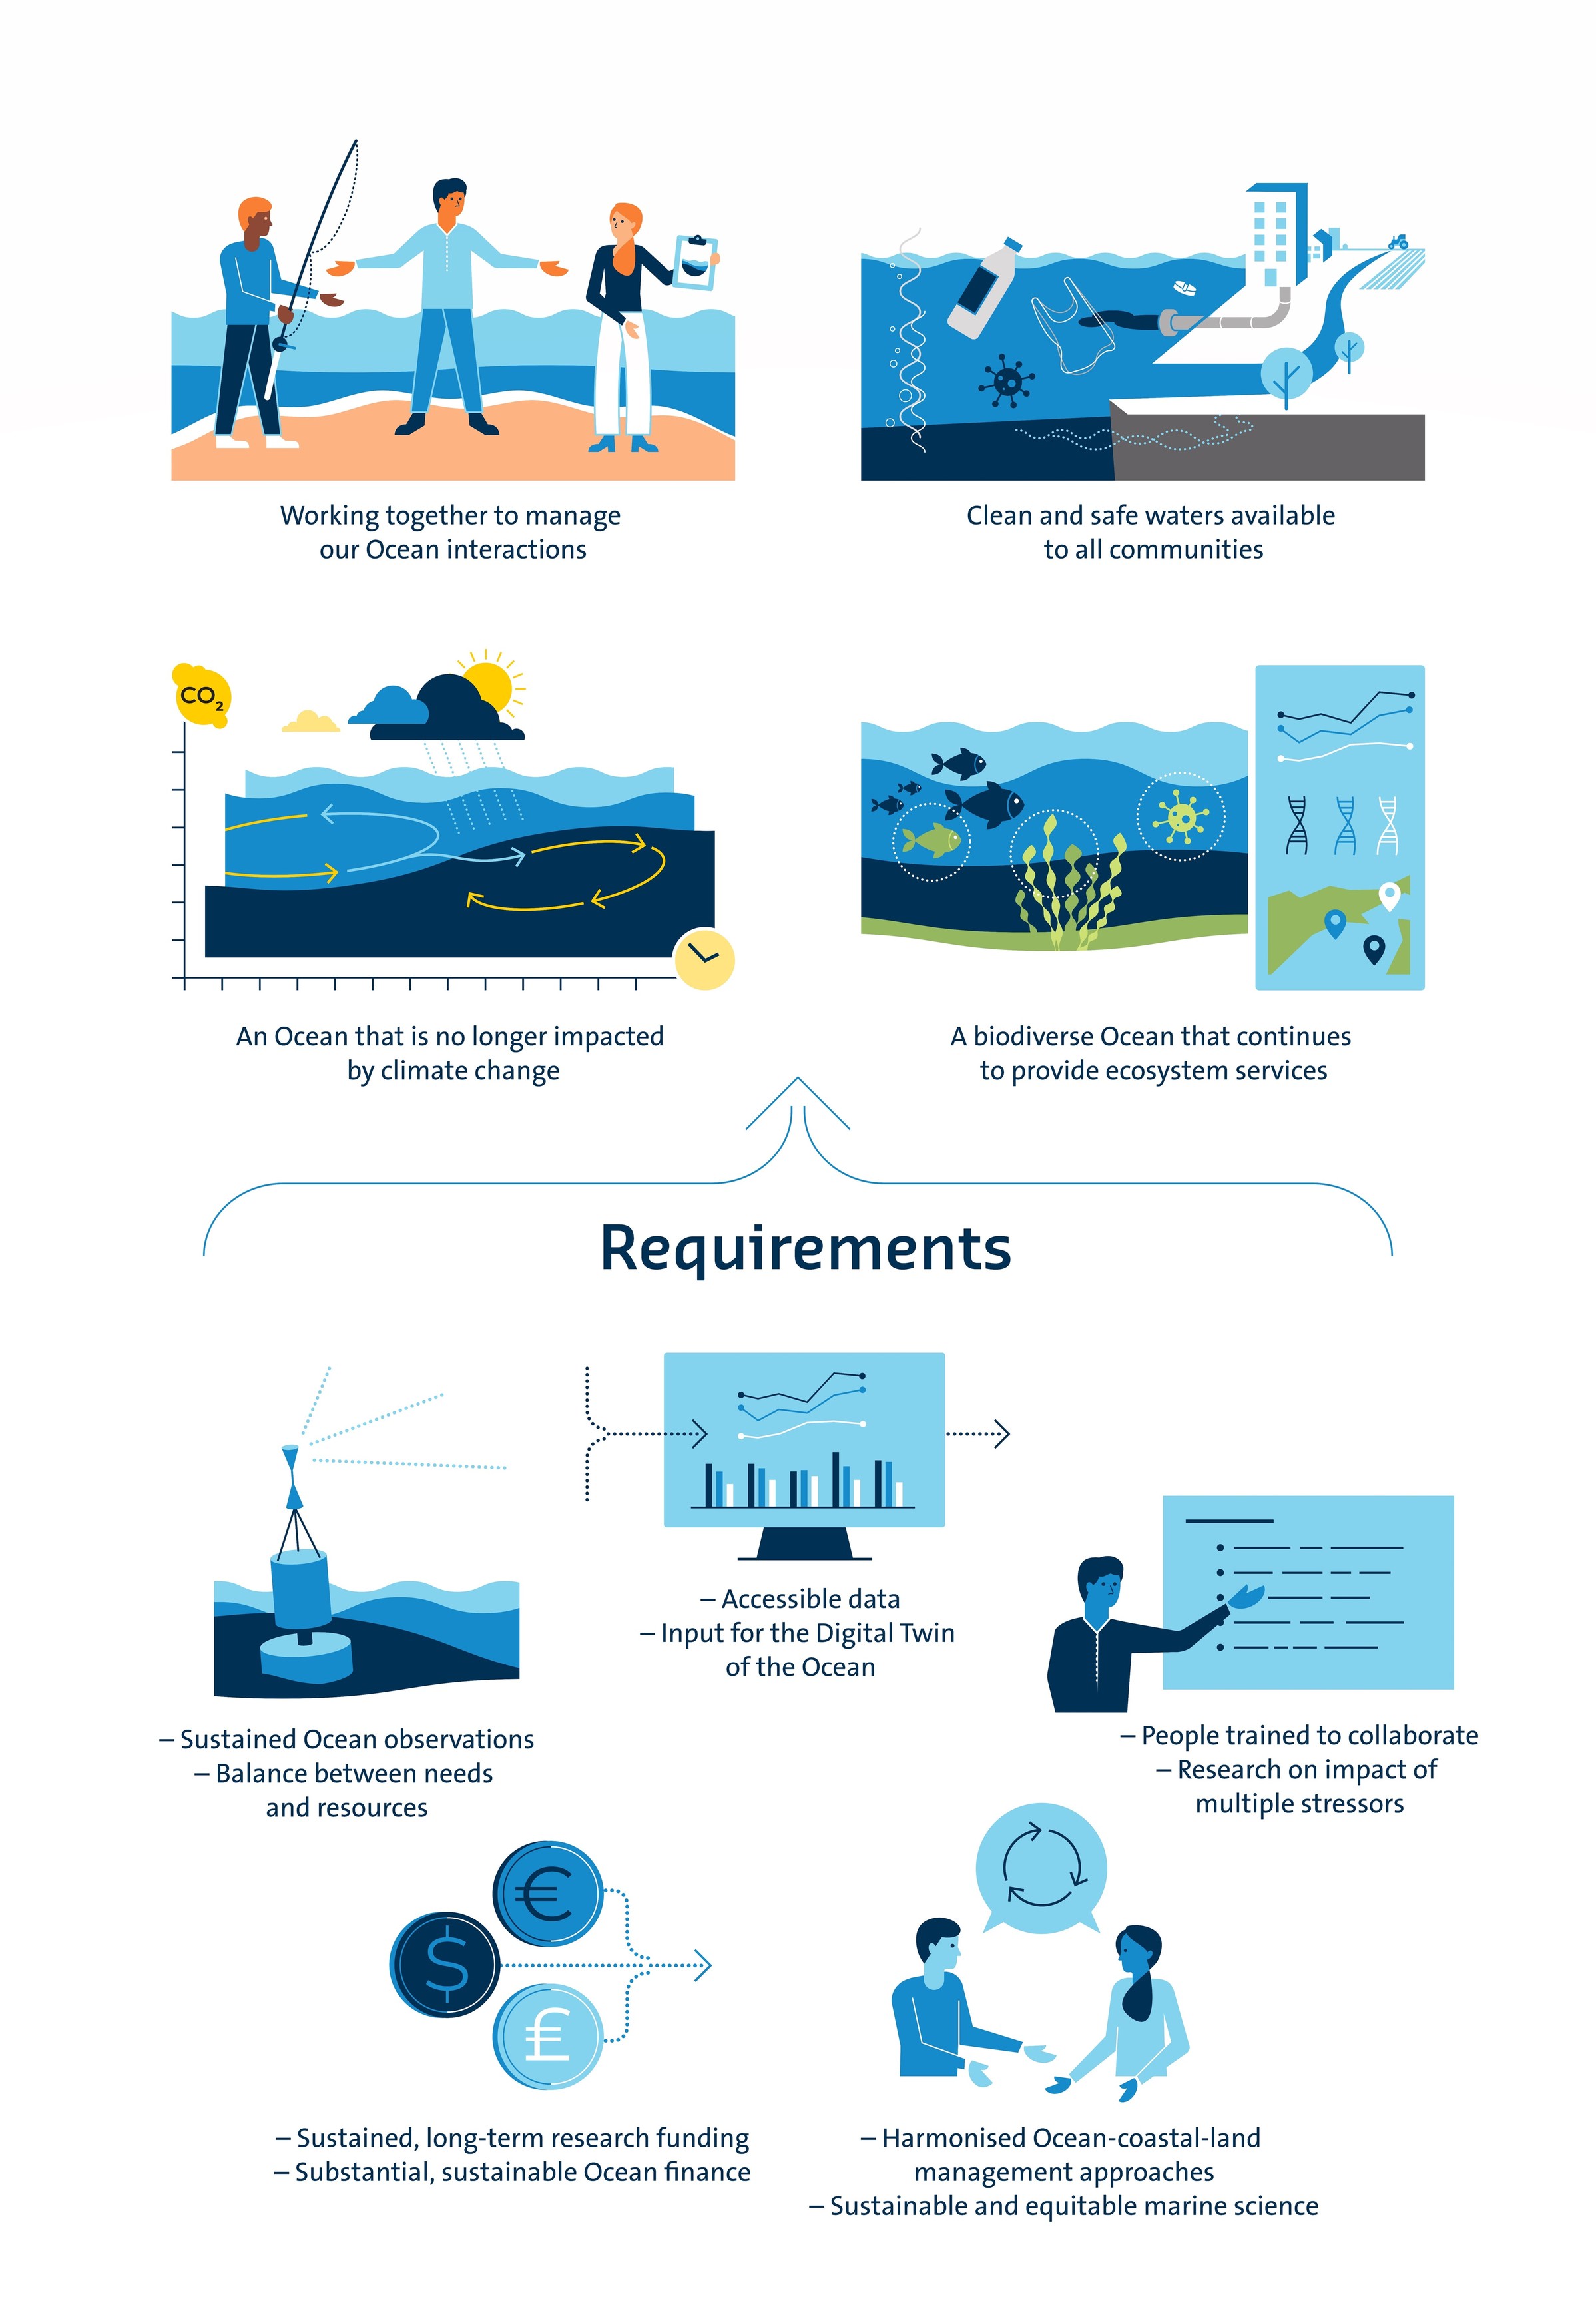
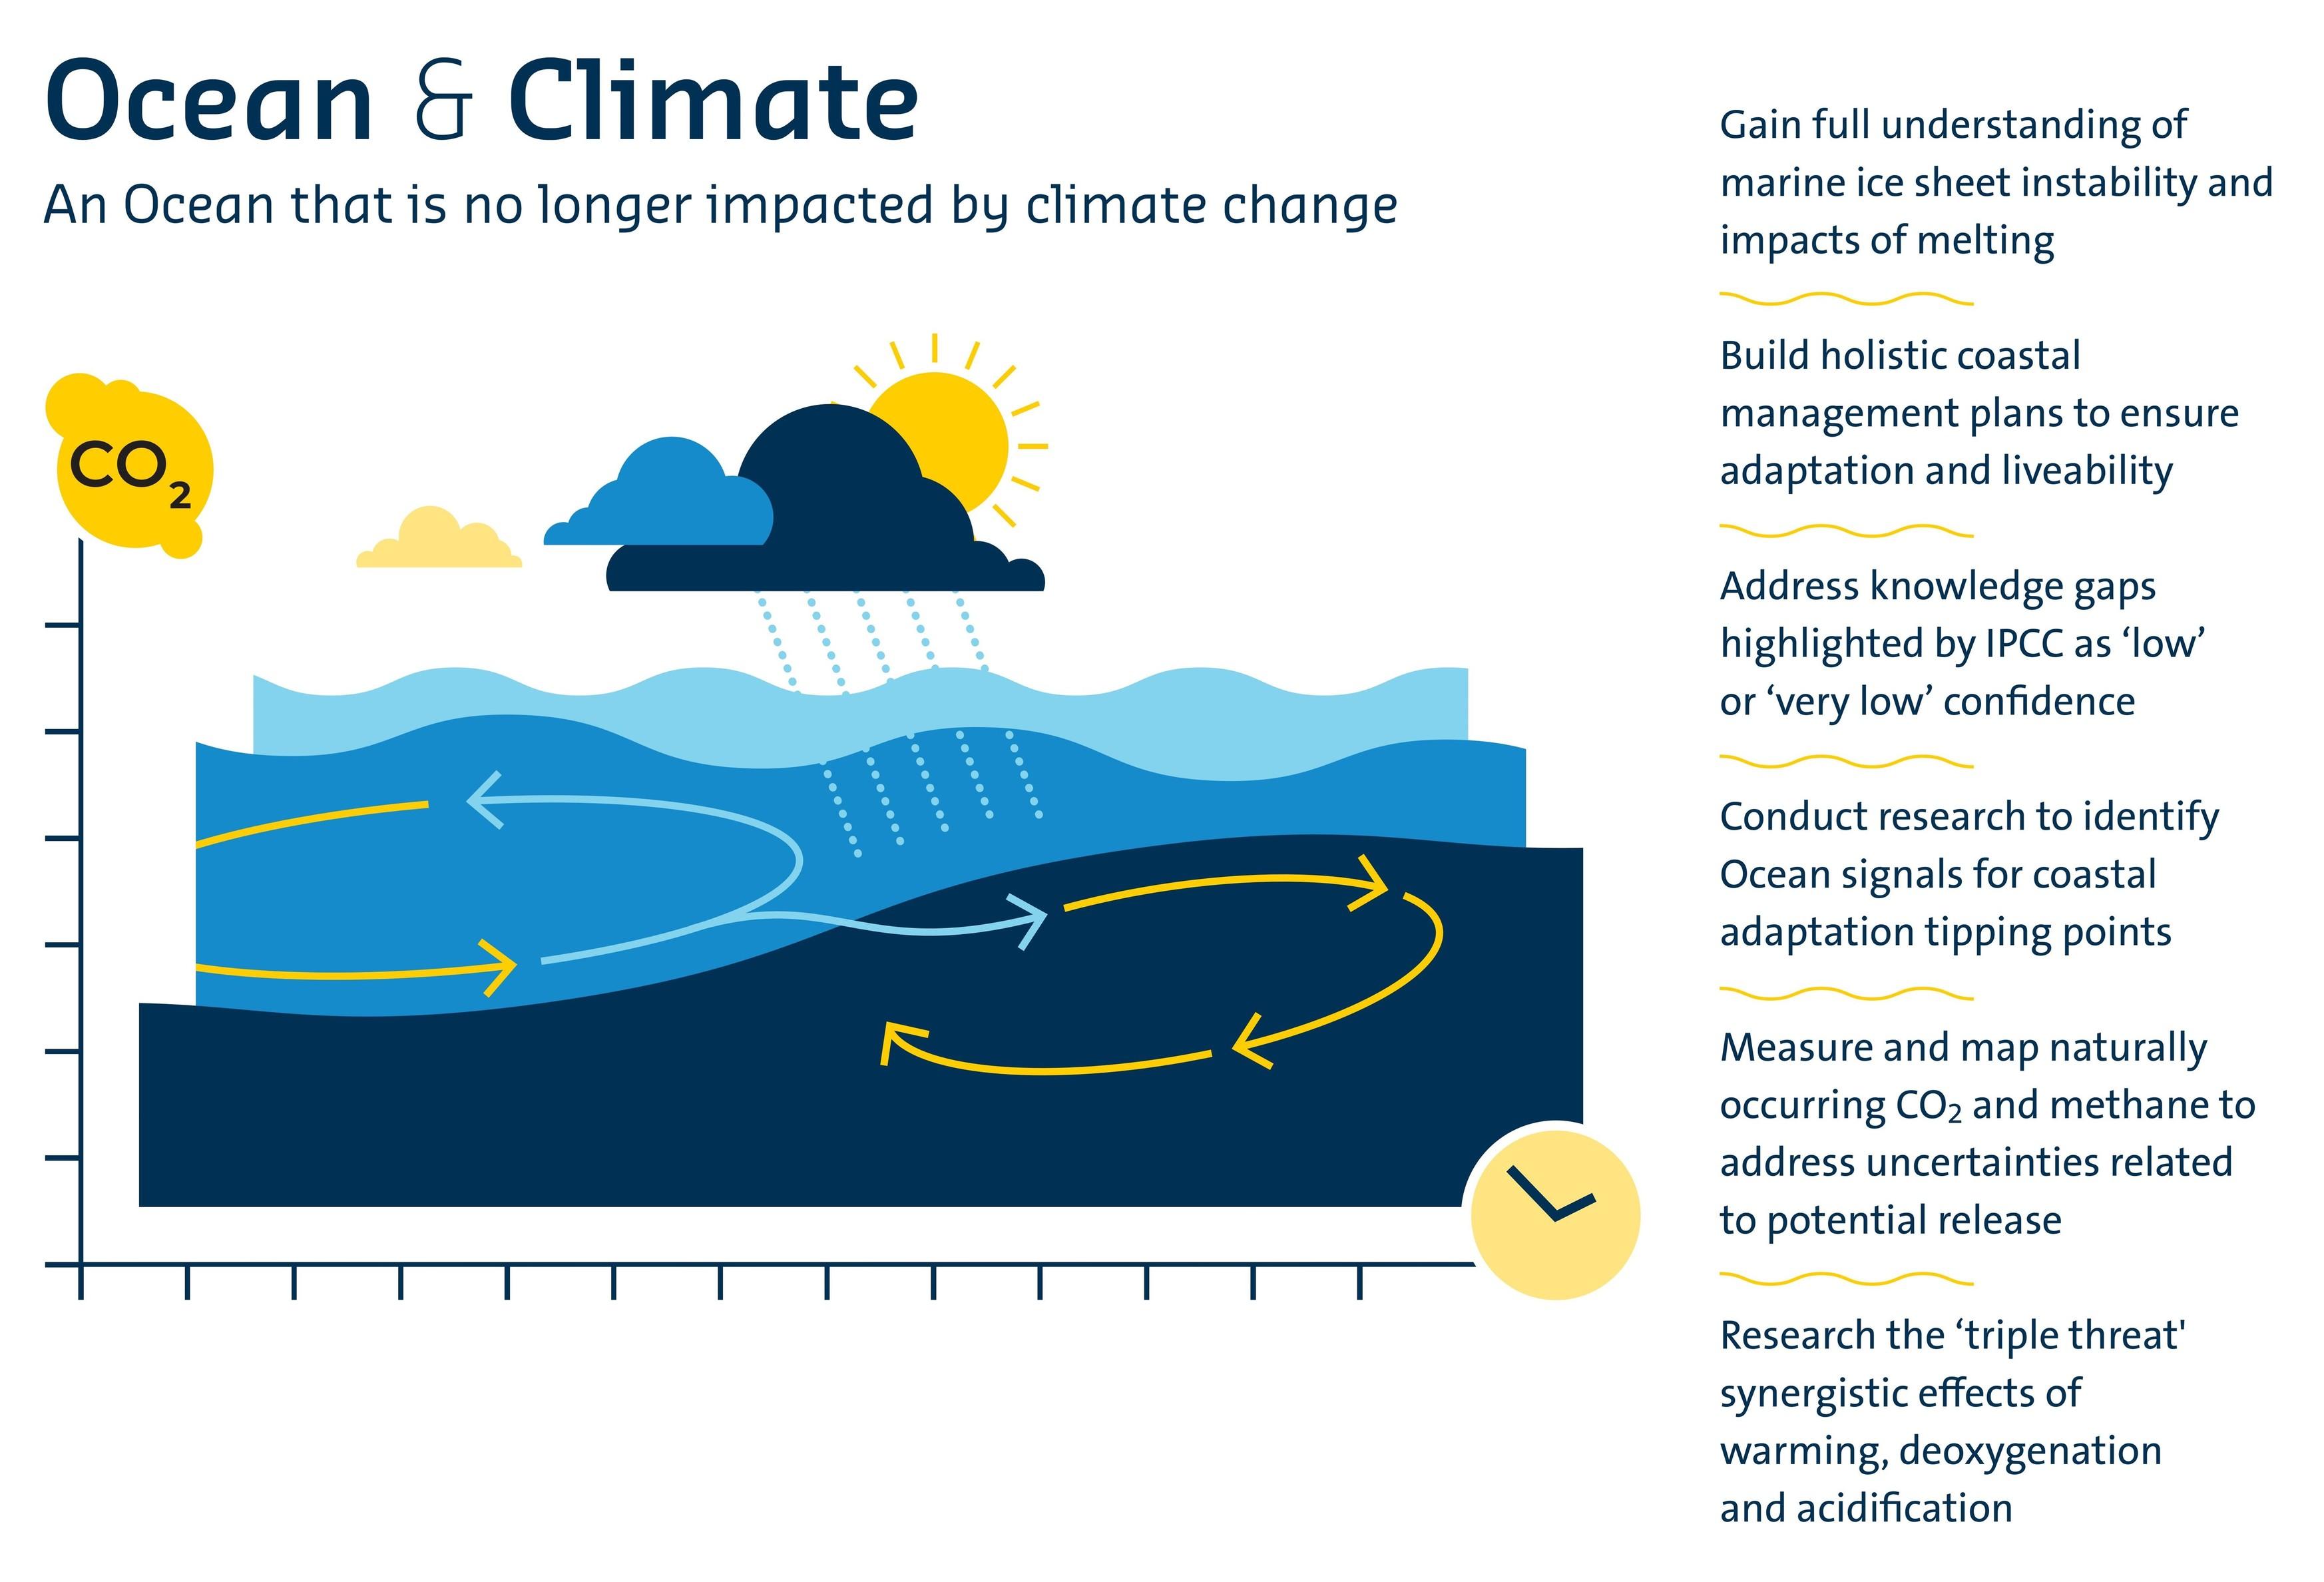
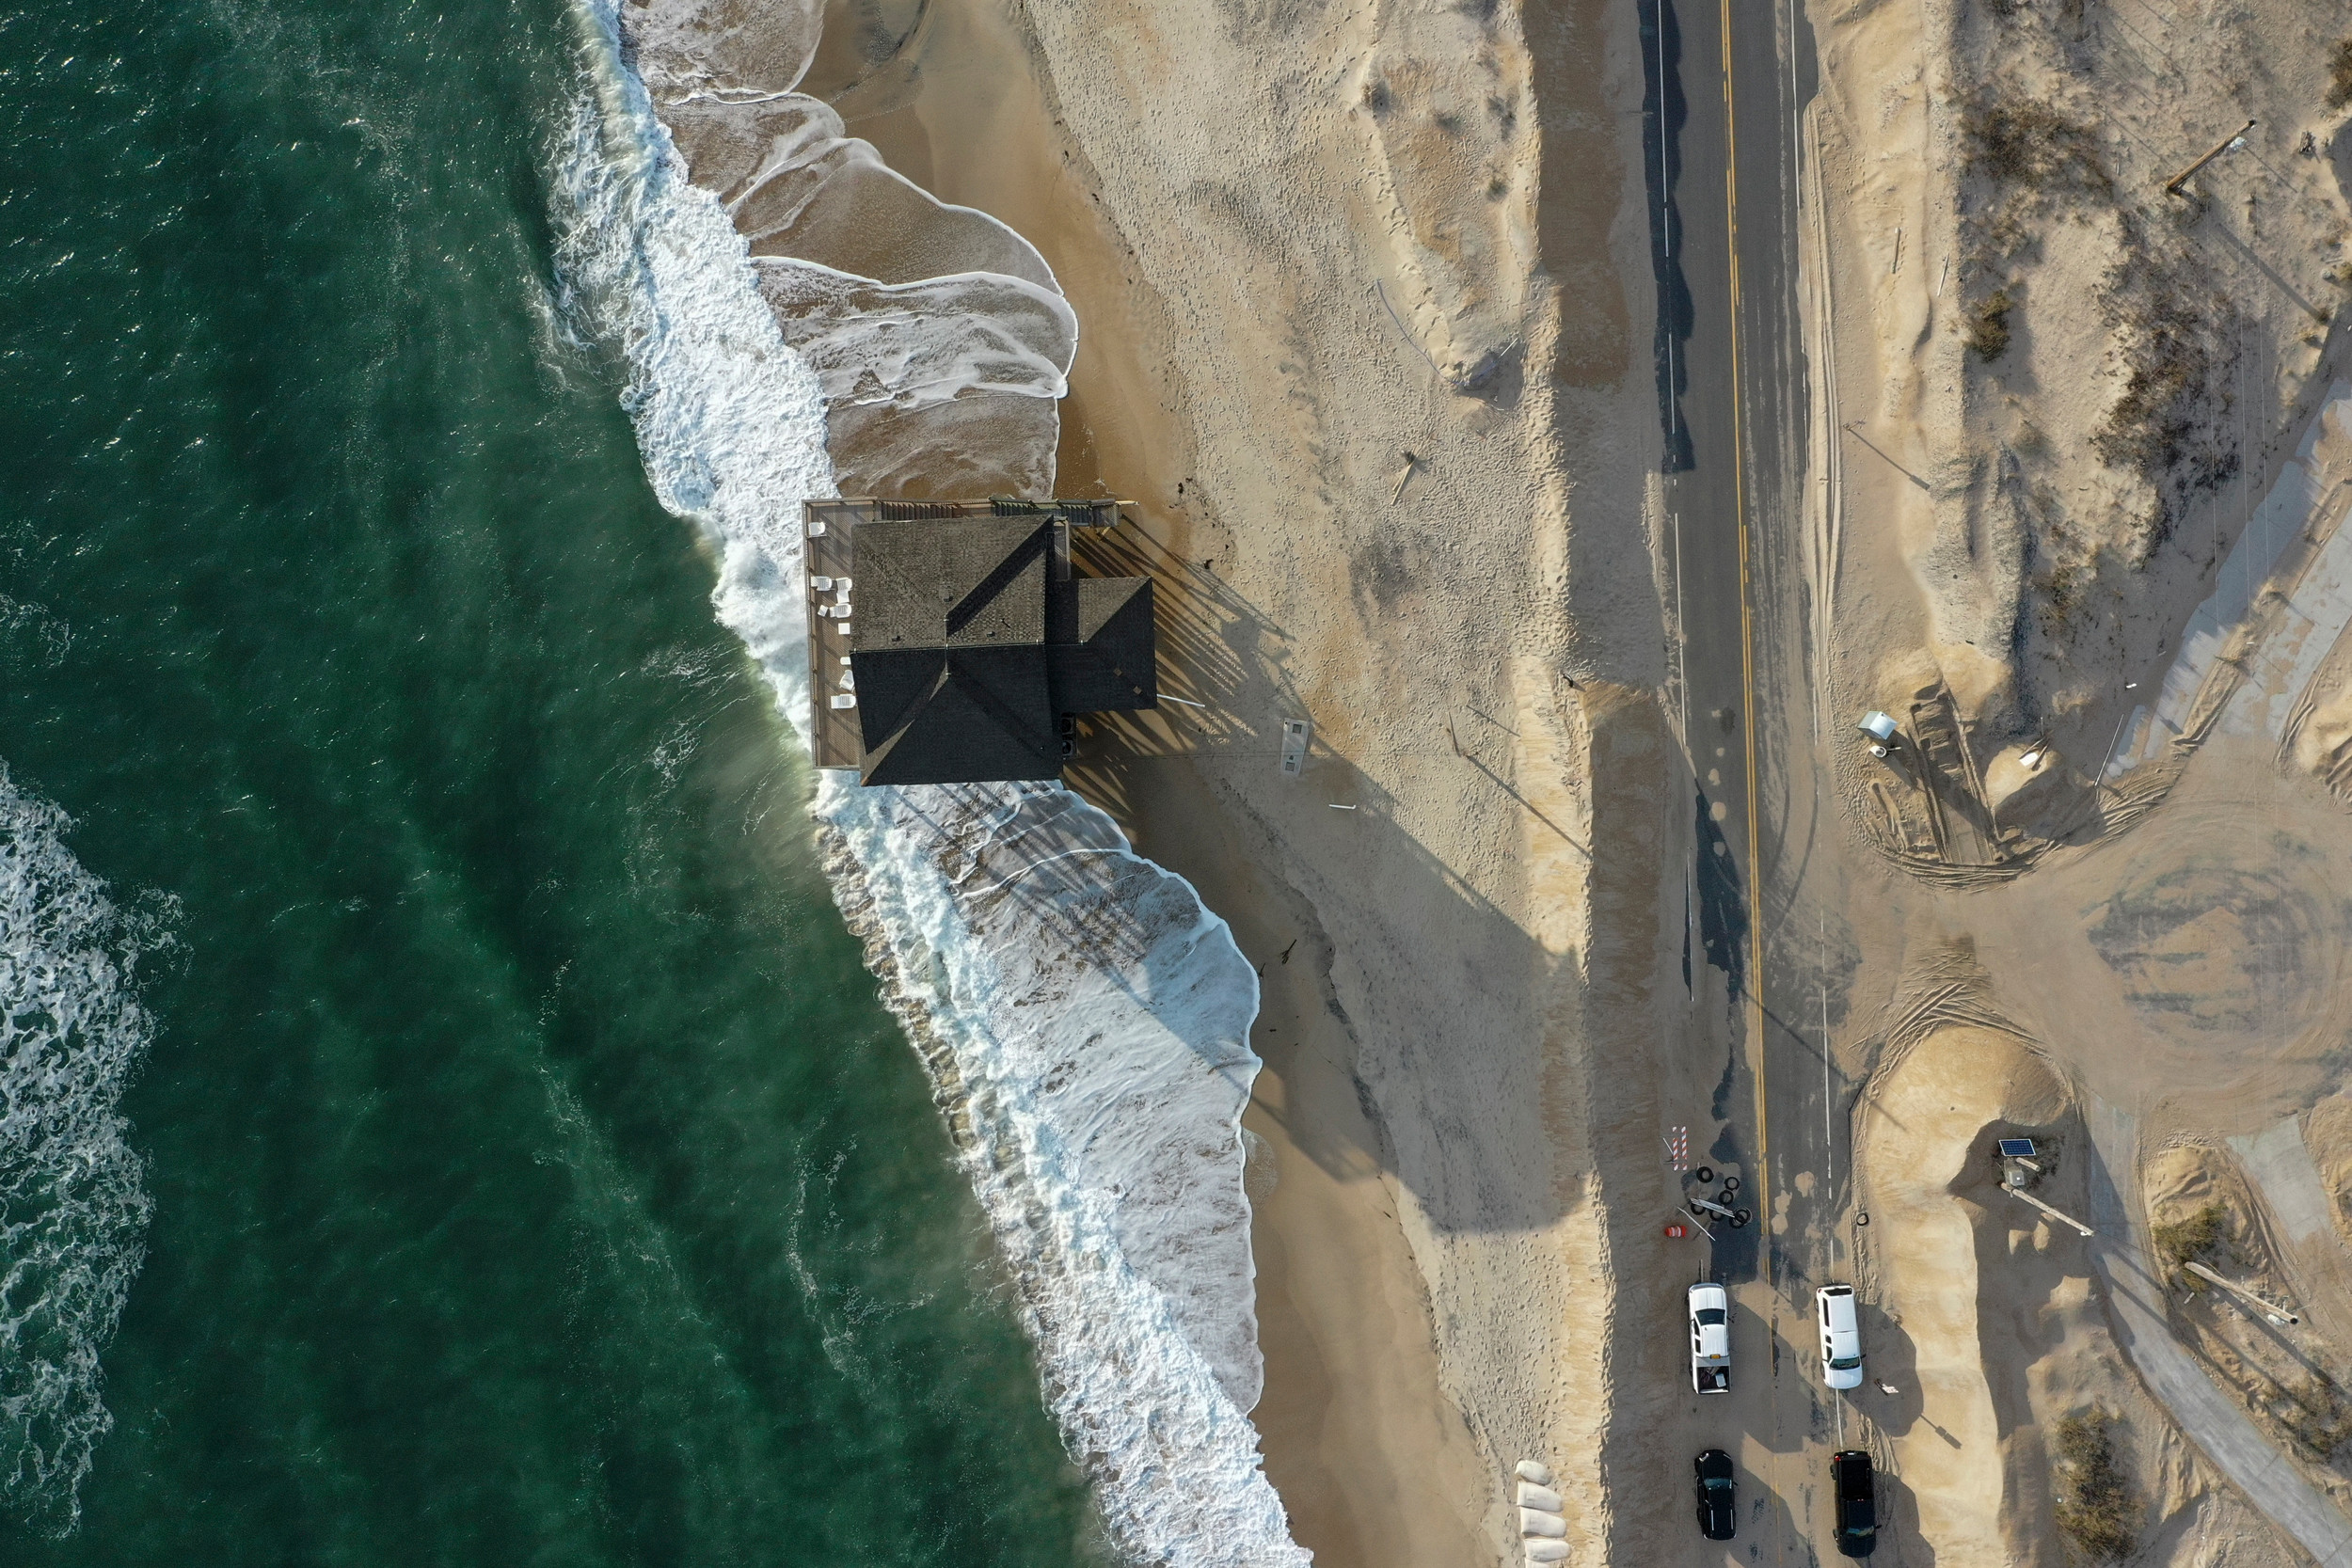
Will We Be Able To Continue Living By The Sea? Ocean Experts Explore Considerations For Governments
--
https://phys.org/news/2024-11-sea-ocean-experts-explore-considerations.html <-- shared technical article
--
https://www.marineboard.eu/navigating-future-vi <-- shared Navigating the Future VI – The Role Of The Ocean
--
#GIS #spatial #mapping #climate #climatechange #coast #coastal #model #modeling #sea #risk #hazard #ocean #sealevel #sealevelrise #planning #management #mitigation #COP29 #NFVI #watersecurity #foodsecurity #publichealth #publicsafety #weather #extremeweather #subsidence #stormsurge #hydrospatial #coastalcommunities
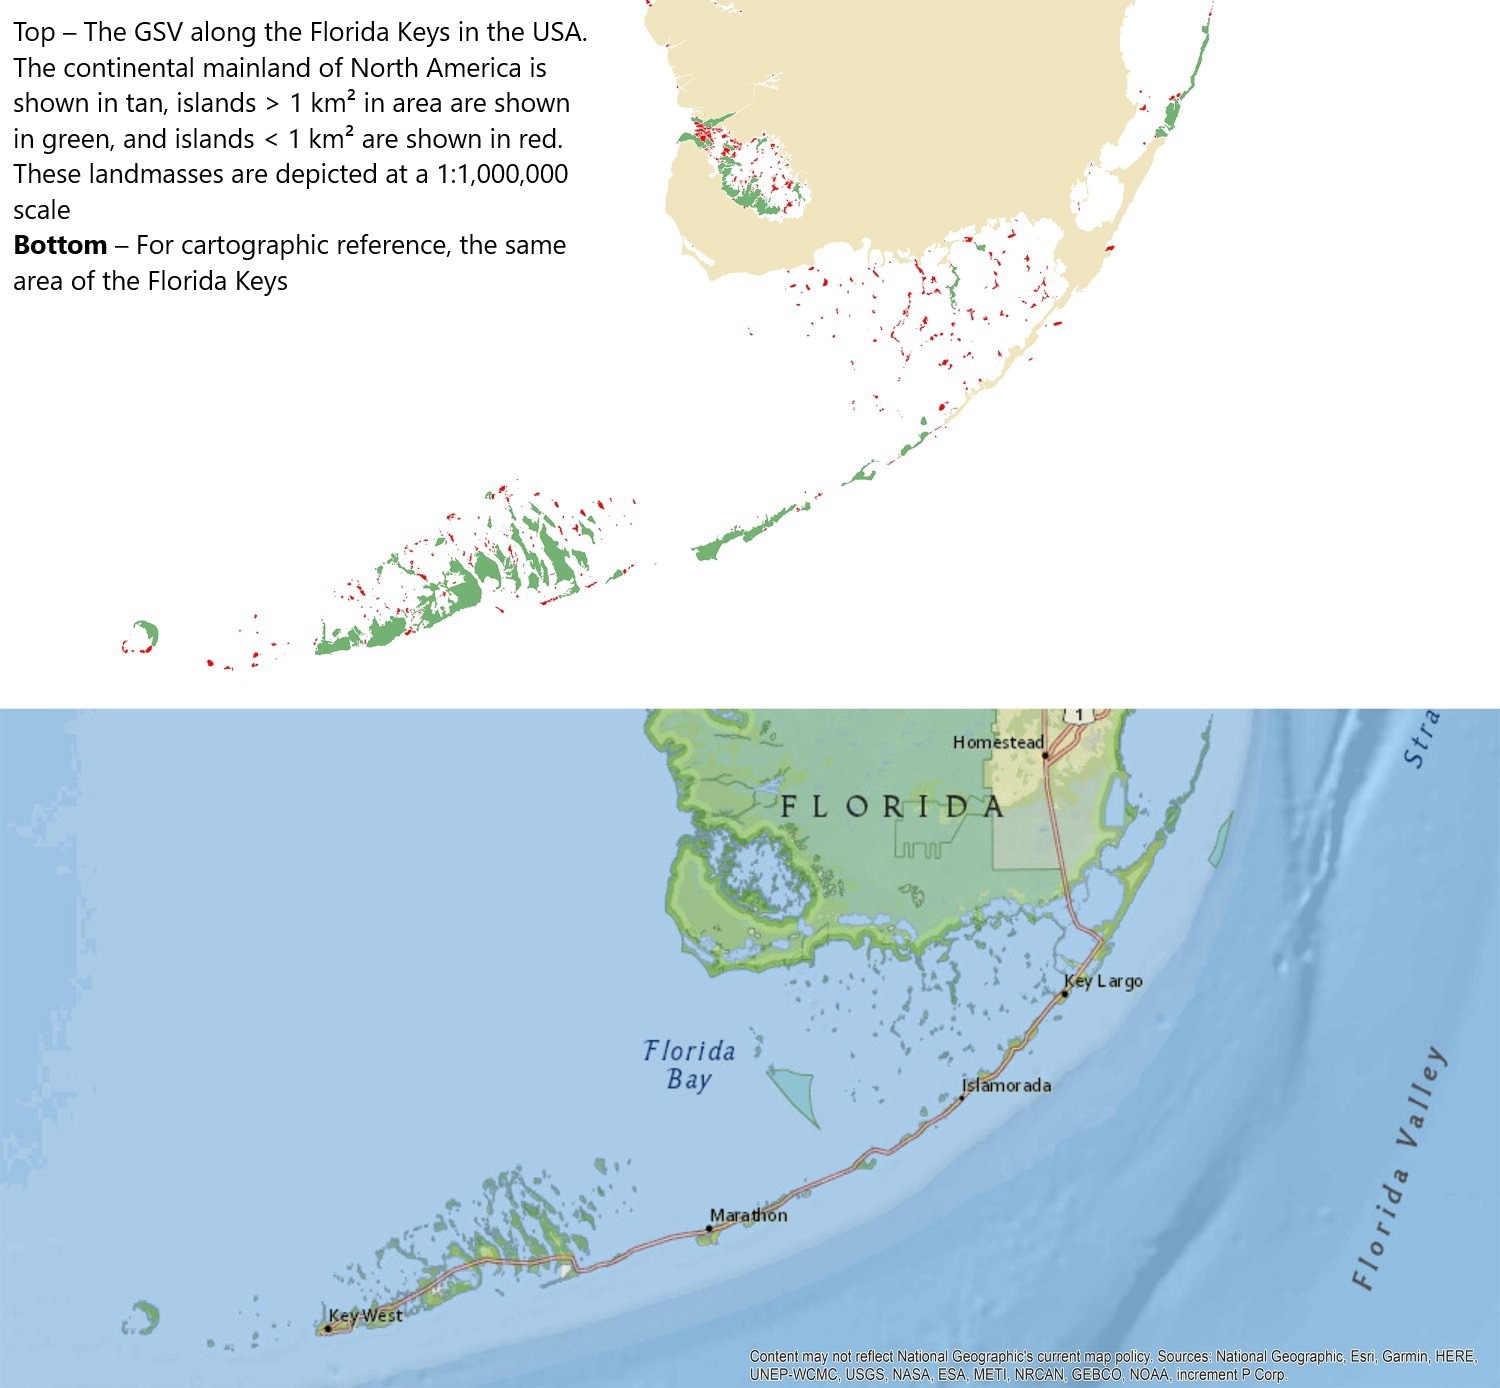
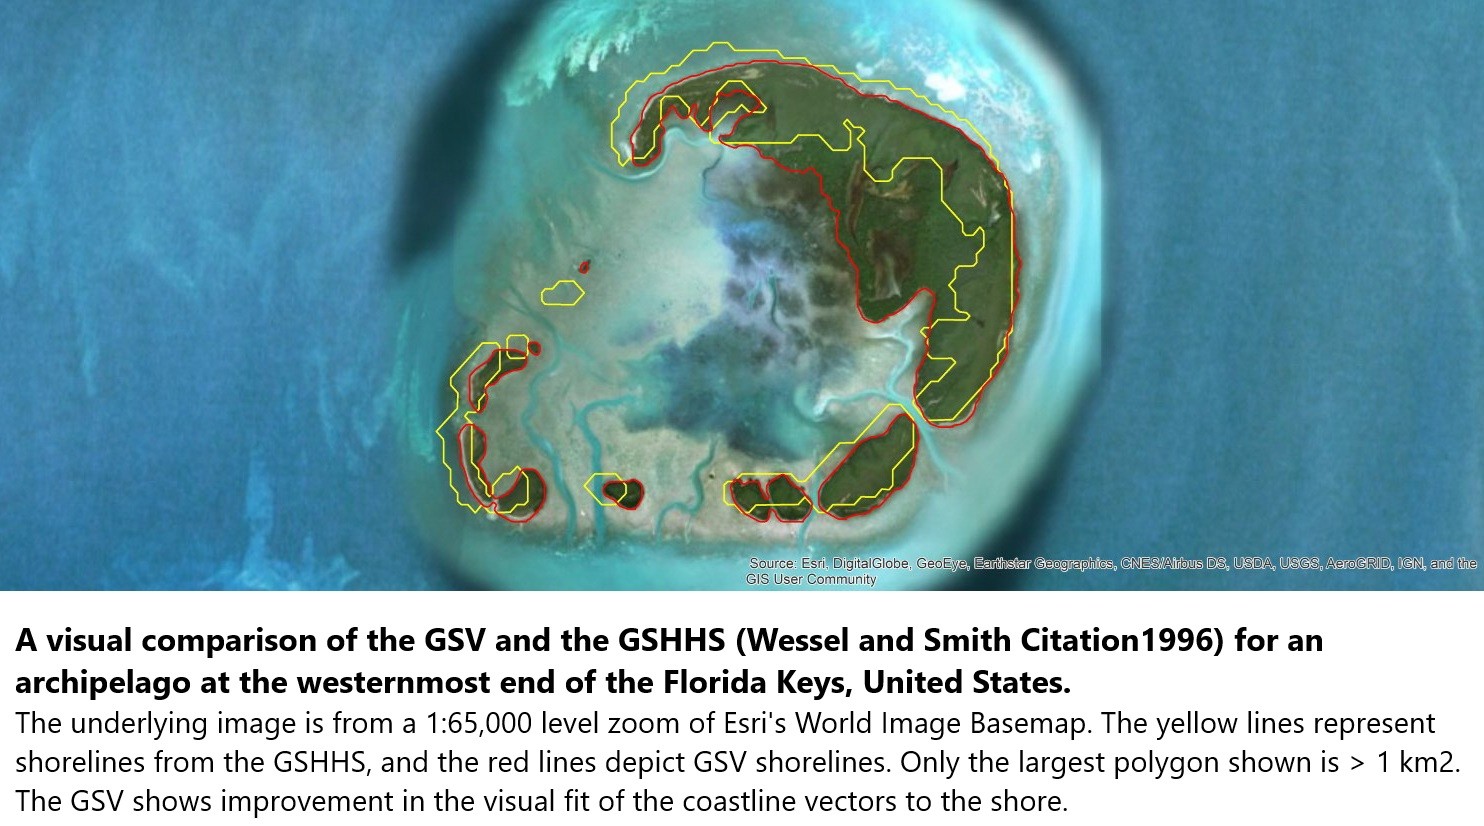
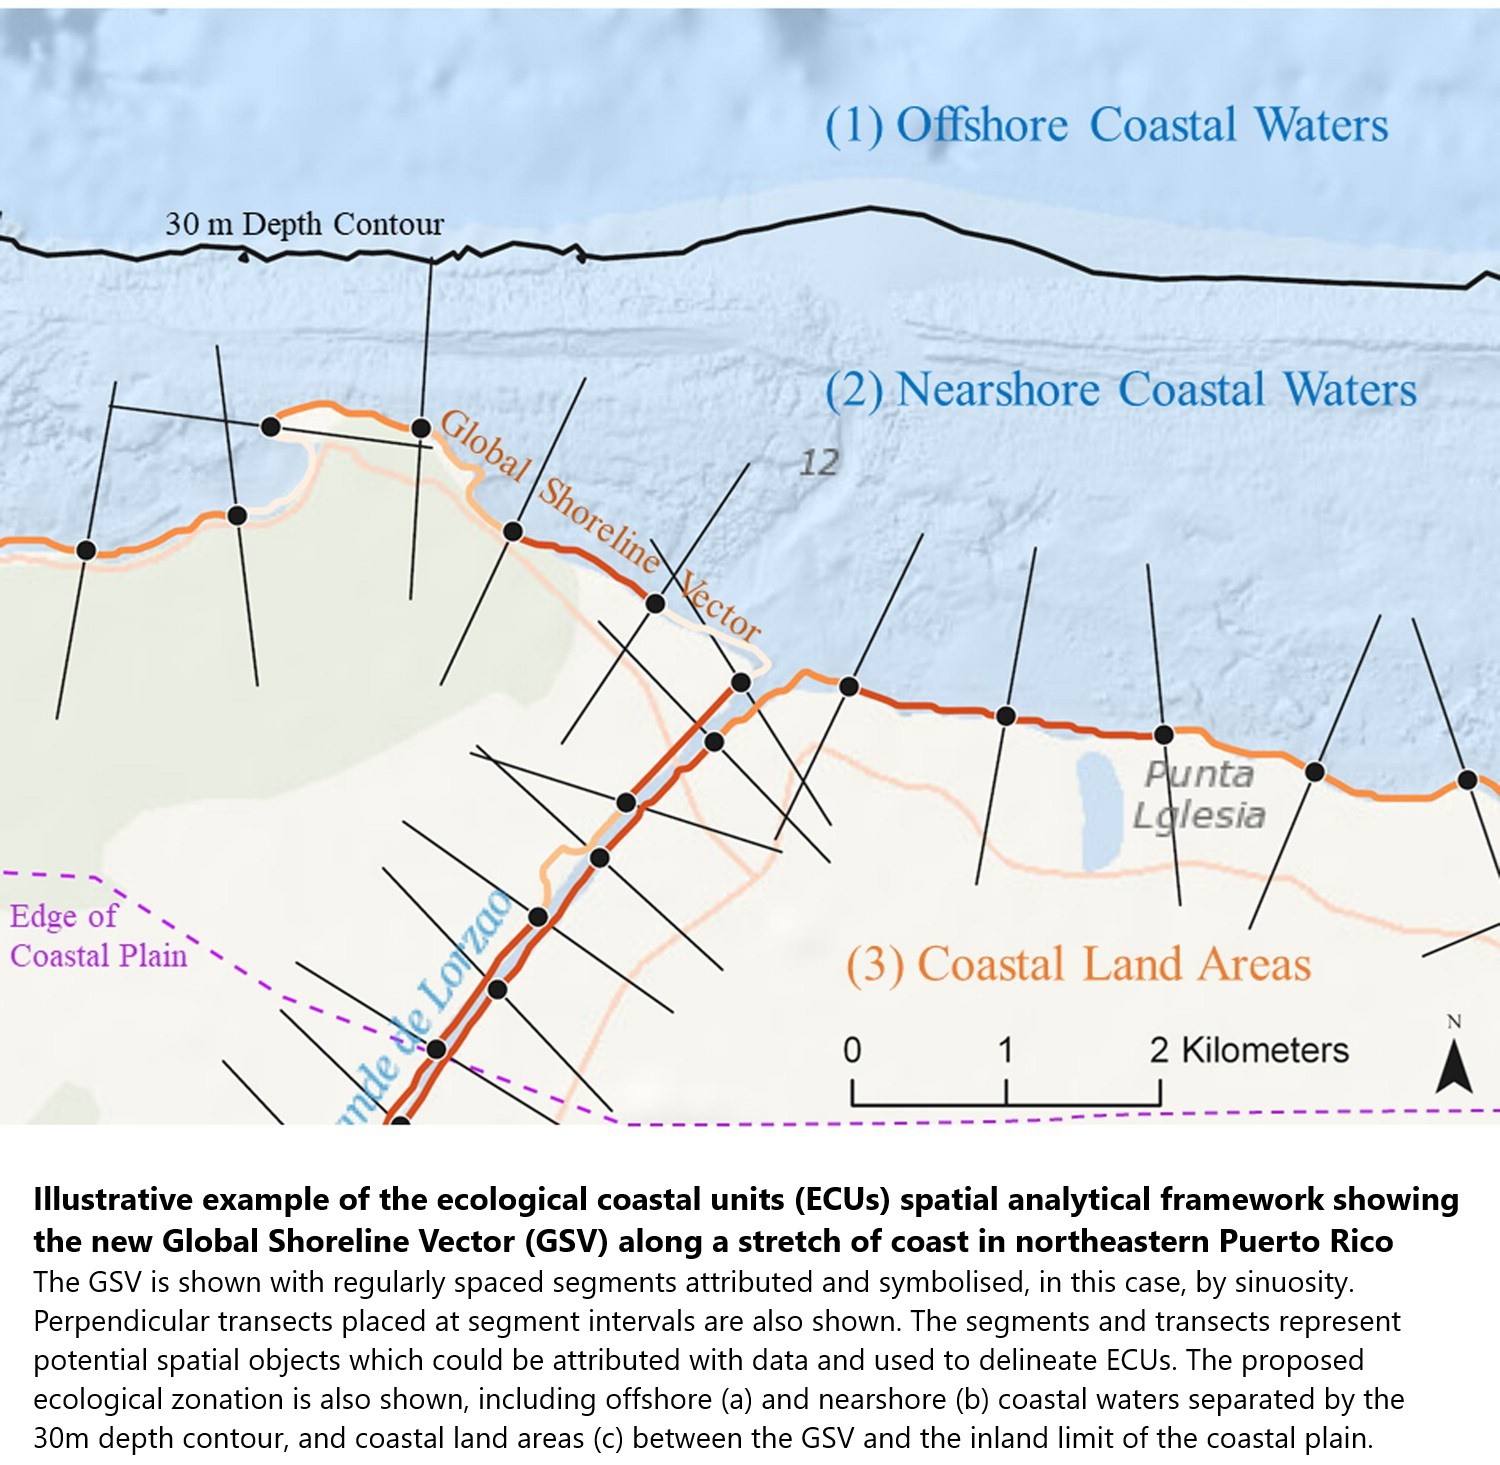
New [2018] 30 Metre Resolution Global Shoreline Vector And Associated Global Islands Database For The Development Of Standardized Ecological Coastal Units
--
https://doi.org/10.1080/1755876X.2018.1529714 <-- shared 2018 paper
--
#GIS #spatial #mapping #coast #coastline #global #shoreline #landsat #remotesensing #spatialanalysis #extraction #AI #machinelearning #GSV #GSHSS #ecology #terrestrial #marine #ECU #waters #GEO #GoogleEarthEngine #MBON #BluePlanet #water #hydrography #hydrospatial #GroupOnEarthObservations
@GroupOnEarthObservations #islands @GEOSEC2025

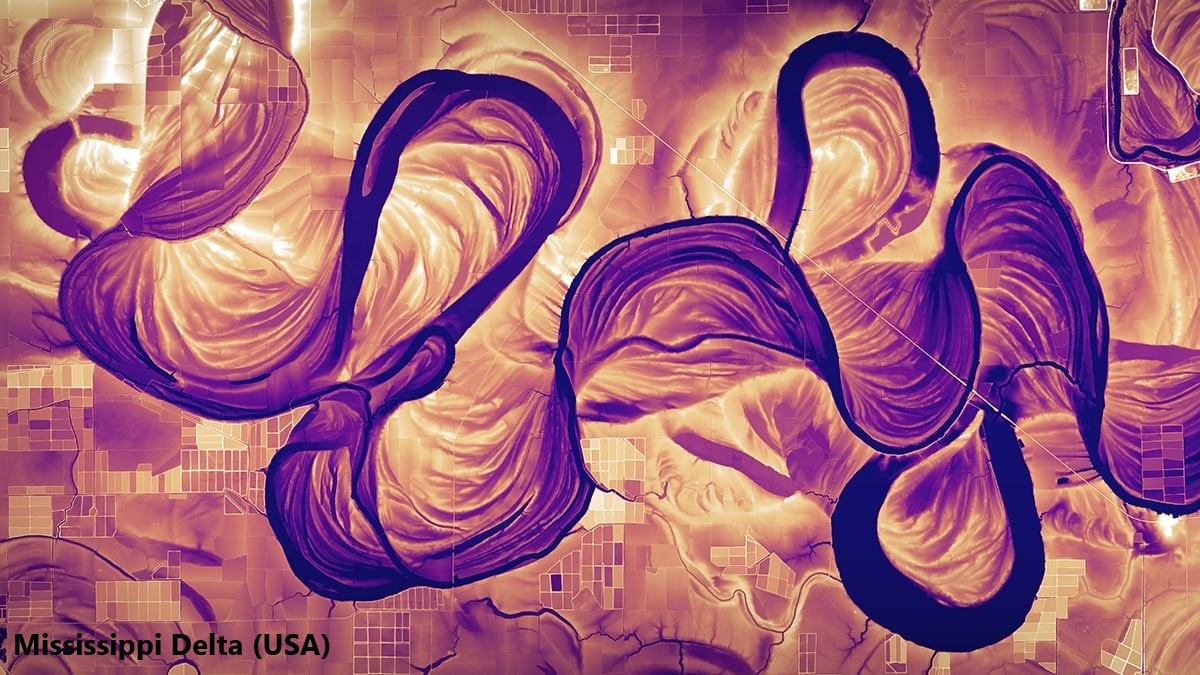
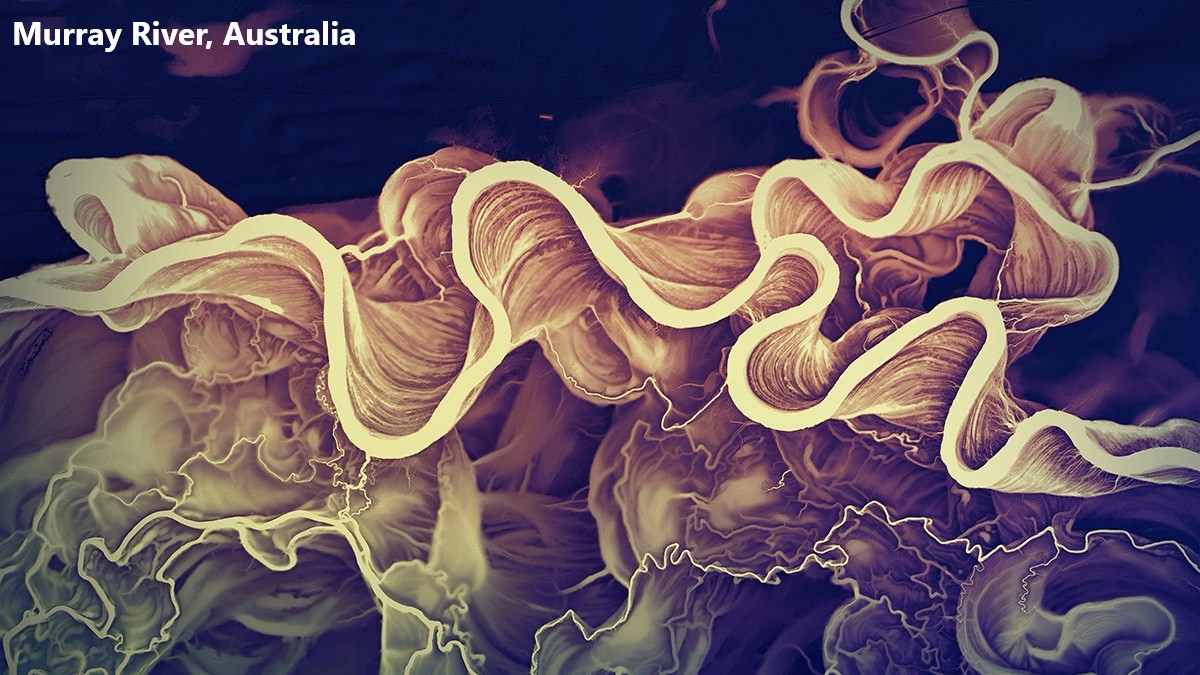
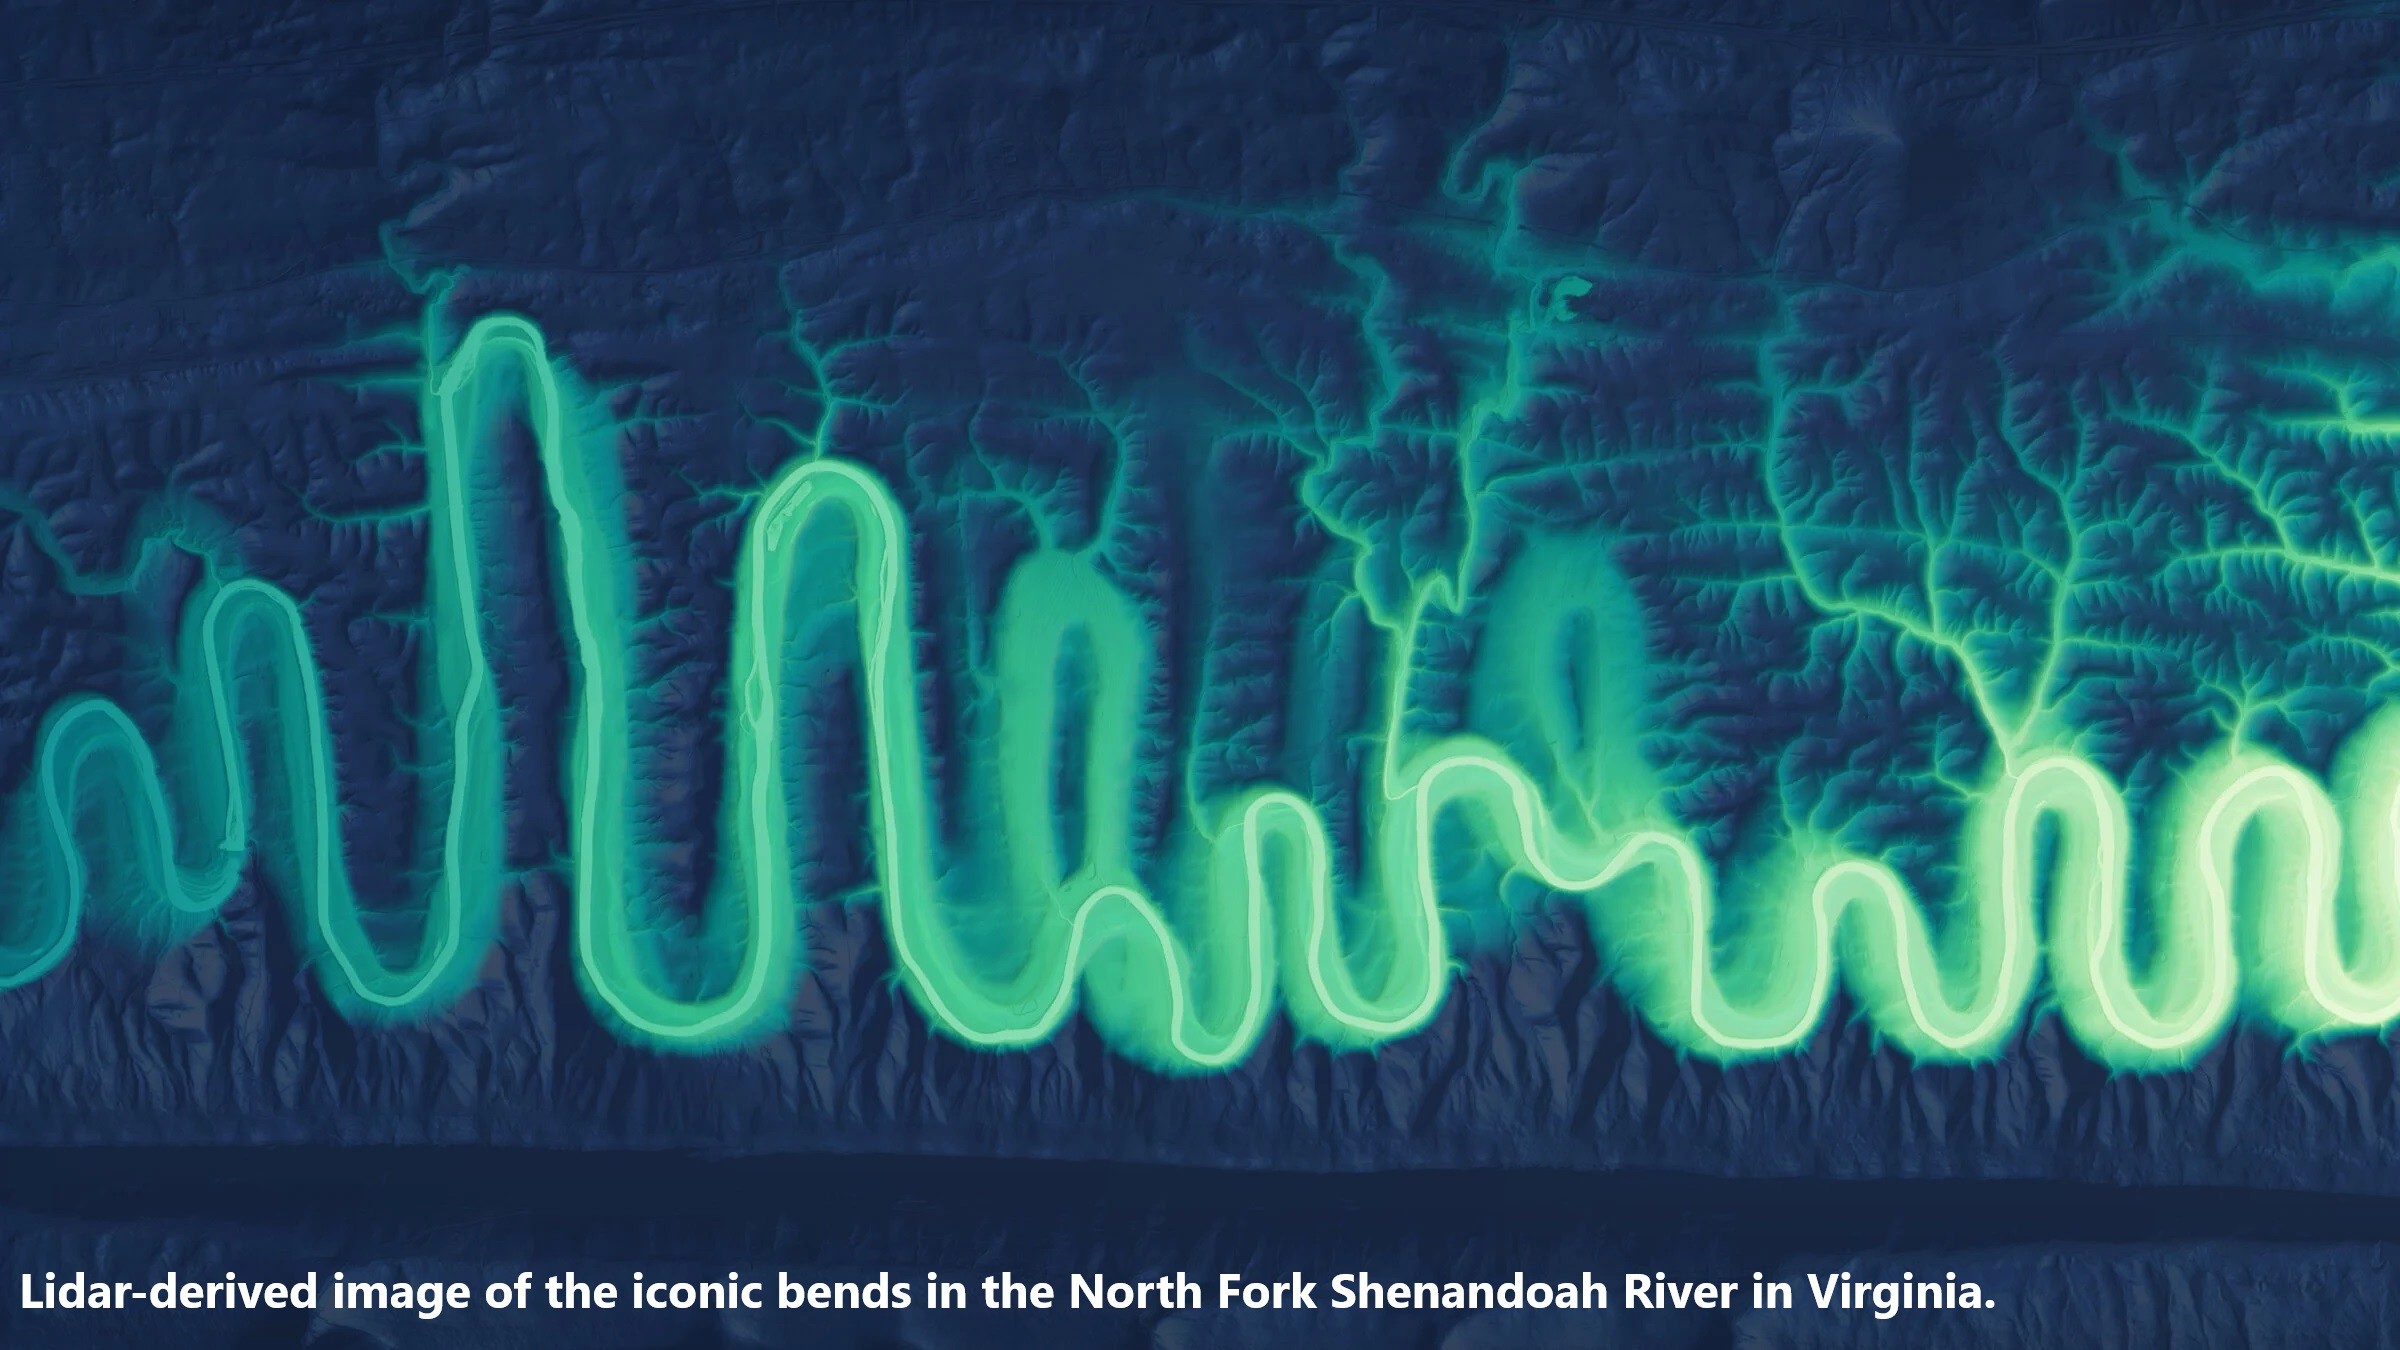
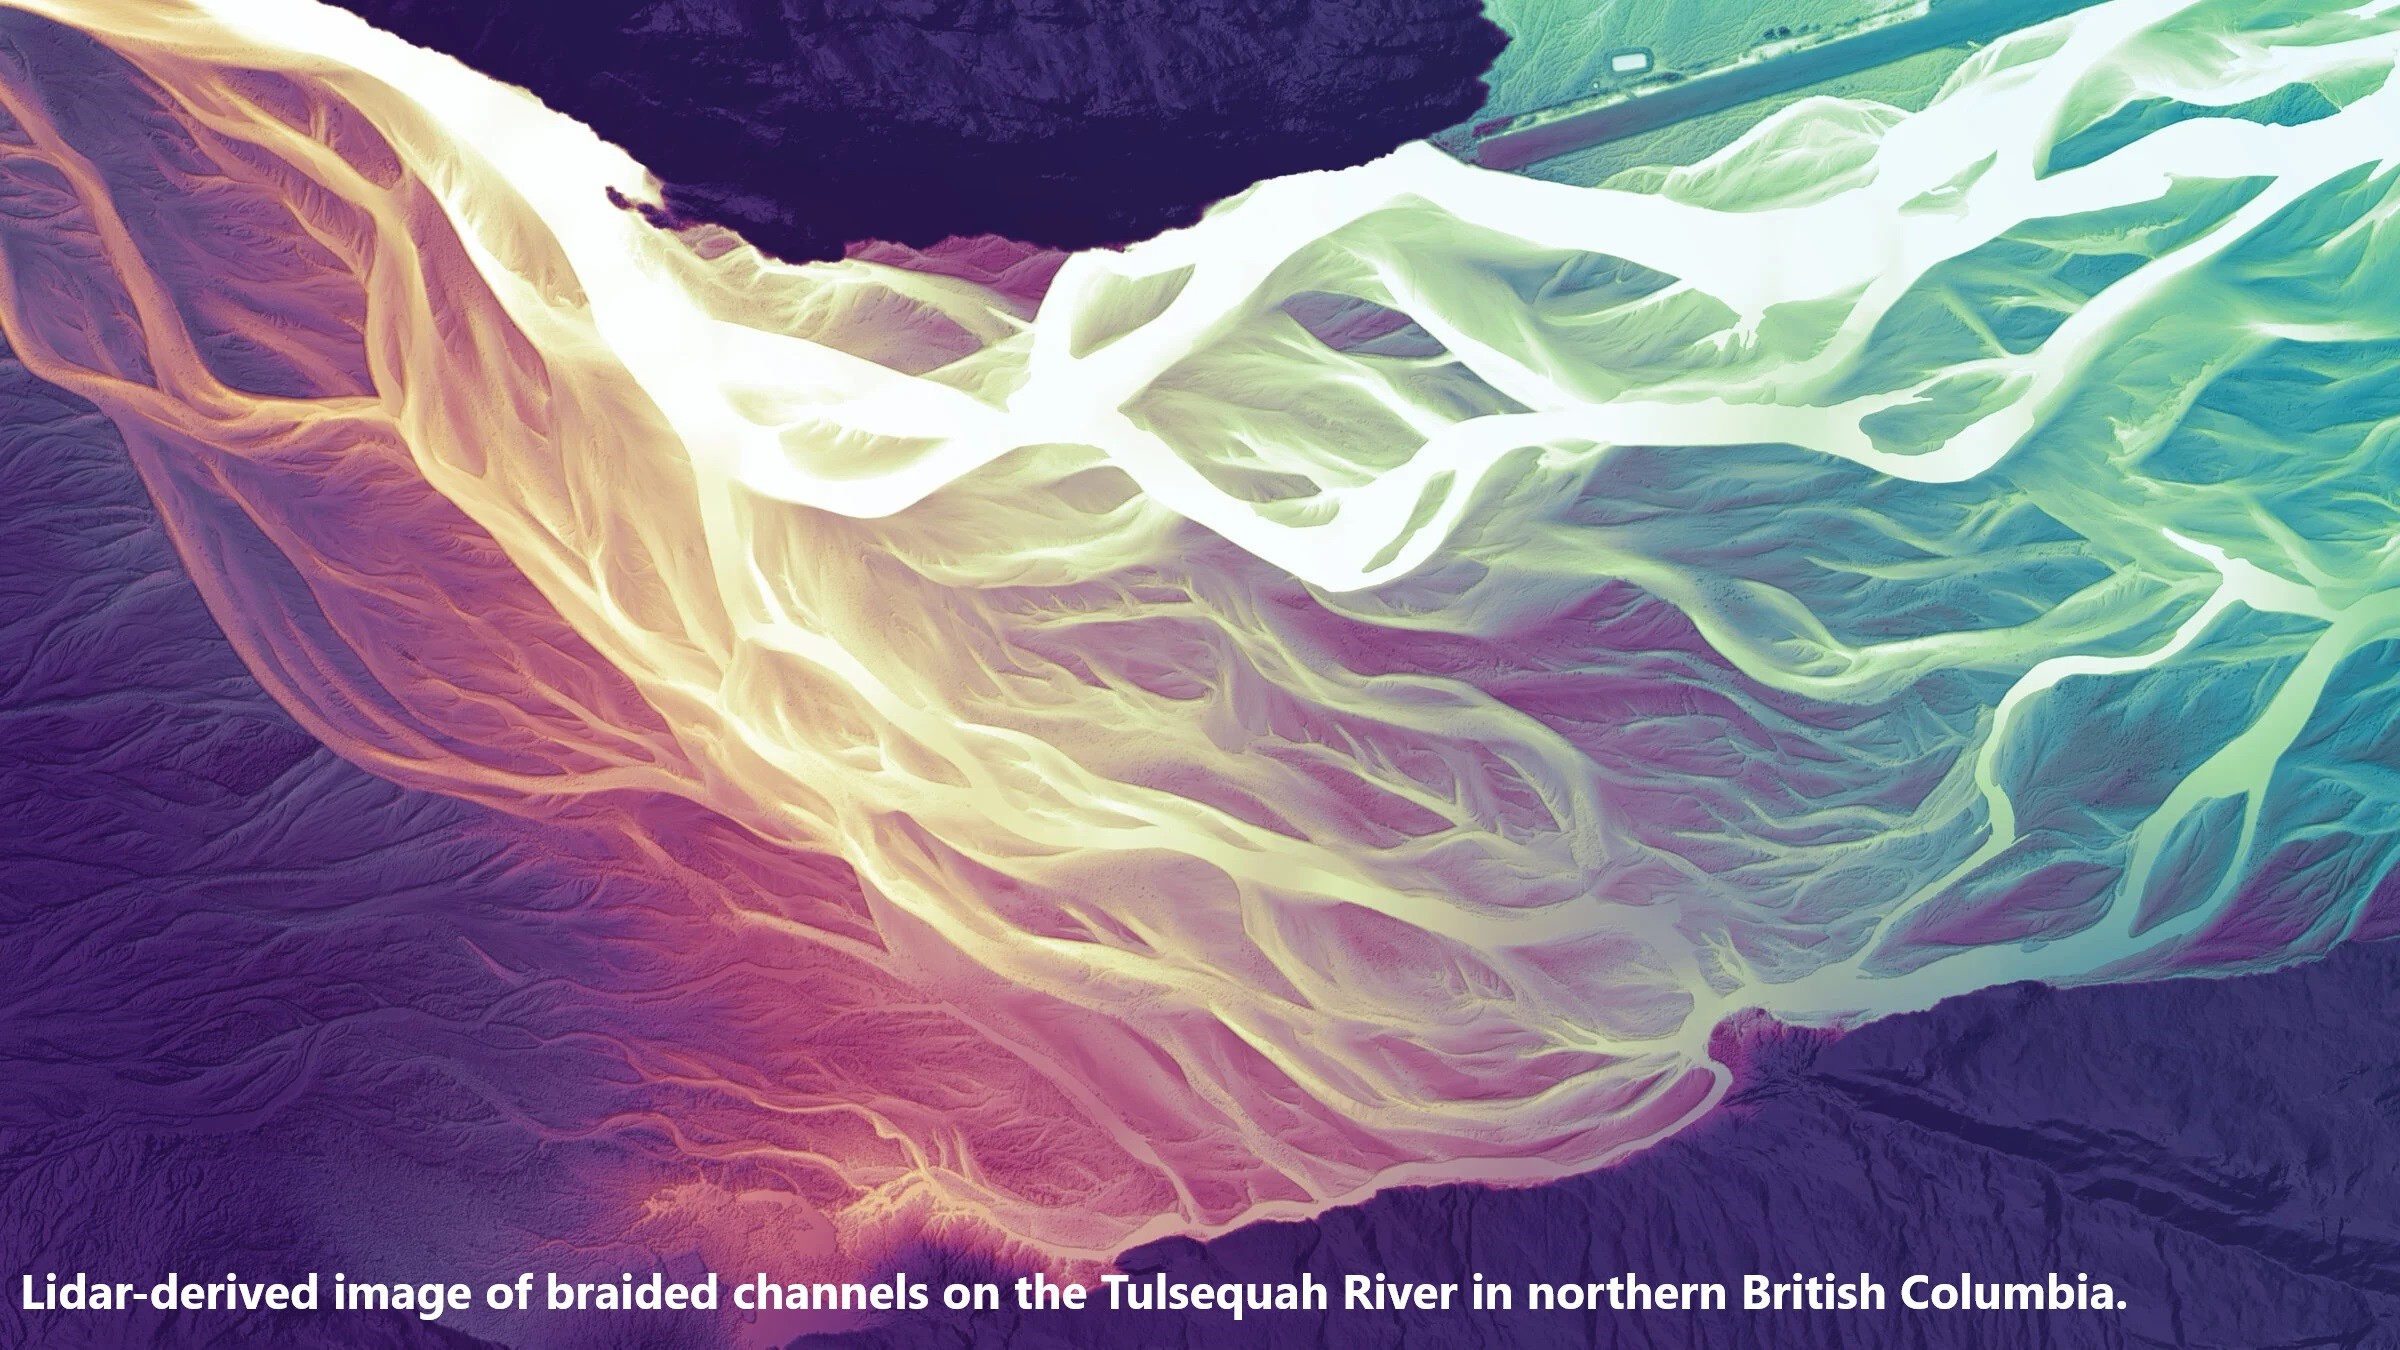
Daniel Coe’s Astonishing River Cartography
--
https://orionmagazine.org/article/daniel-coe-river-cartography/ <-- shared media article
--
https://dancoecarto.com/work <-- his website
--
[those in the spatial hydrology ‘world’ have long been incredibly impressed by Dan Coe’s imagery and cartography, here is a wonderful article on cartography & science with his visual arts quality]
“Cartographer Daniel Coe uses relative elevation data, primarily from plane-mounted lasers called lidar, to visualize Earth’s natural features, like rivers and floodplains. His stunning river maps reveal stories hidden in historical sediment and past channels carved by the water, as it twists and turns through both landscape and time…”
#GIS #spatial #mapping #DanielCoe #cartography #hydrospatial #river #riverine #imagery #representation #map #representation #science #remotesensing #LiDAR #sedimentation #flooding #riverchannel #change #spatiotemporal #gischat
#DanielCoe #fluvial #geomorphology
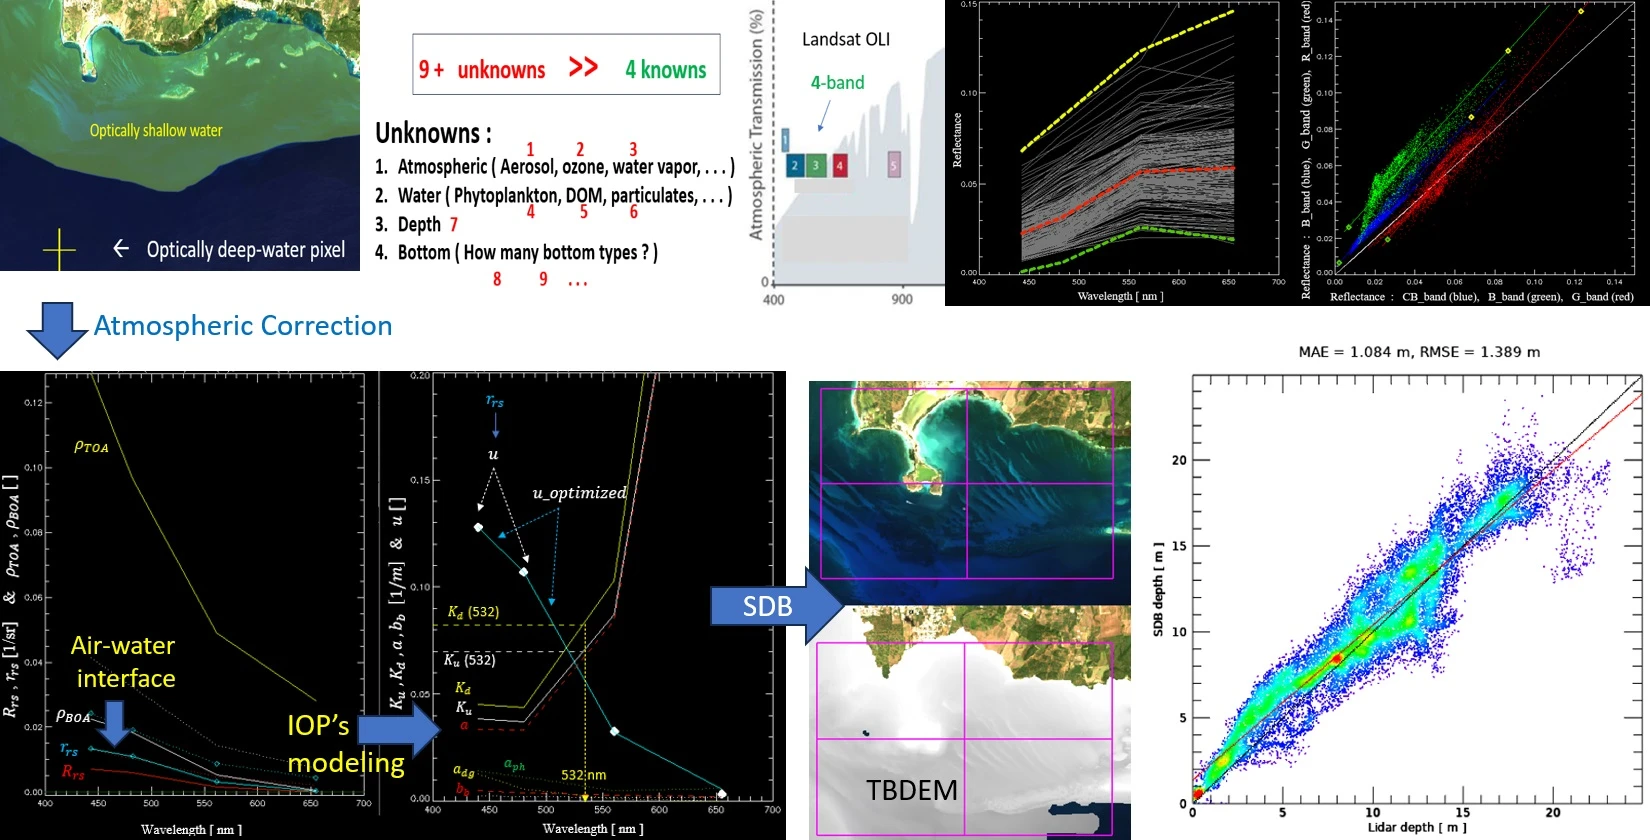
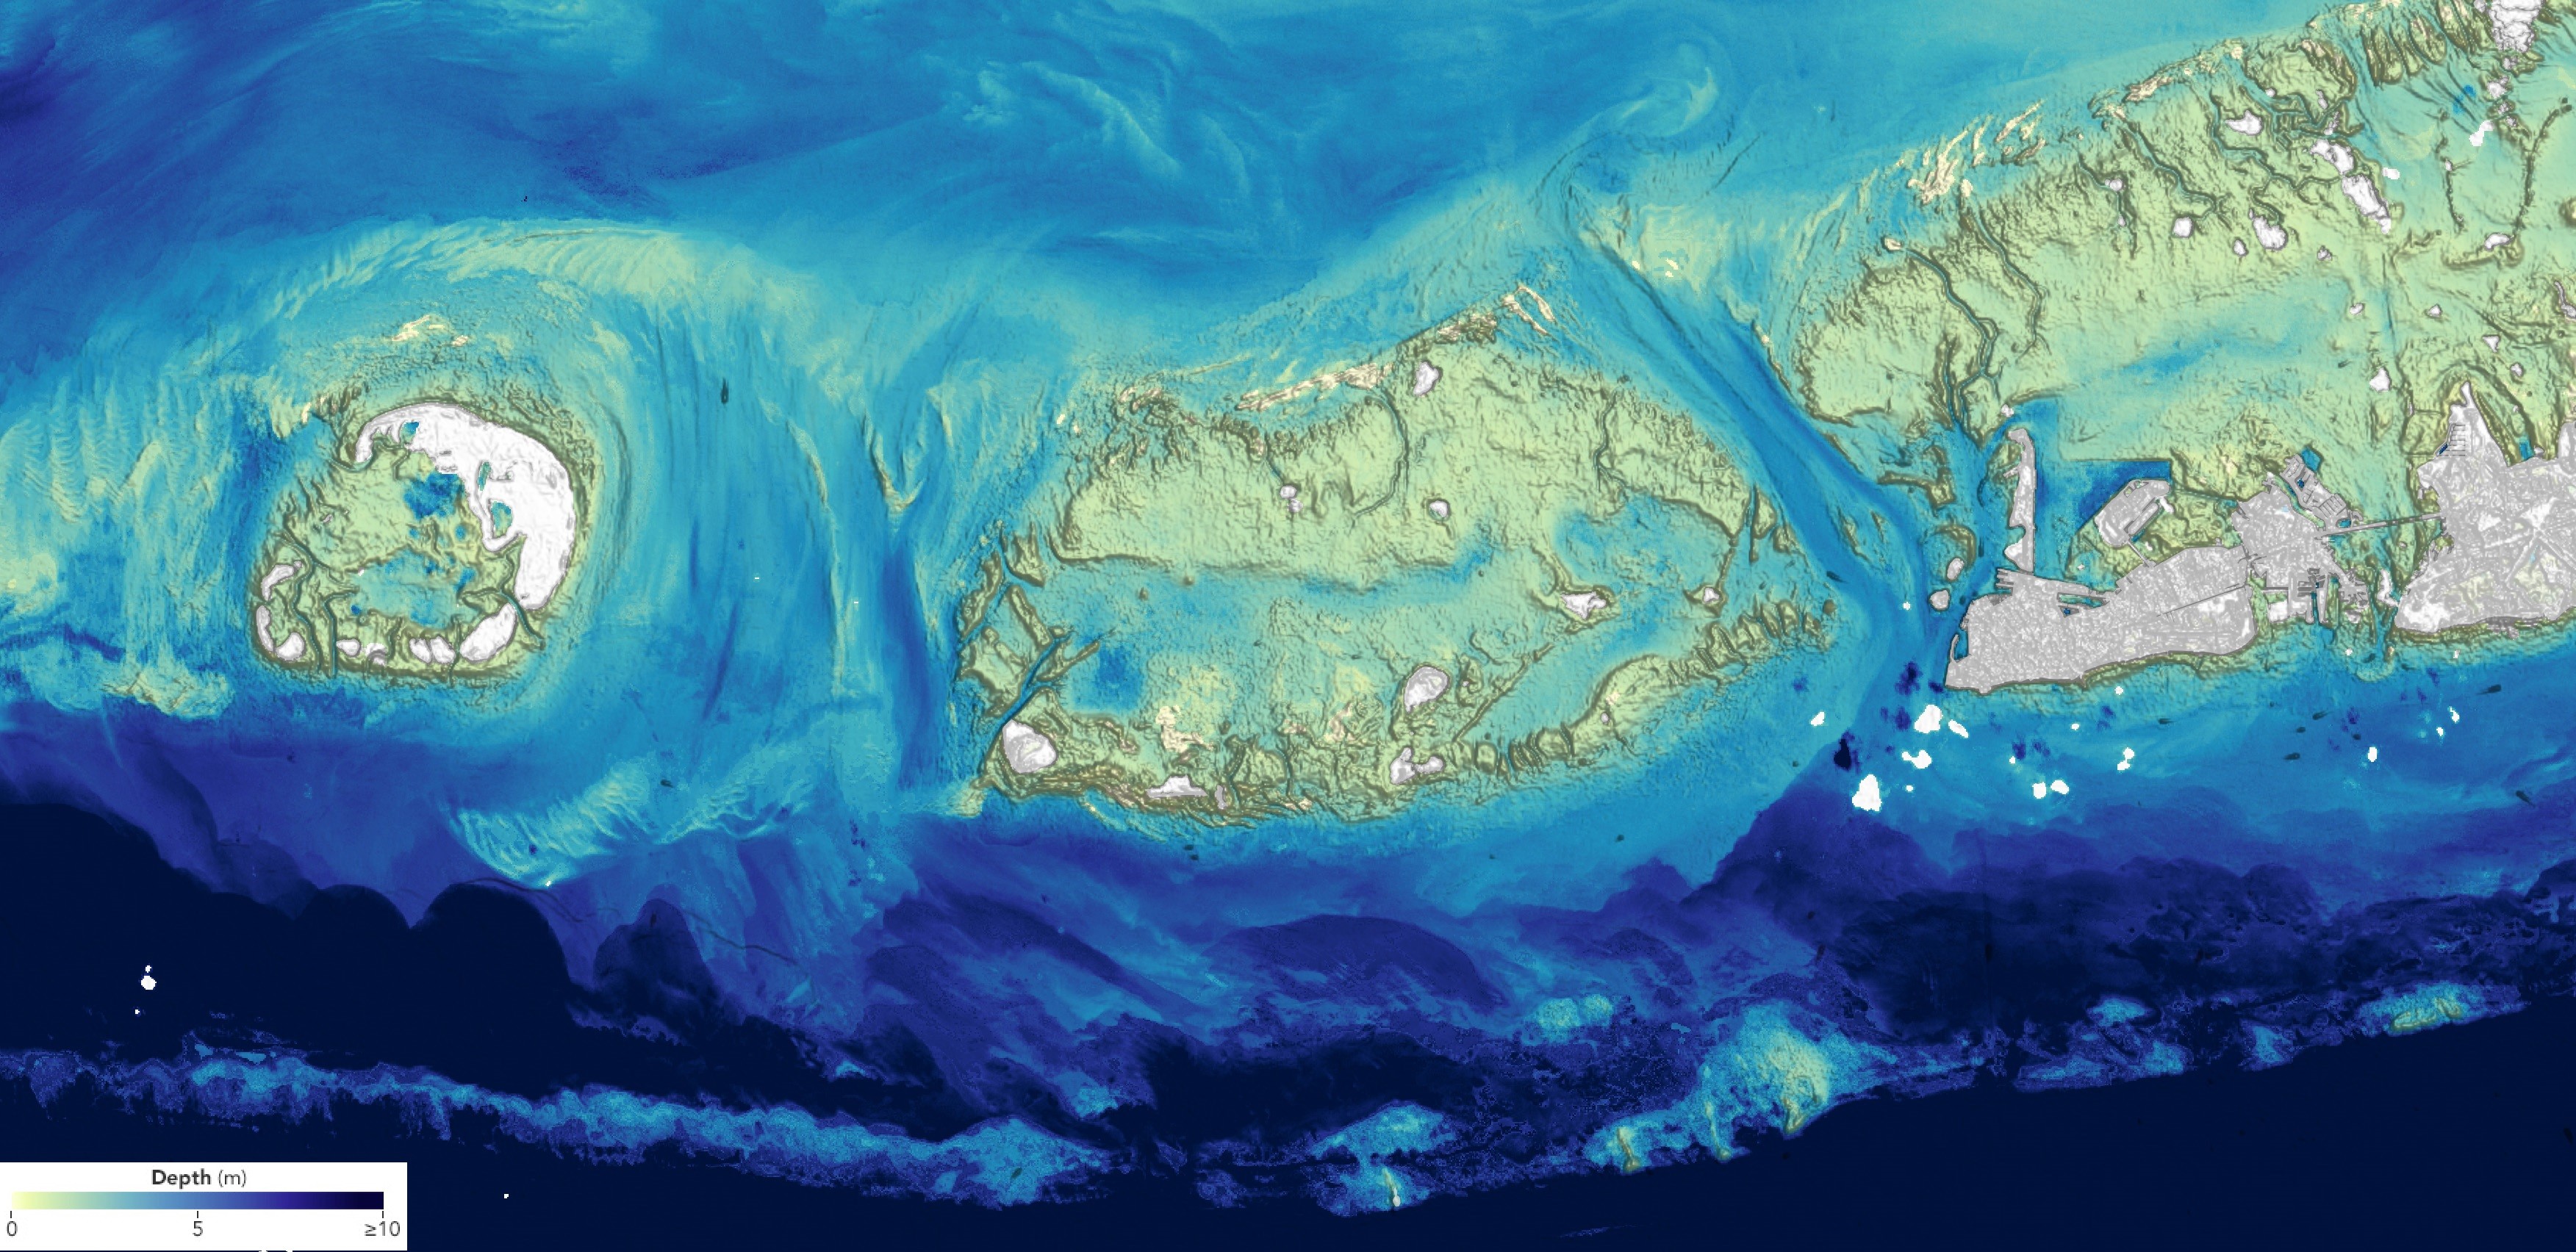
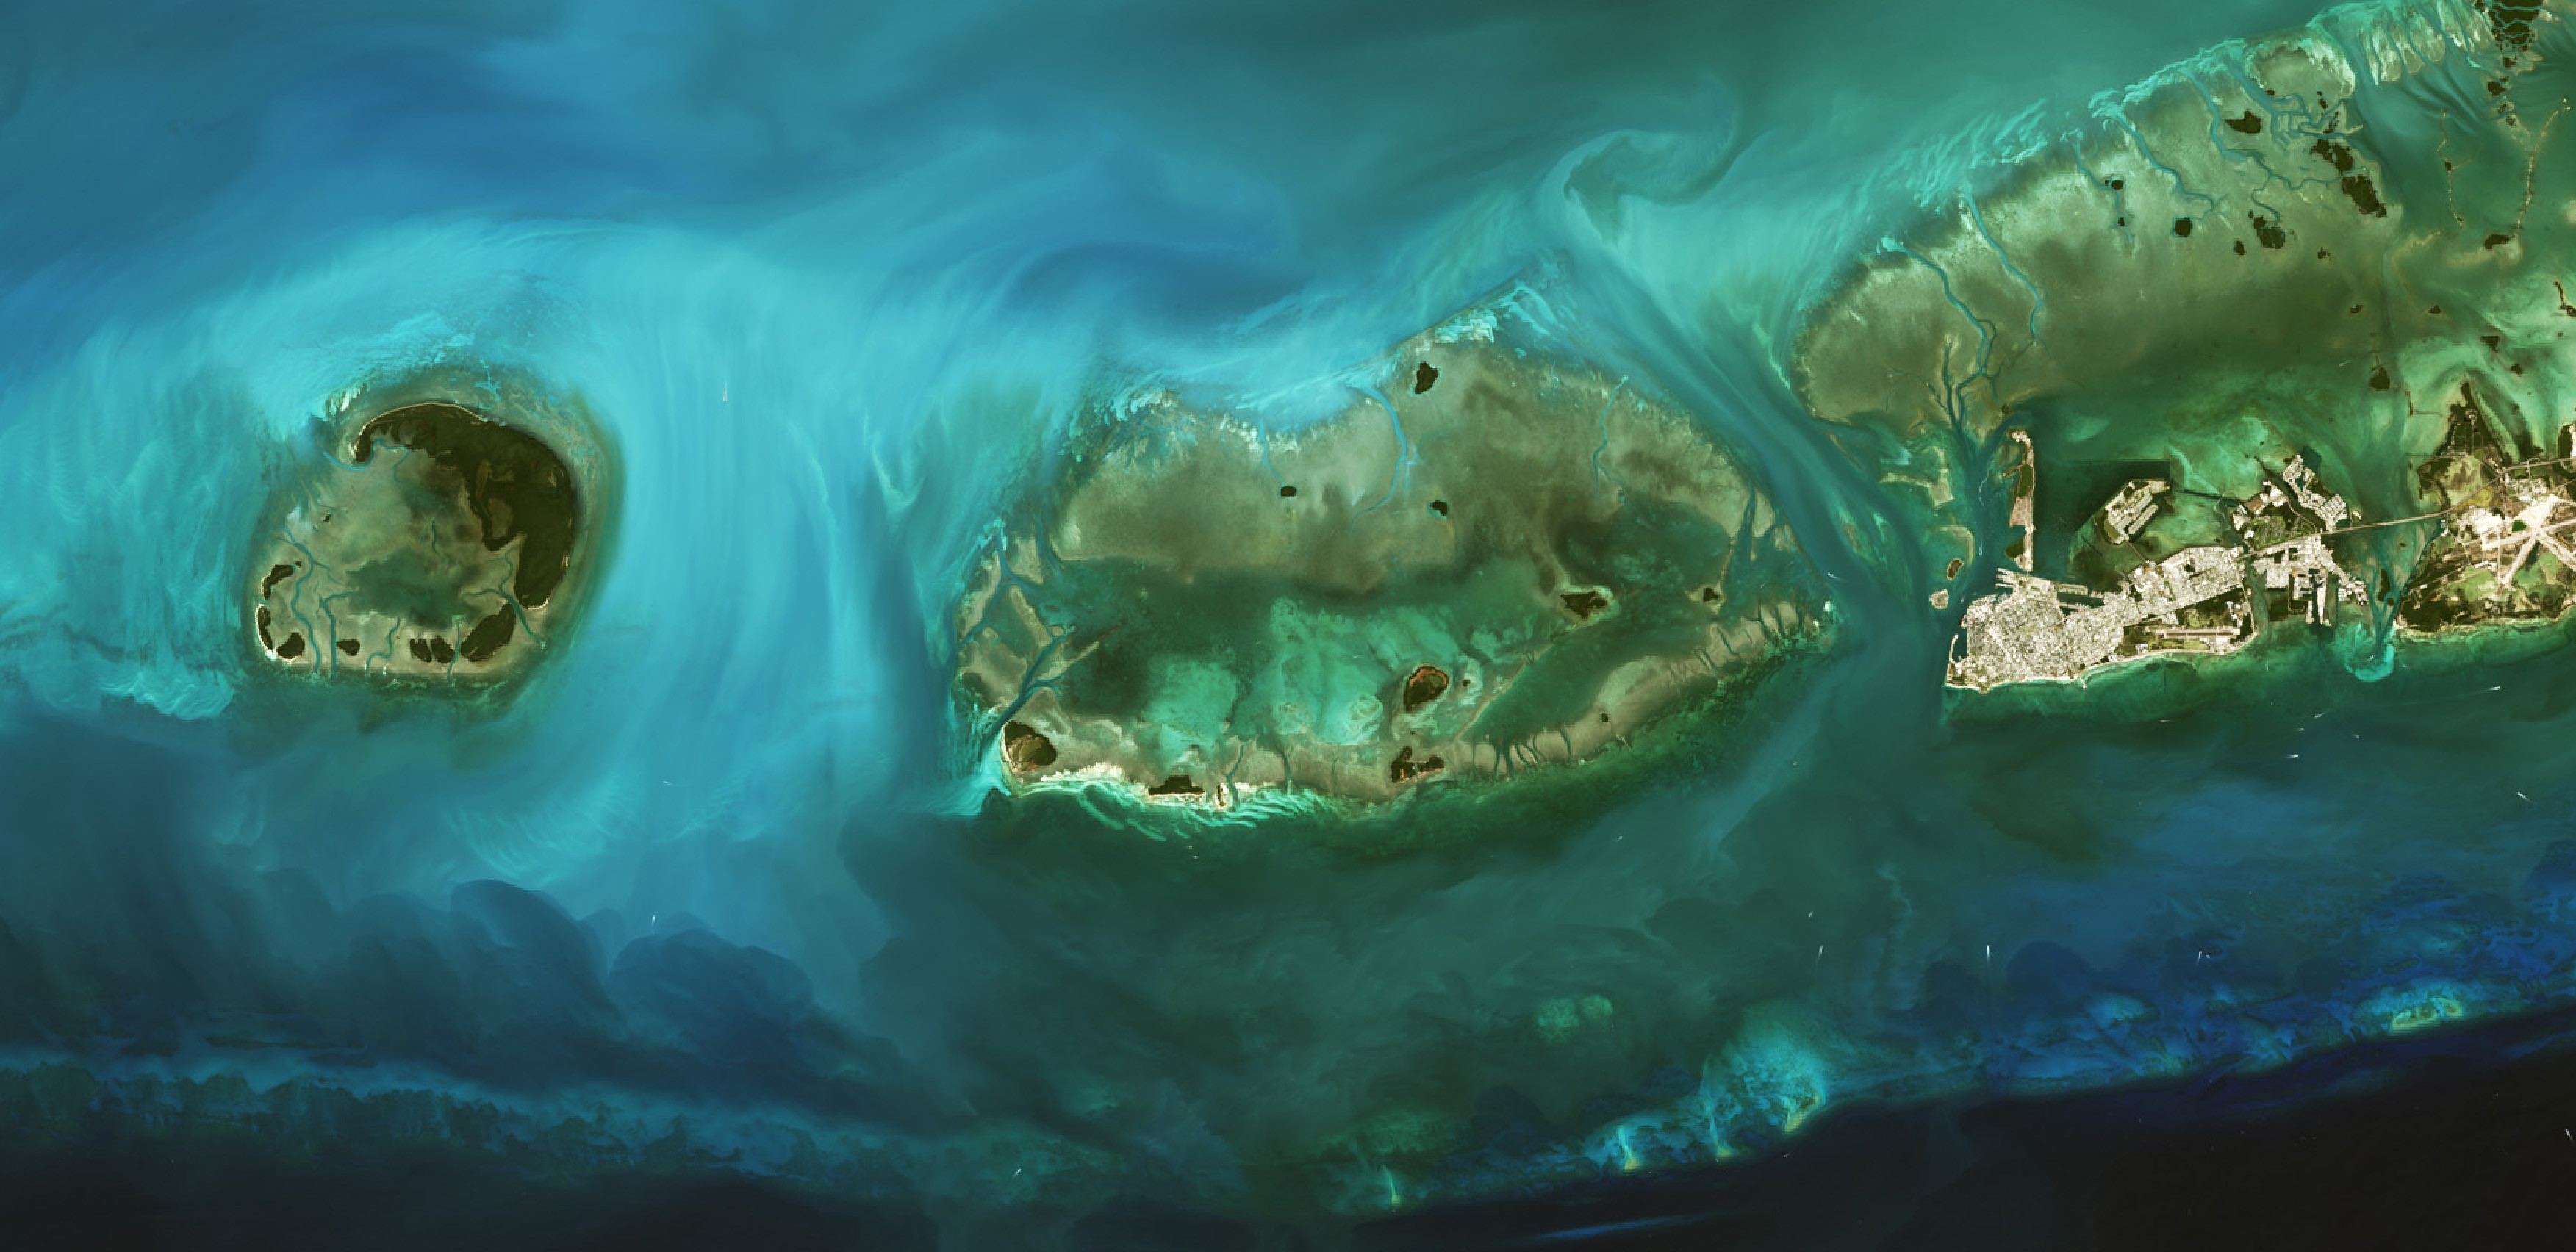
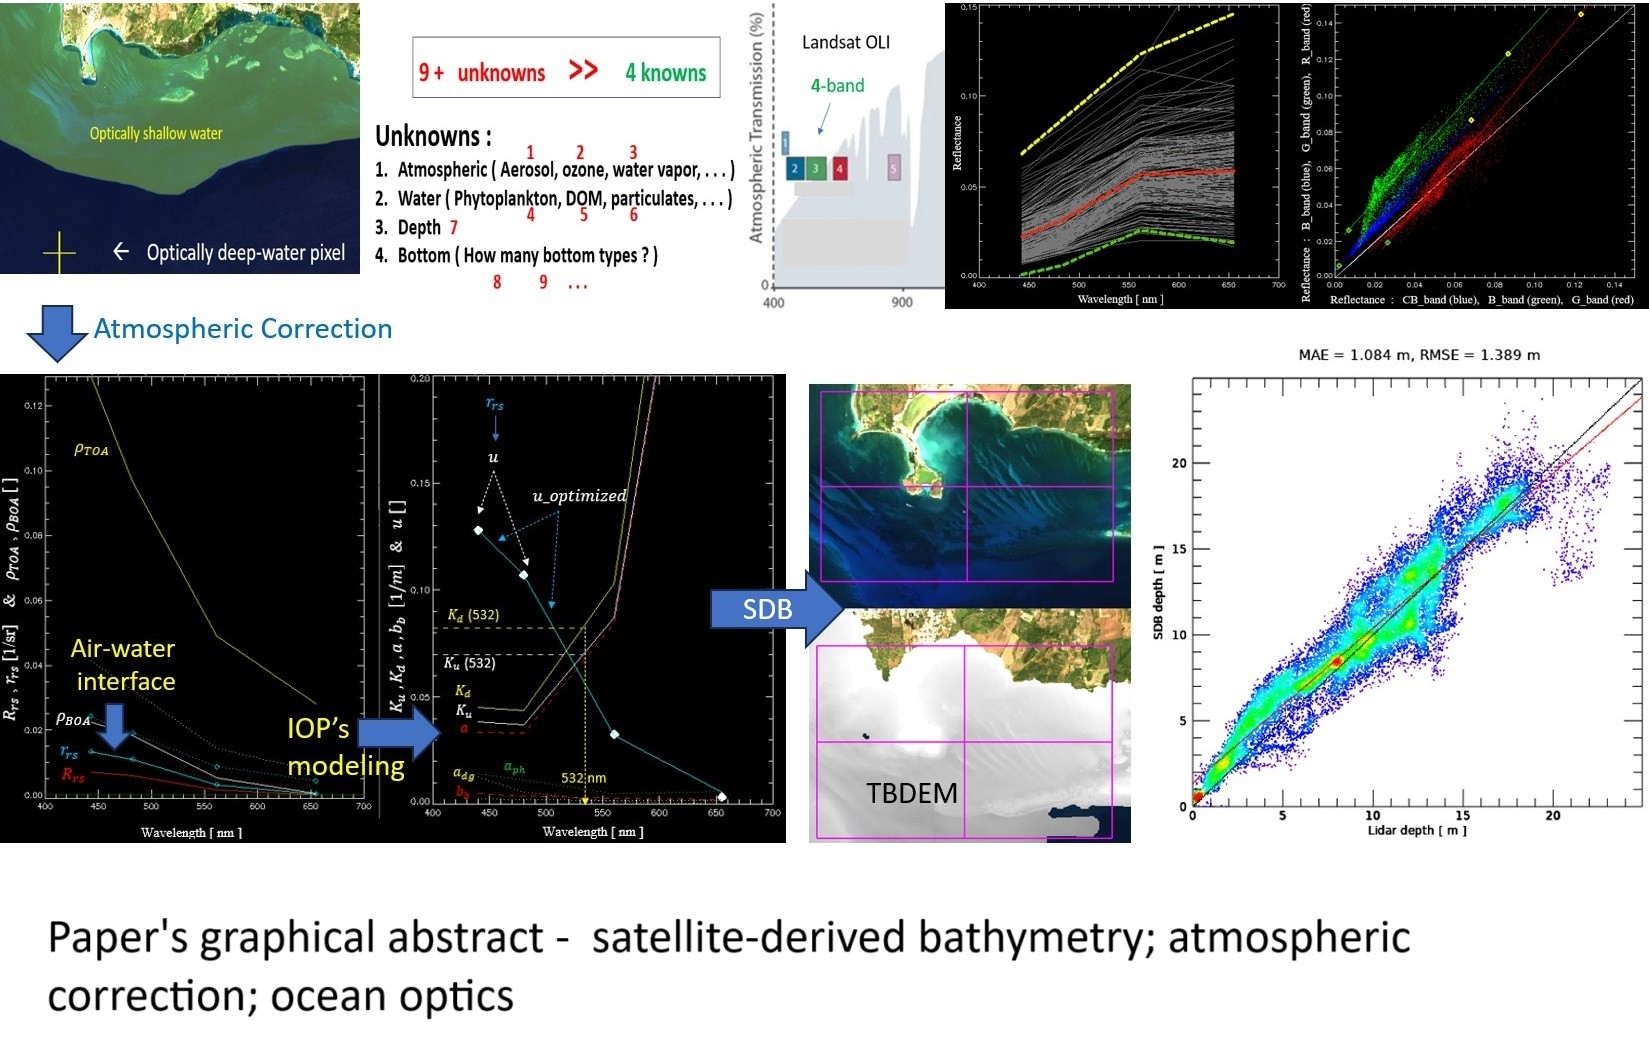
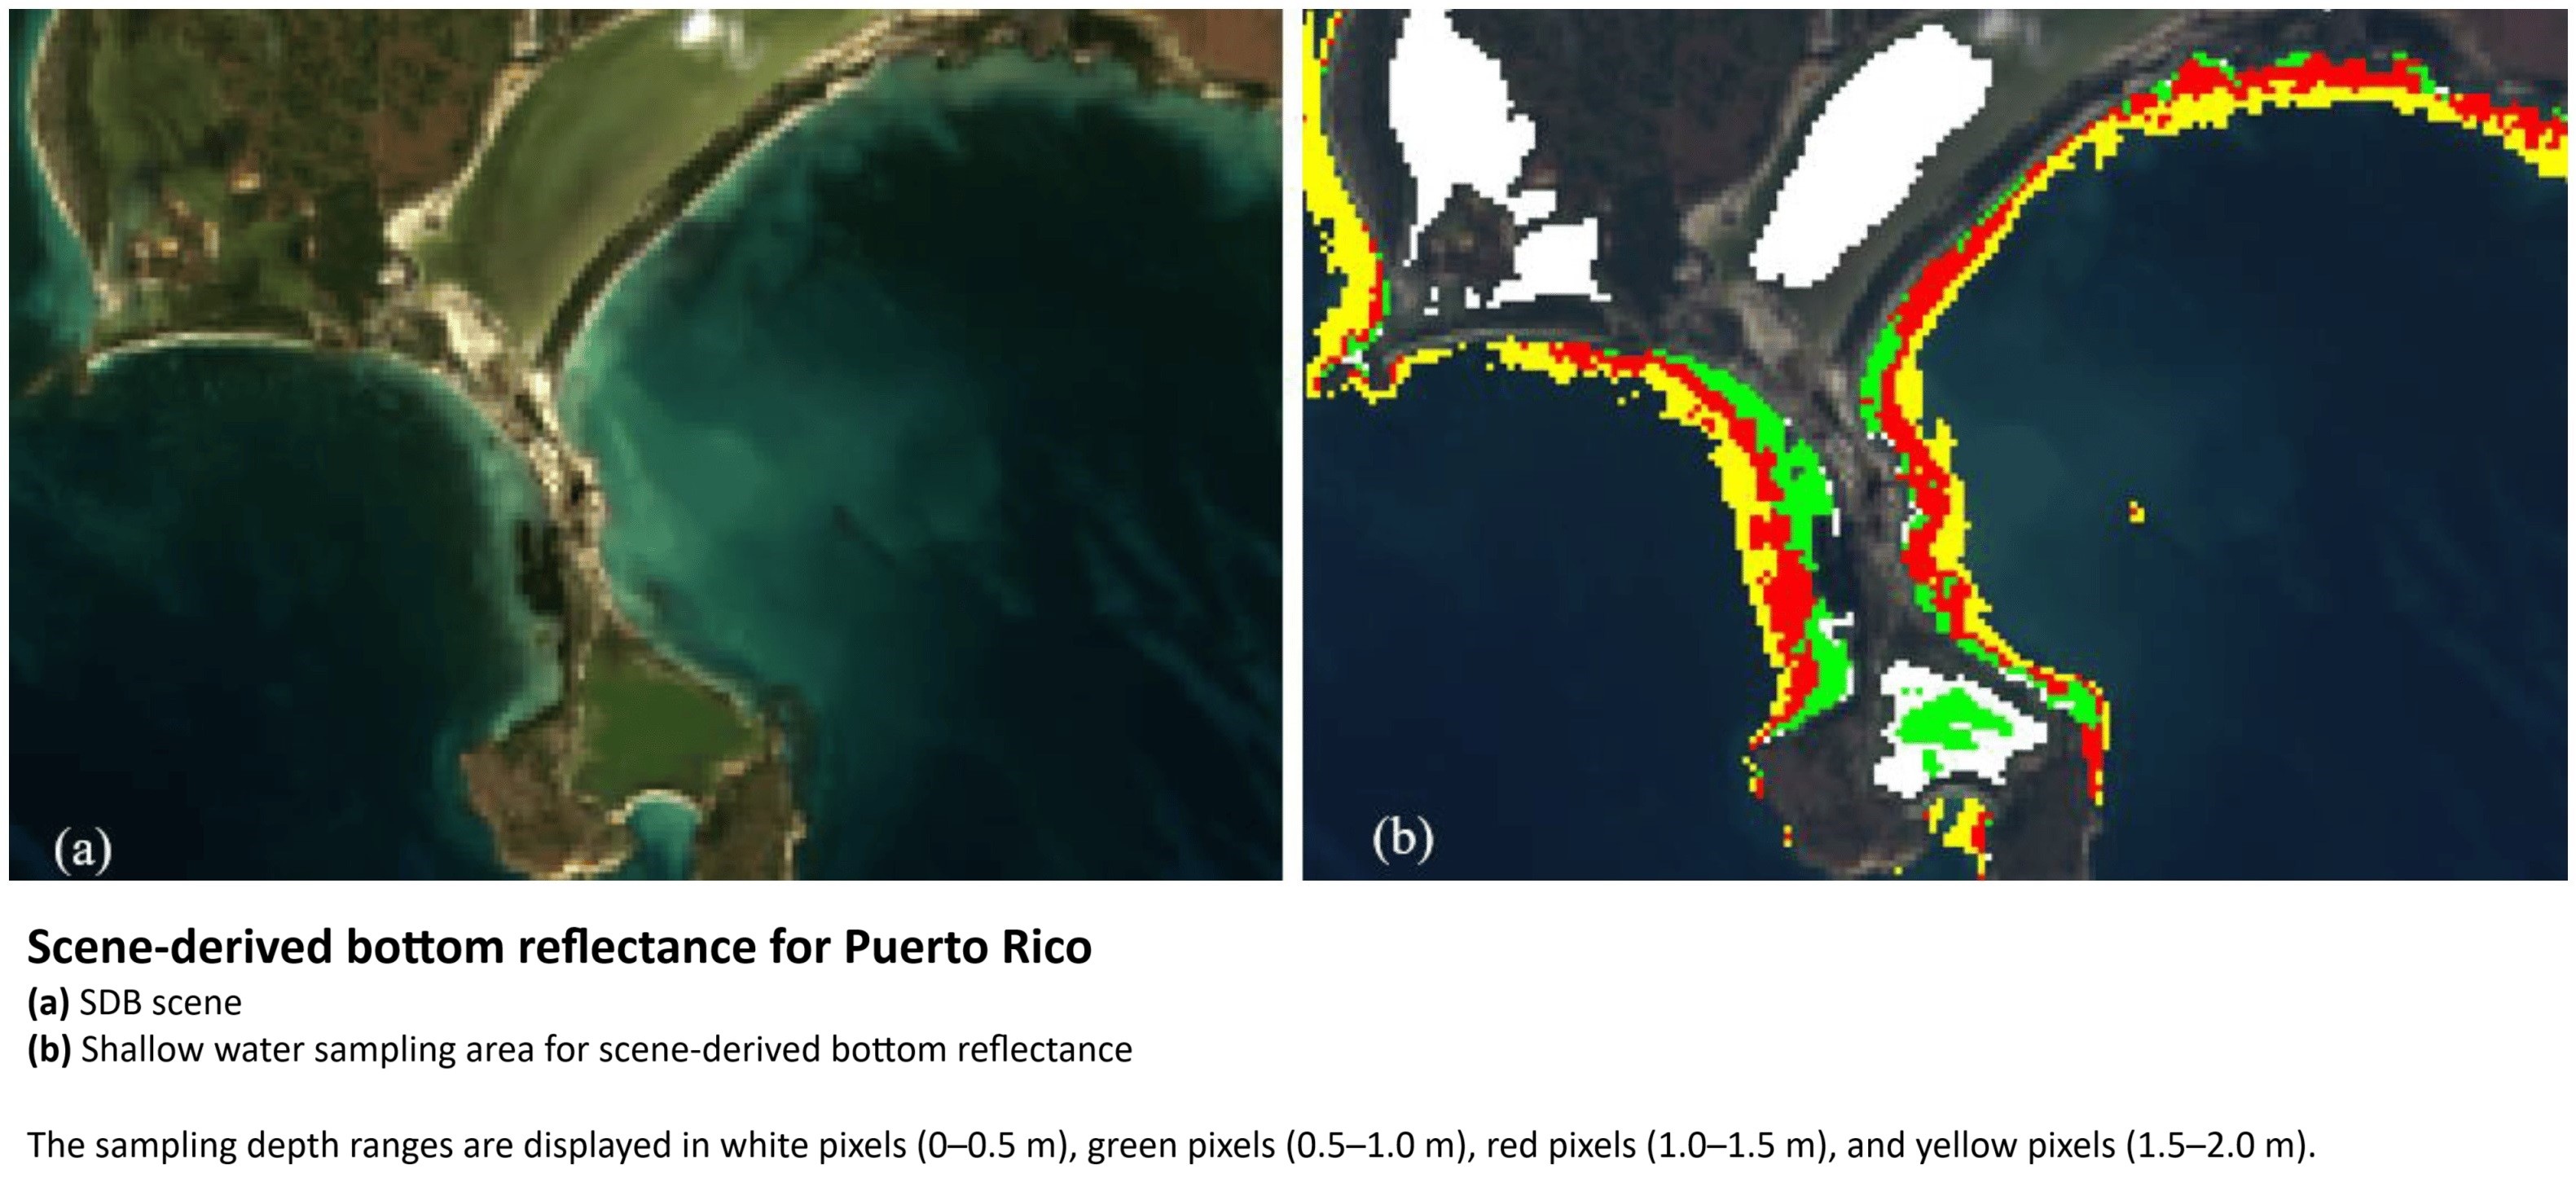
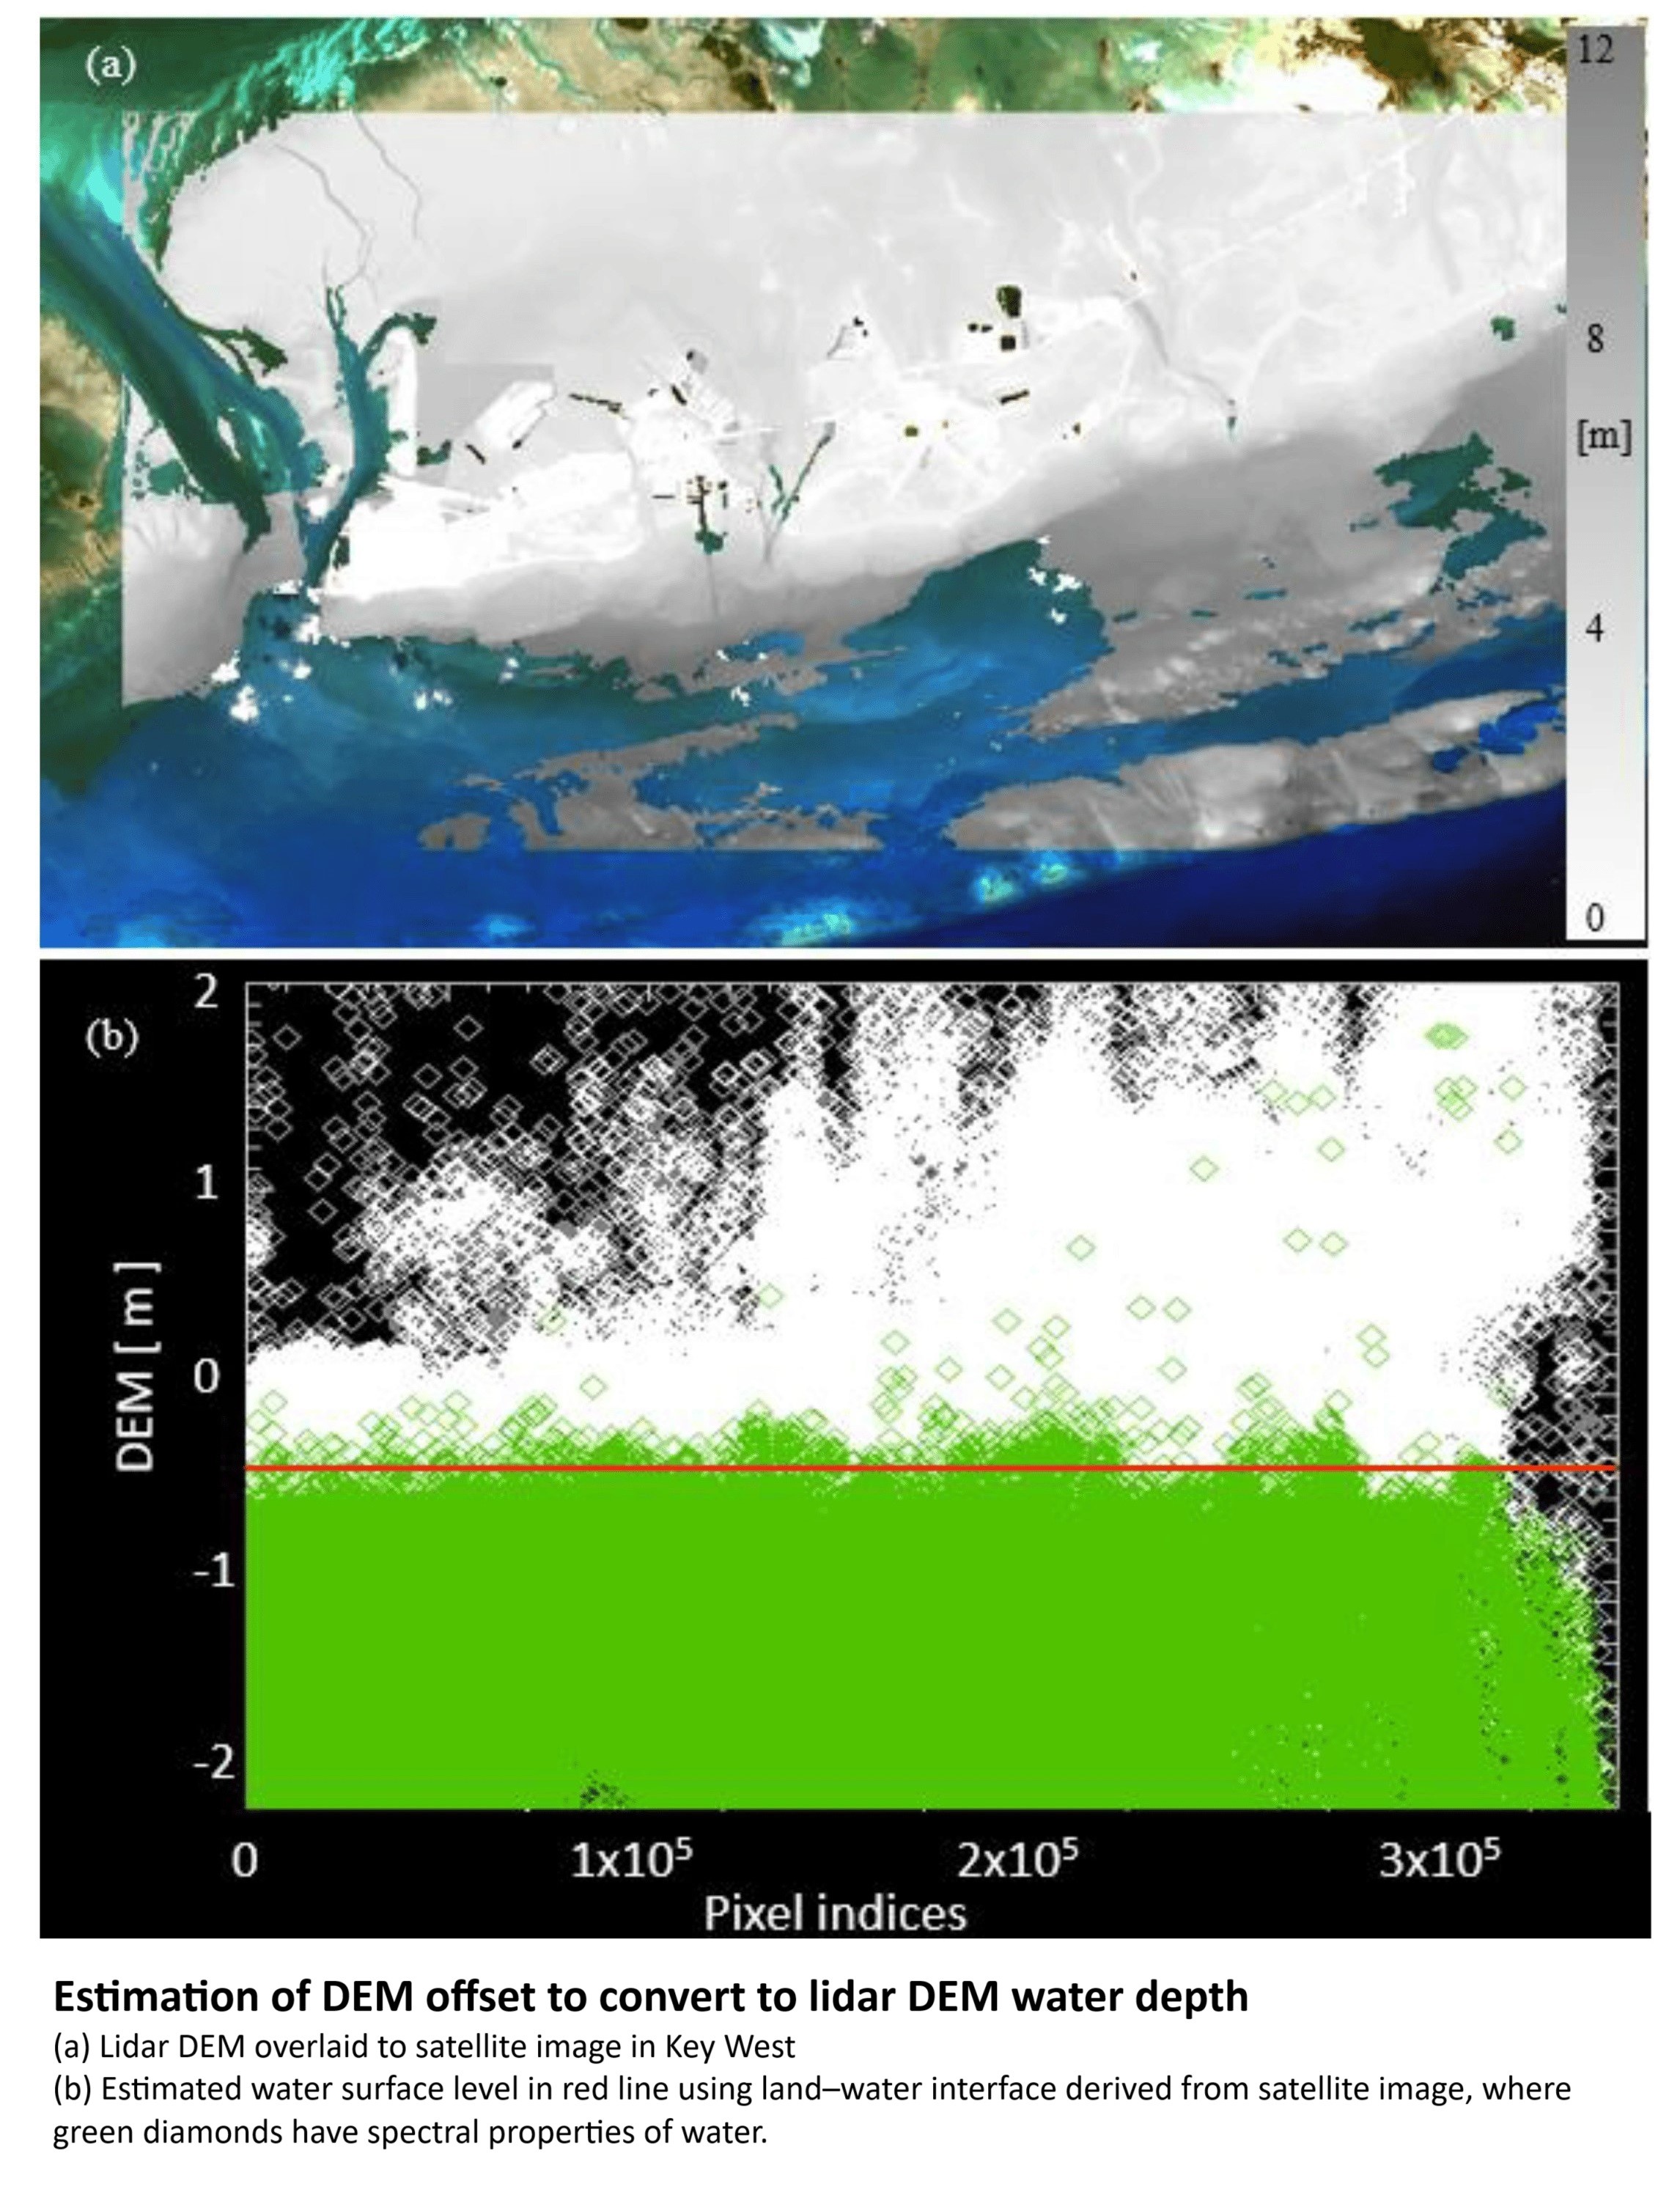
Landsat Plumbs The (Shallow) Depths [Near Shore TopoBathy]
--
https://earthobservatory.nasa.gov/images/153529/landsat-plumbs-the-shallow-depths <-- shared NASA images
--
https://doi.org/10.3390/rs16050843 <-- shared paper
--
#GIS #spatial #mapping #landsat #coast #coastal #topobathy #remotesensing #bathymetry #depth #shallowwater #hydrography #hydrospatial #modeling #OLI #OperationalLandImager #landsat8 #landsat9 #algorithm #spatialanalysis #physics
@USGS
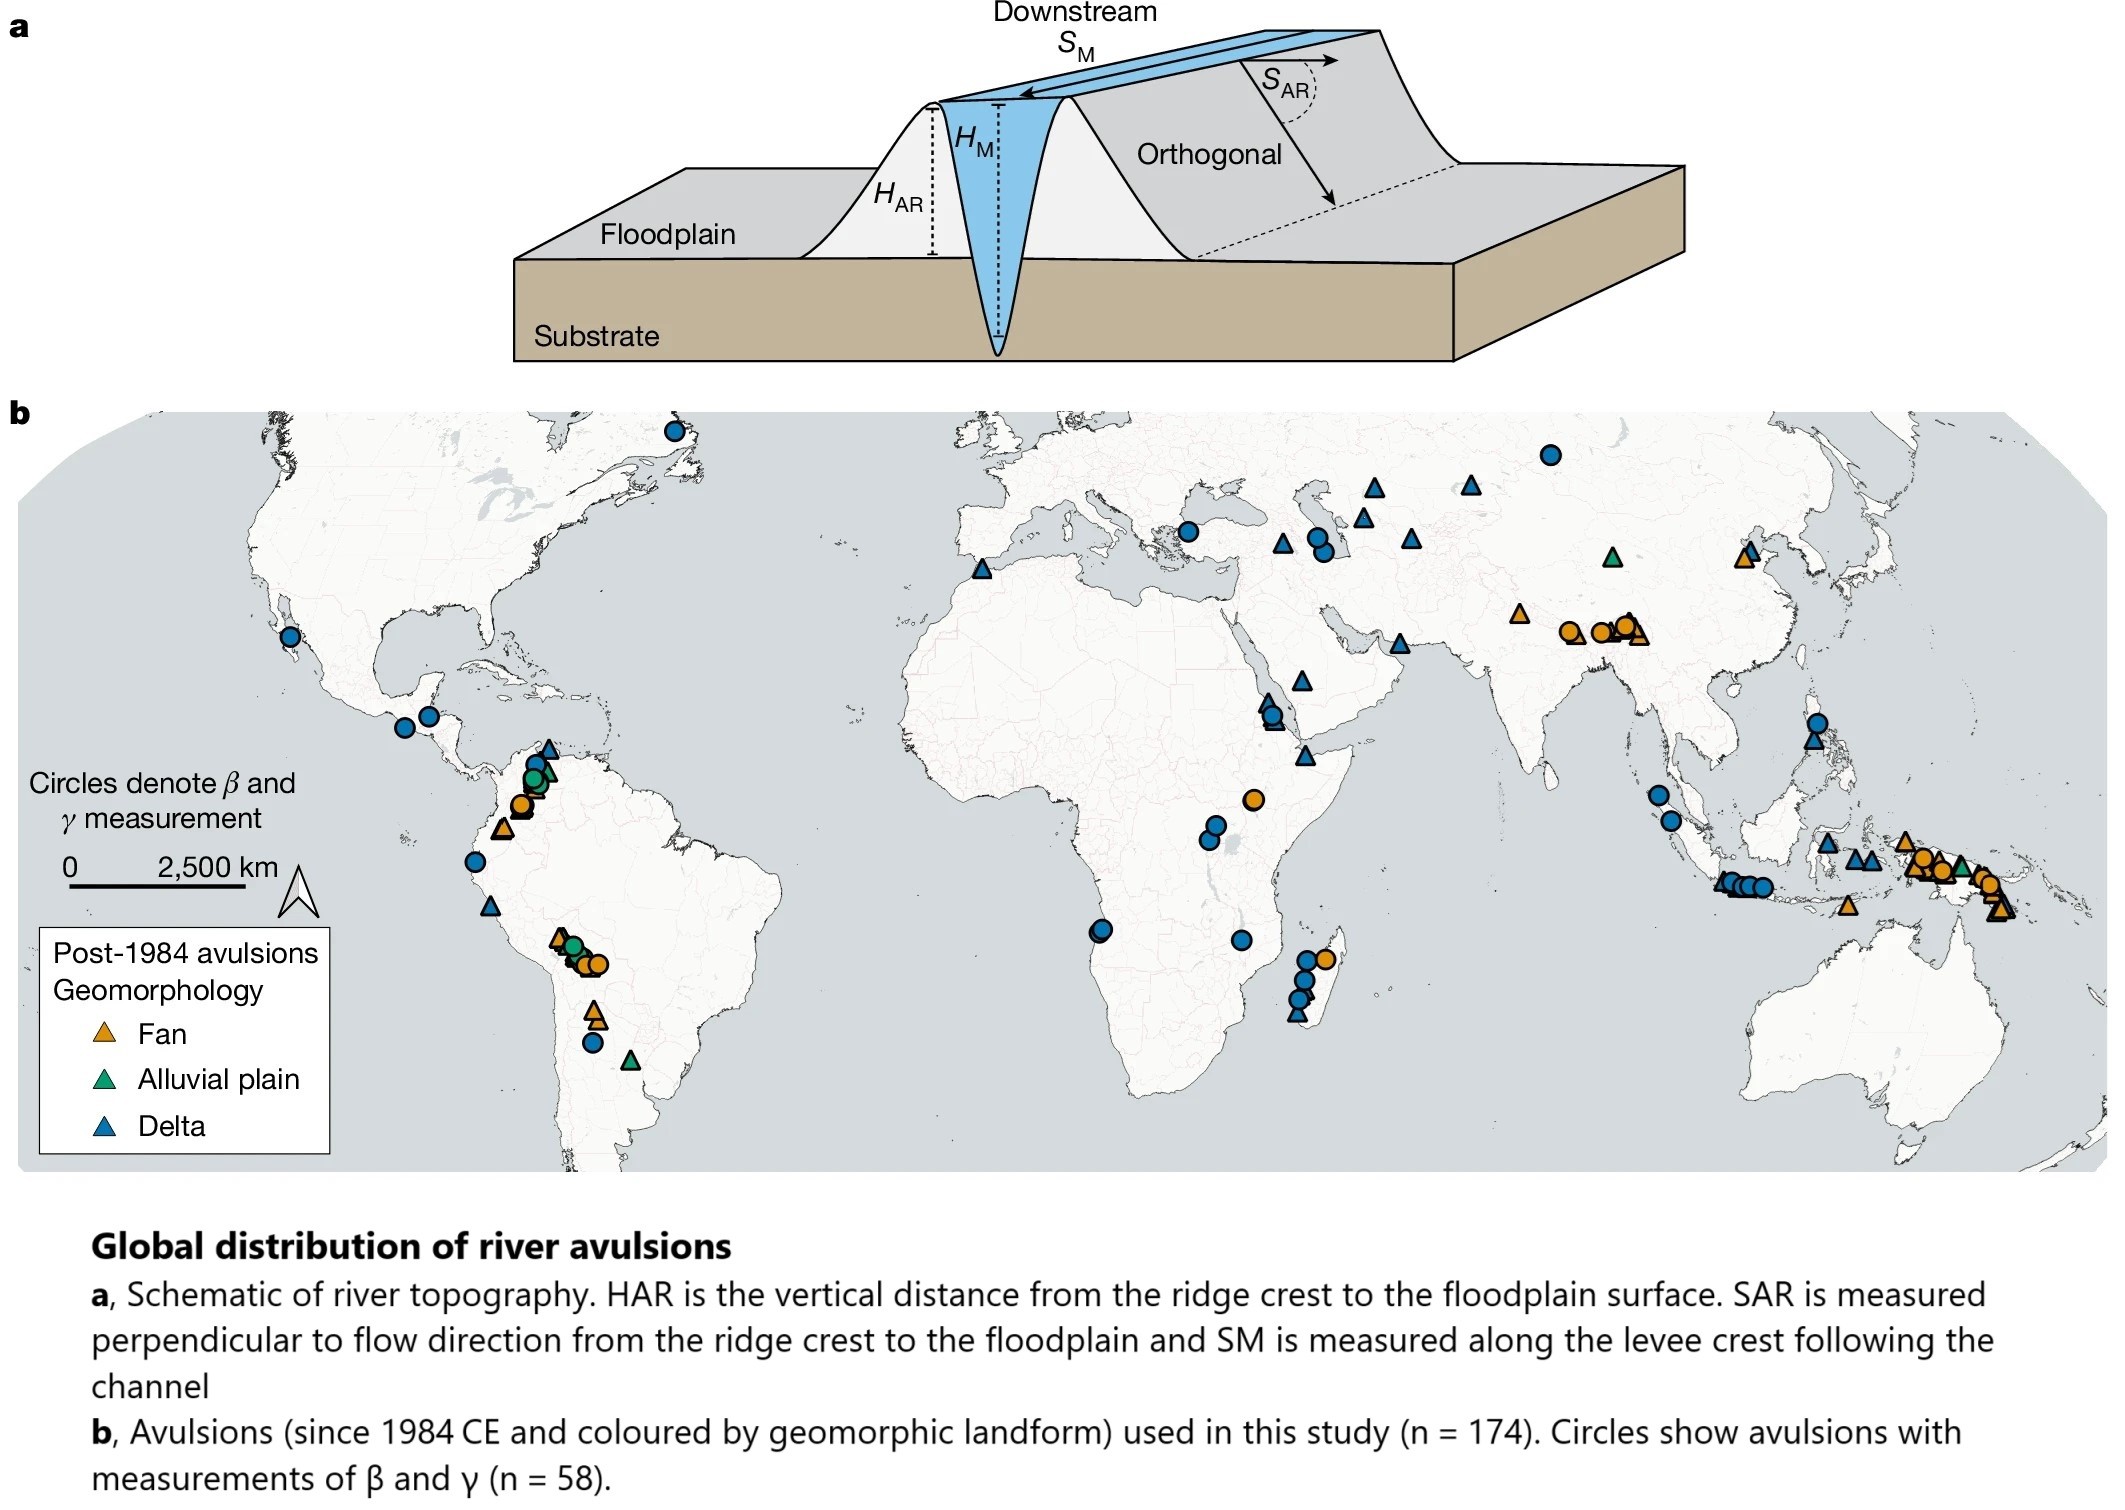
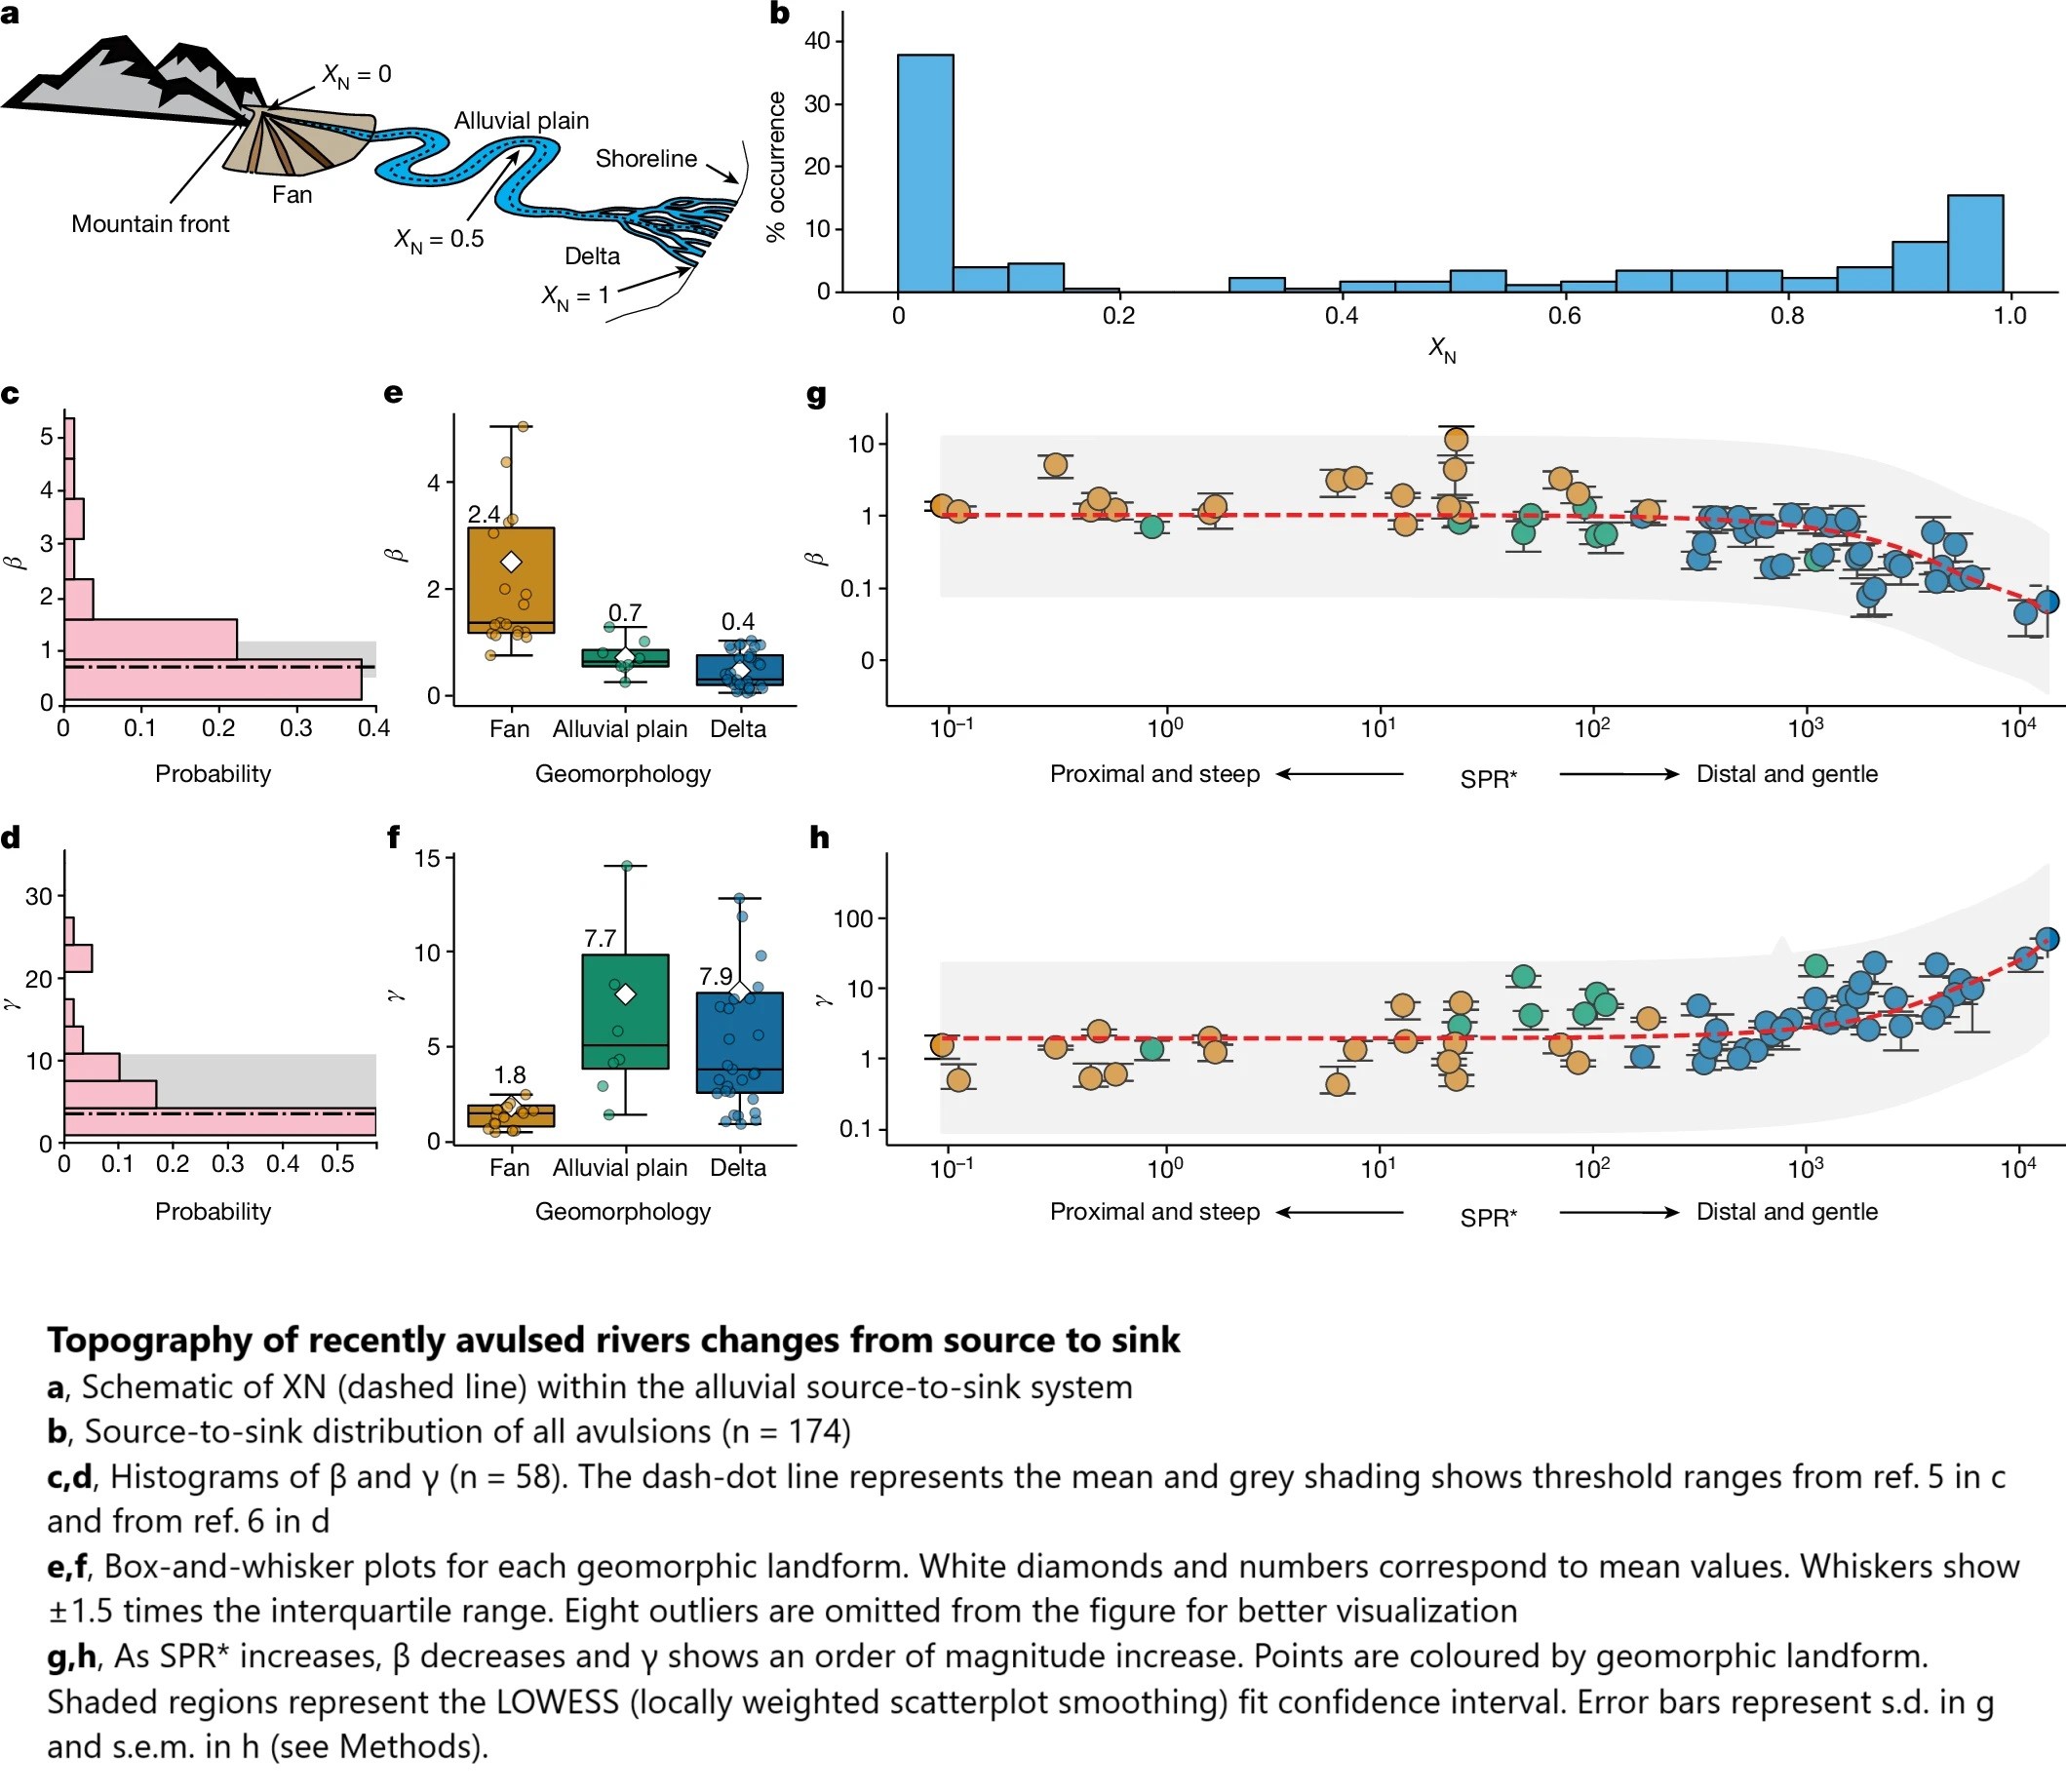
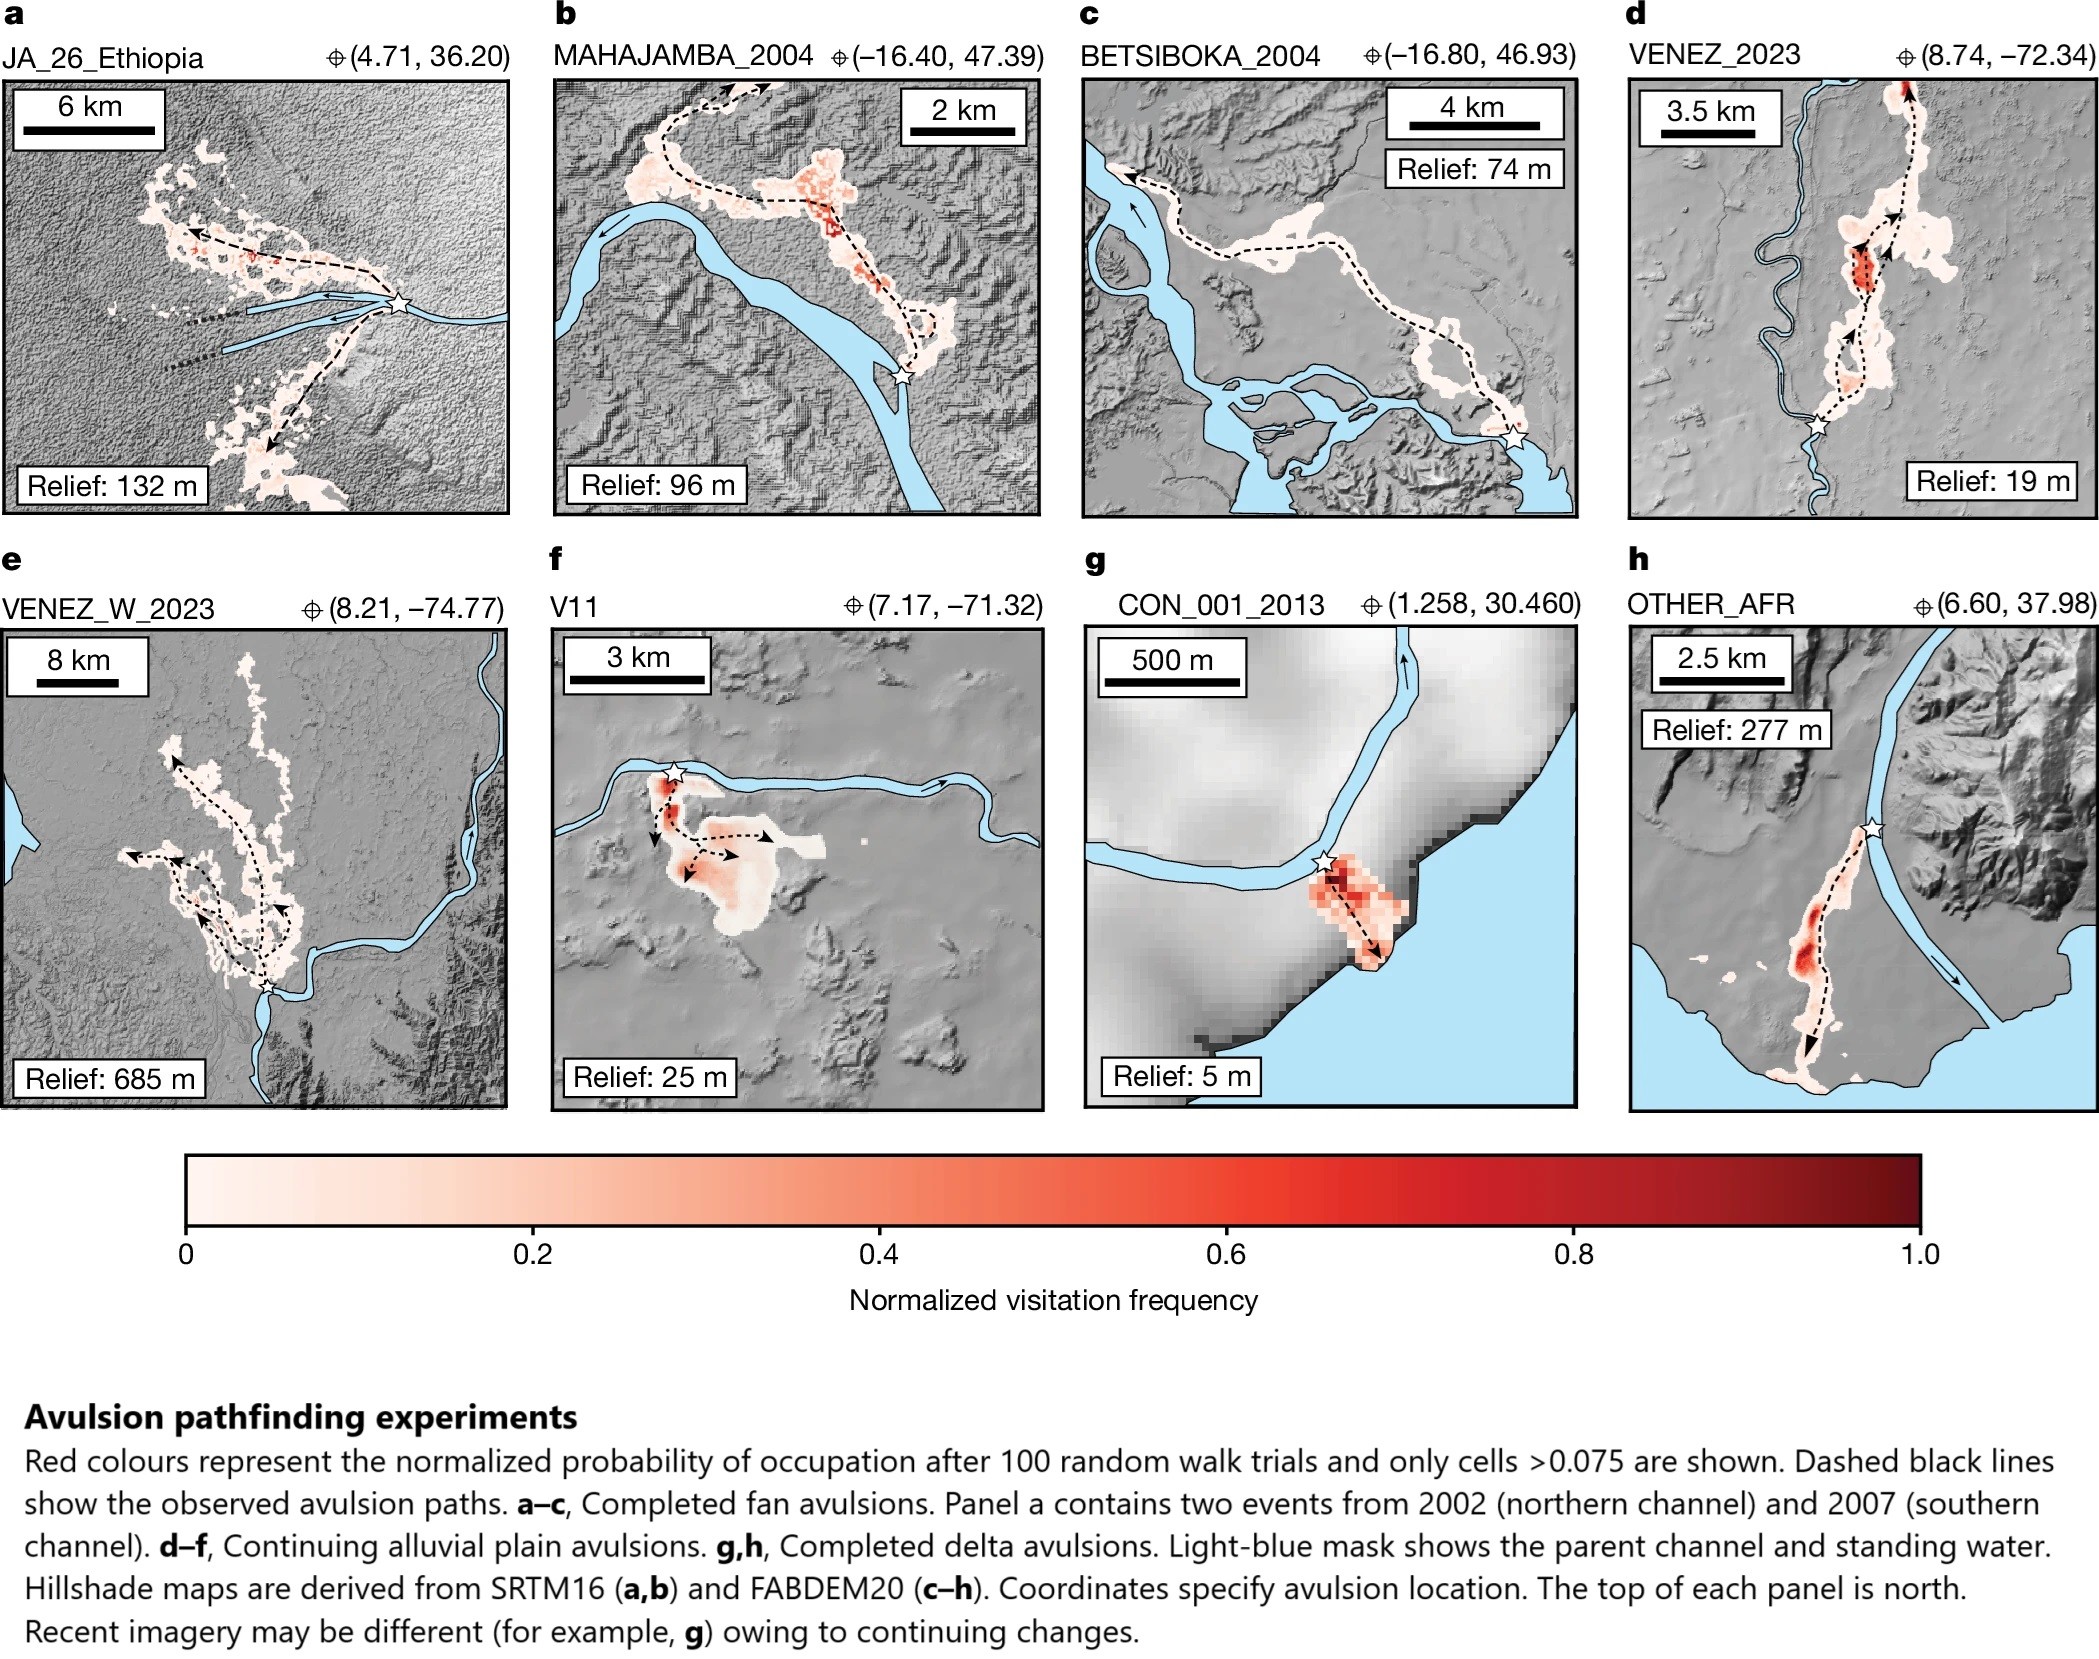
Rules Of River Avulsion Change Downstream
--
https://doi.org/10.1038/s41586-024-07964-2 <-- shared paper
--
#GIS #spatial #mapping #river #water #hydrology #avulsion #geomorphology #geomorphometry #floodplain #flood #flooding #course #risk #hazard #elevation #topography #hydromorphic #hydrospatial #model #modeling #factors #coast #coastal #mountain #fan #riskassessment #global #spatialanalysis #management #mitigation #prediction #remotesensing #ICESat2 #FABDEM #Copernicus #algorithm #fluvial #alluvial #sediment #alluvium #sediment #machinelearning #graphdata #geostatistics #spatiotemporal
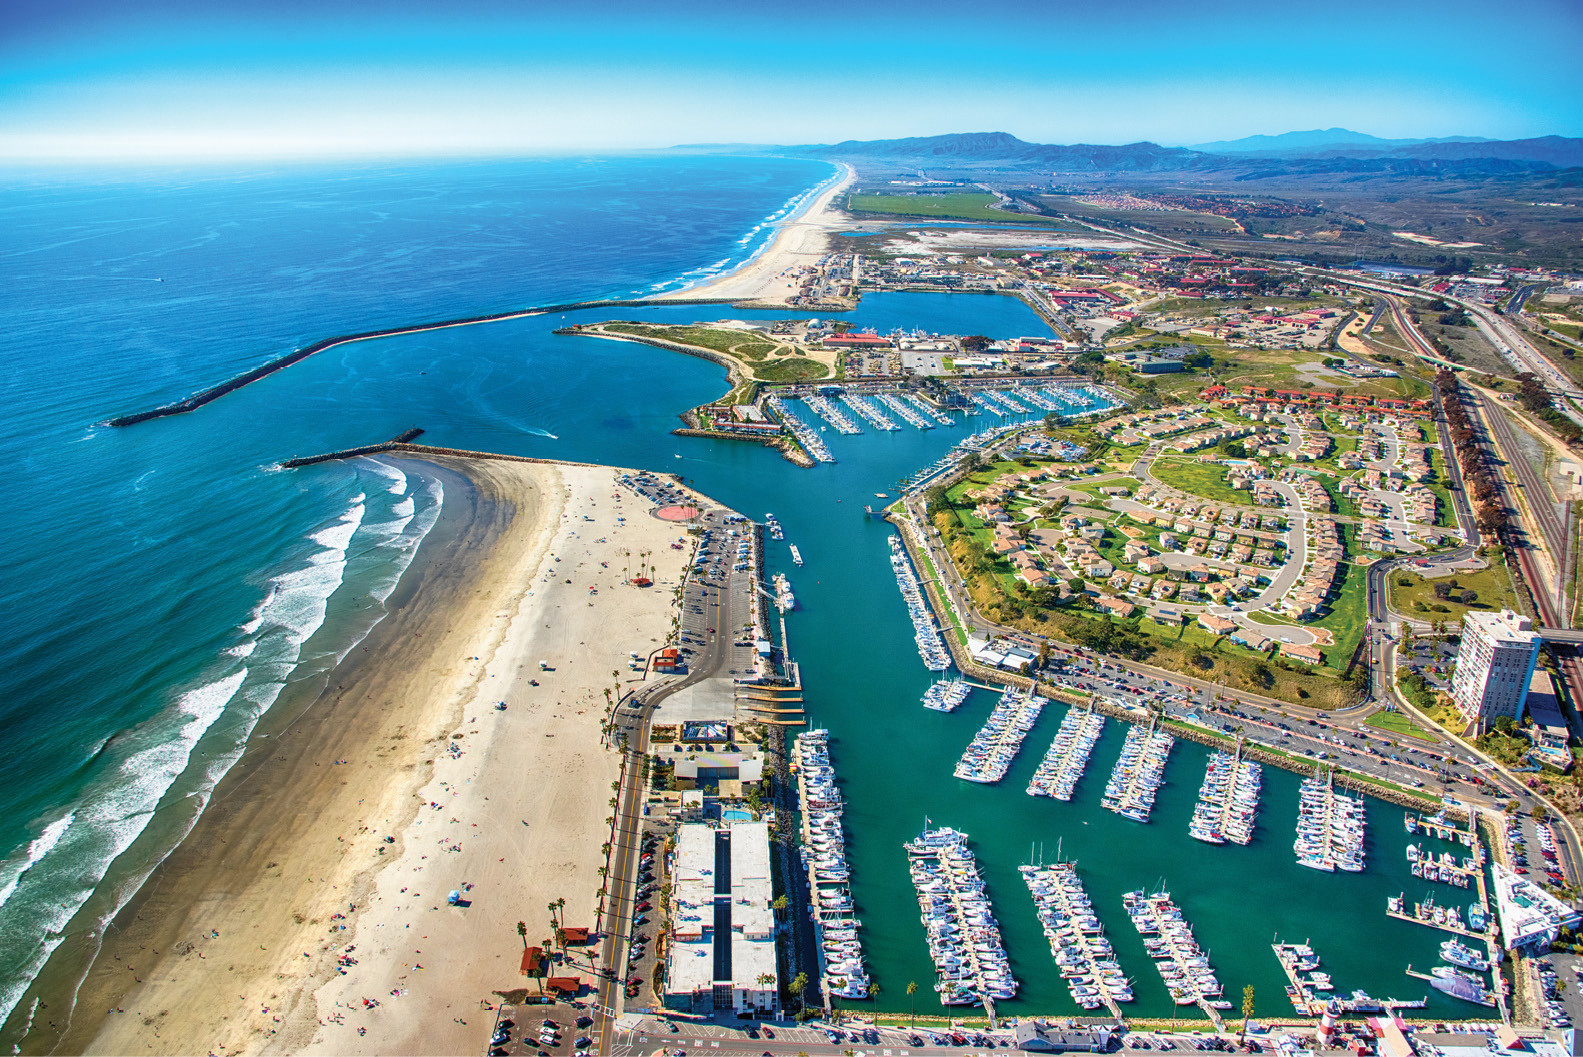
Eyes on Earth Episode 120 – Mapping the California Coastline [podcast]
--
https://www.usgs.gov/centers/eros/science/eyes-earth-episode-120-mapping-california-coastline <-- shared link to podcast
--
https://doi.org/10.1017/cft.2022.4 <-- shared paper
--
#GIS #spatial #mapping #research #remotesensing #earthobservation #water #hydrology #marine #hydrospatial #bathymetry #topobathy #elevation #seafloor #landsat #Landsat9 #LandsatNext #resolution #coast #coastline #podcast #interview #California #USA #model #modeling #spatialanalysis #sealevelrise #SLR #sealevel #erosion #climatechange #risk #hazard #opendata #machinelearning #AI #oceangraphy
@USGS | @USGS_EROS

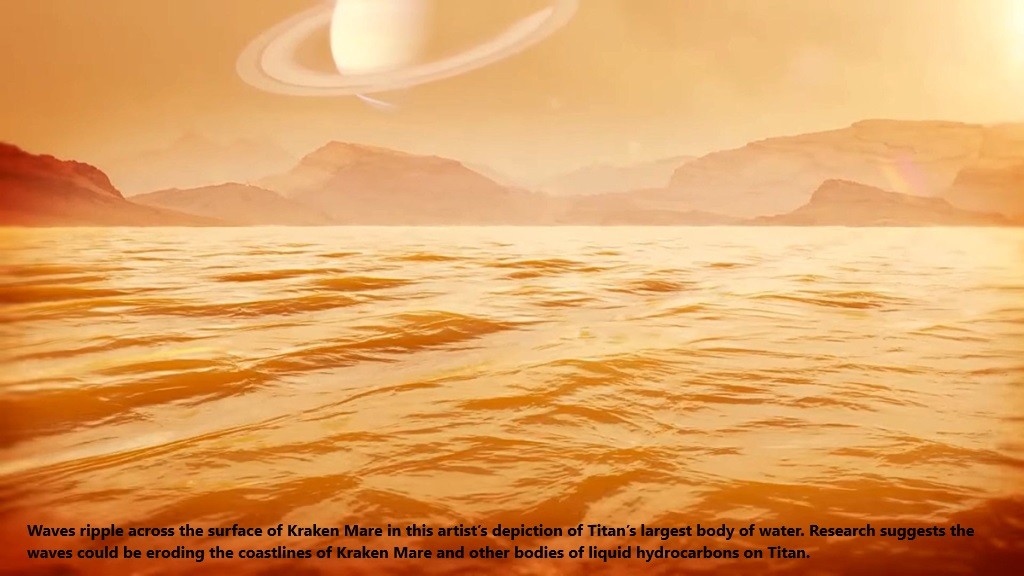
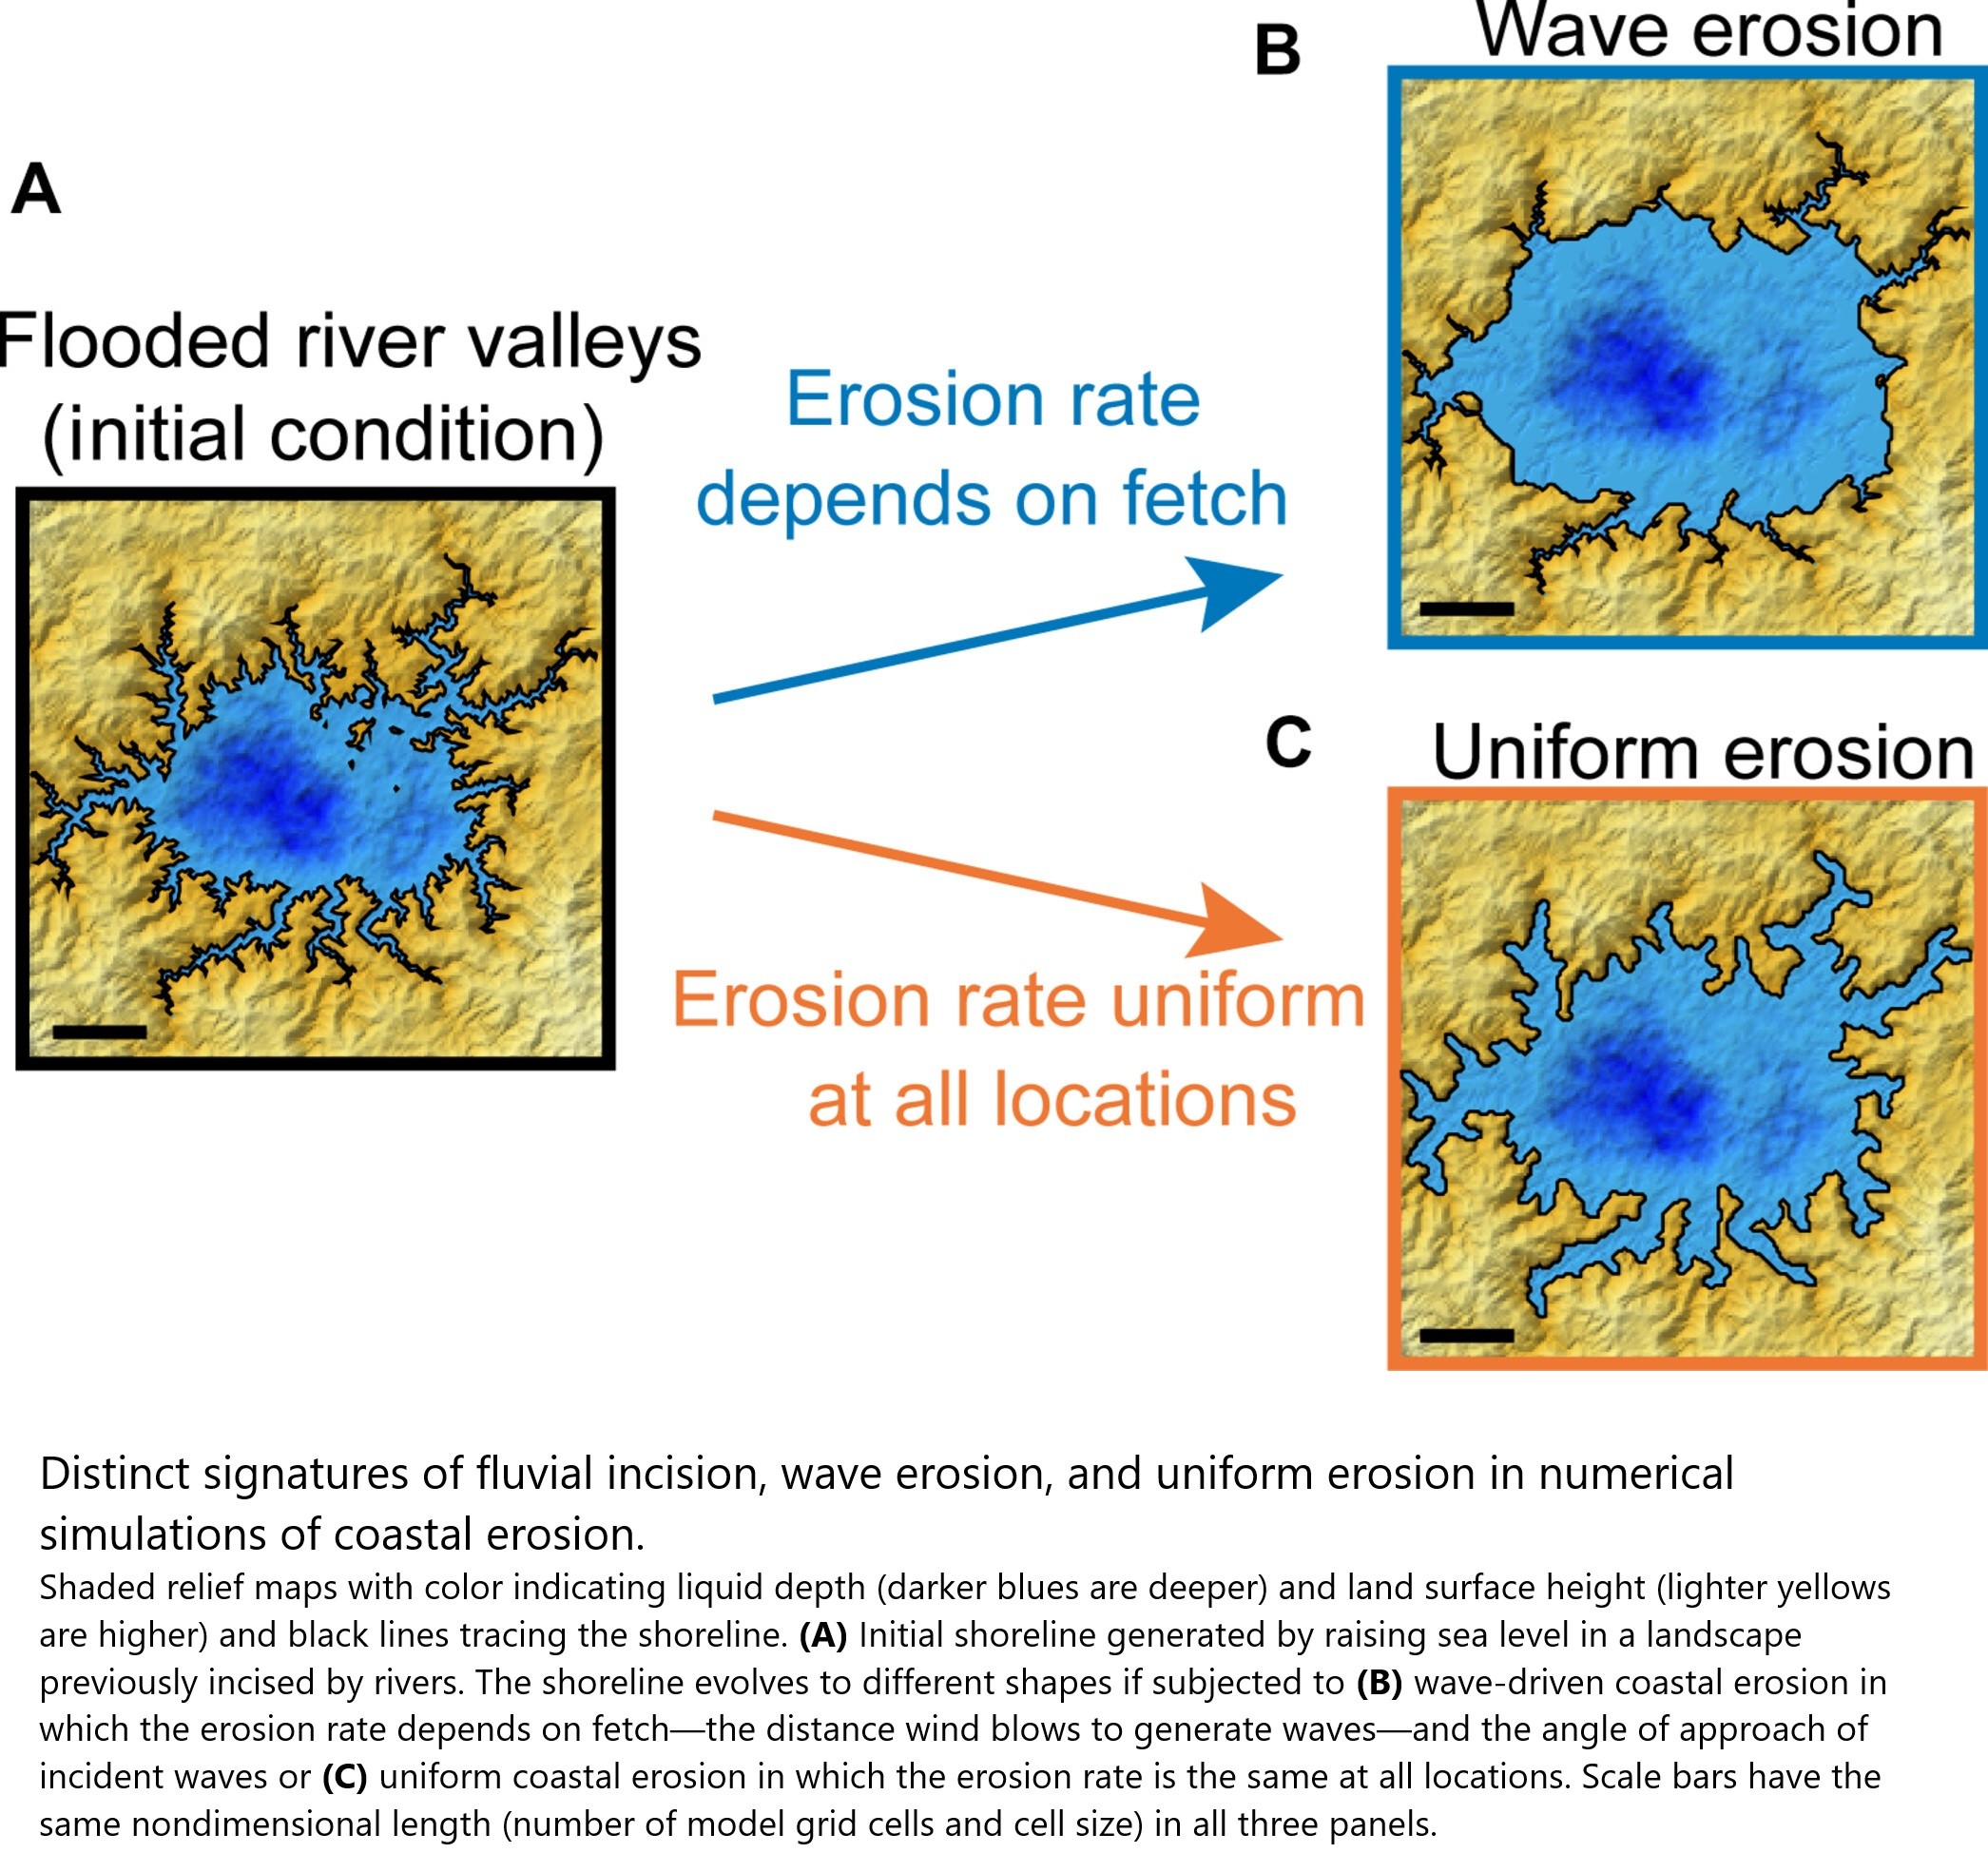
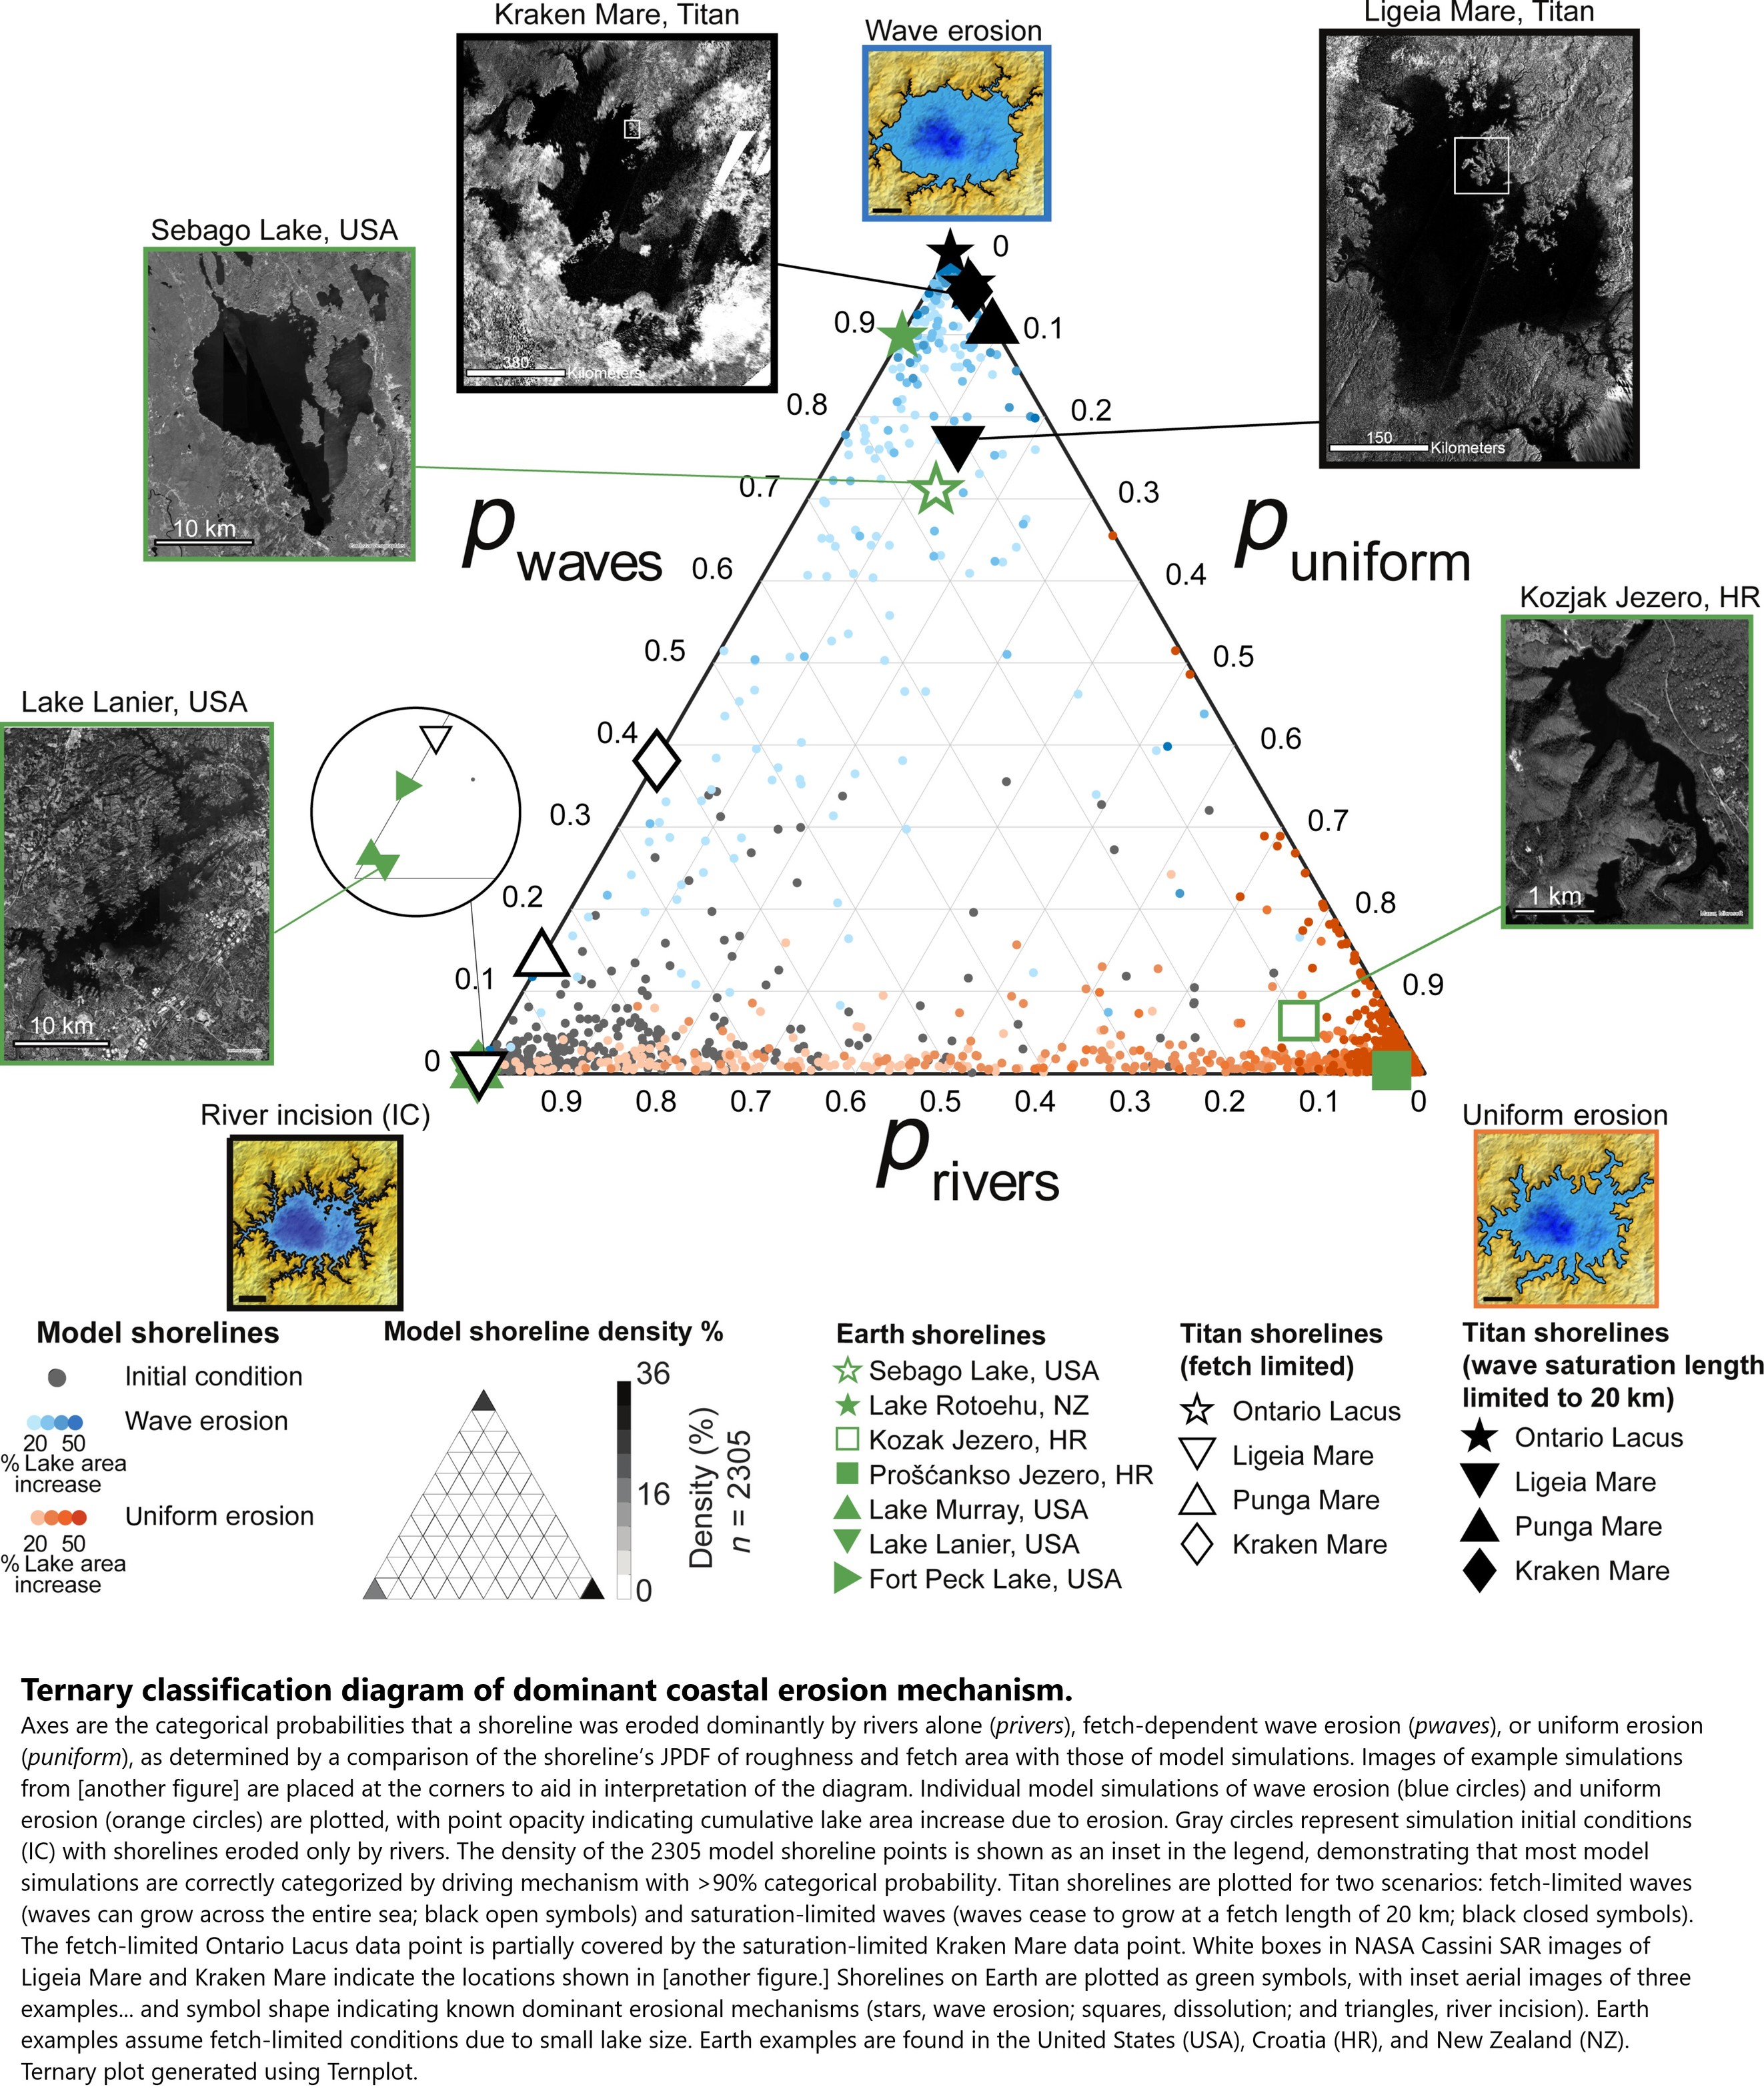
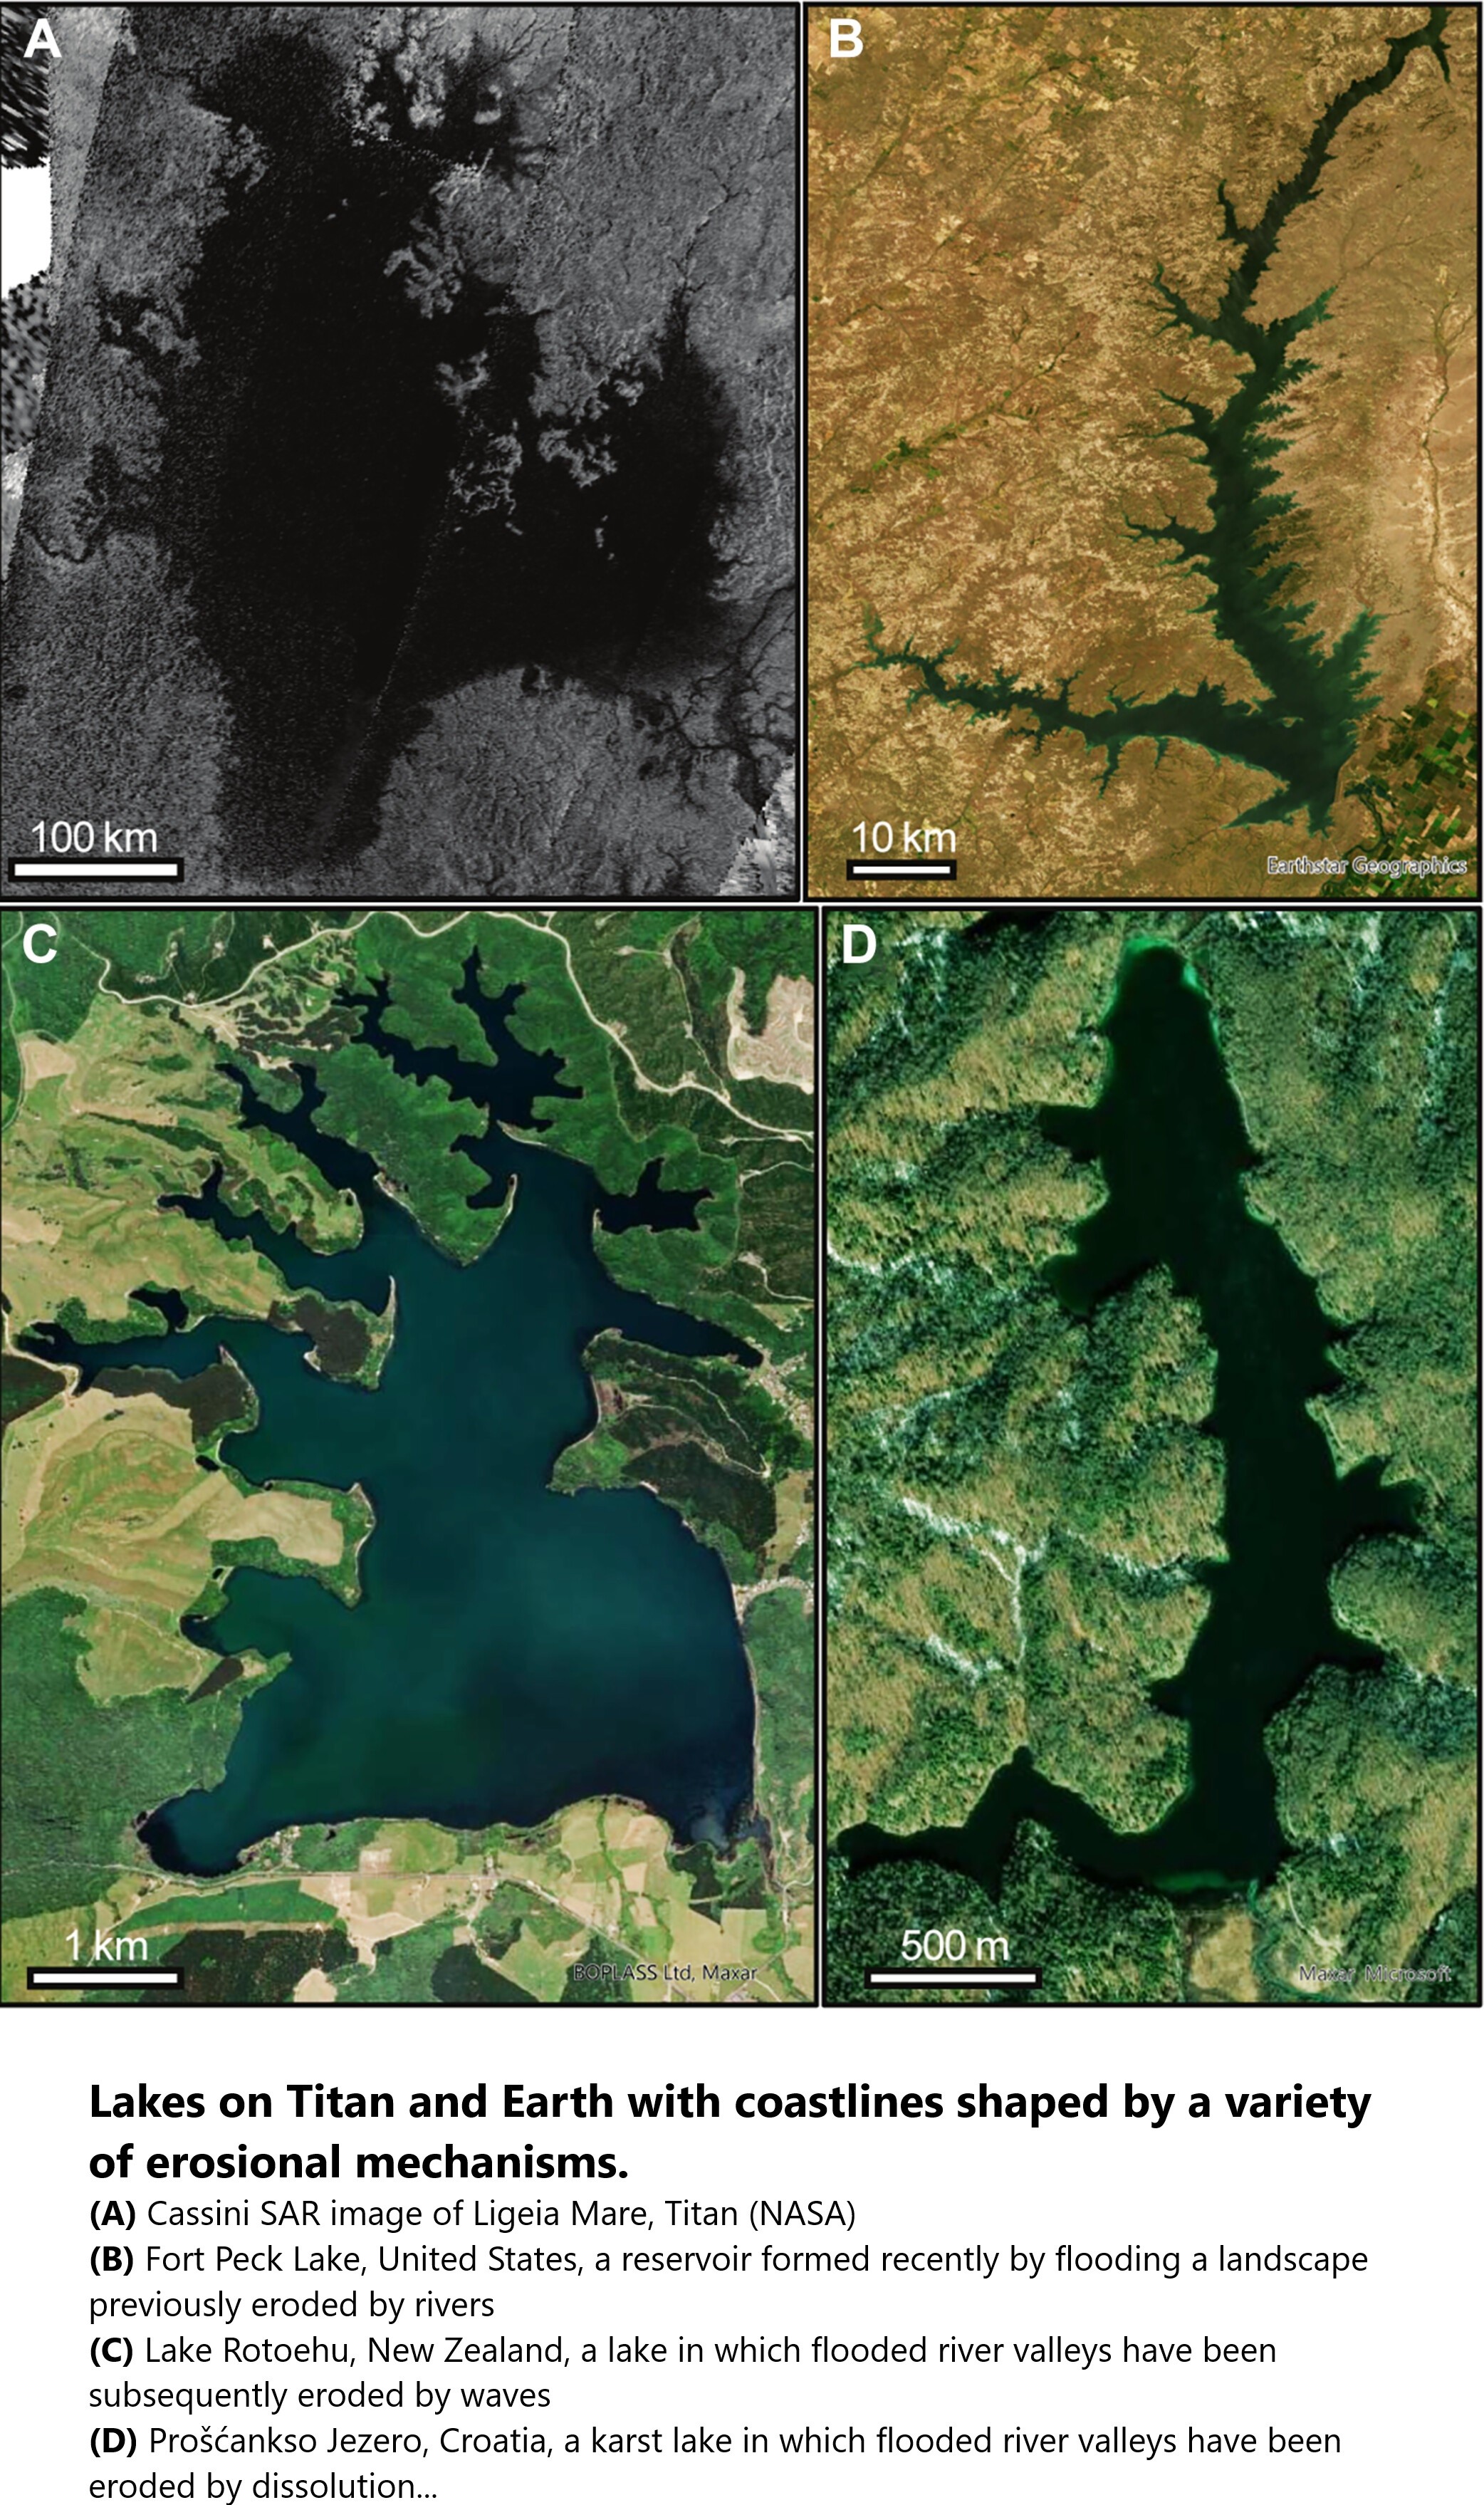
Mapping Confirms Waves On Saturn’s Moon [Titan] [geomorphometry / spatial analysis]
--
https://www.australiangeographic.com.au/topics/science-environment/2024/09/mapping-confirms-waves-on-saturns-moon/ <-- shared technical article
--
https://eos.org/articles/waves-may-be-crashing-on-titans-shores <-- shared technical article
--
https://doi.org/10.1126/sciadv.adn4192 <-- shared paper
--
#GIS #spatial #mapping #astrogeology #saturn #moon #titan #remotesensing #radar #methane #ethane #NASA #cassini #lake #river #estuary #astrohydrology #model #modeling #hydrospatial #tidal #erosion #geology #geomorphology #geomorphometry #spatialanalysis #waves #surge #coastal #coastal #landforms #coastline #patterns
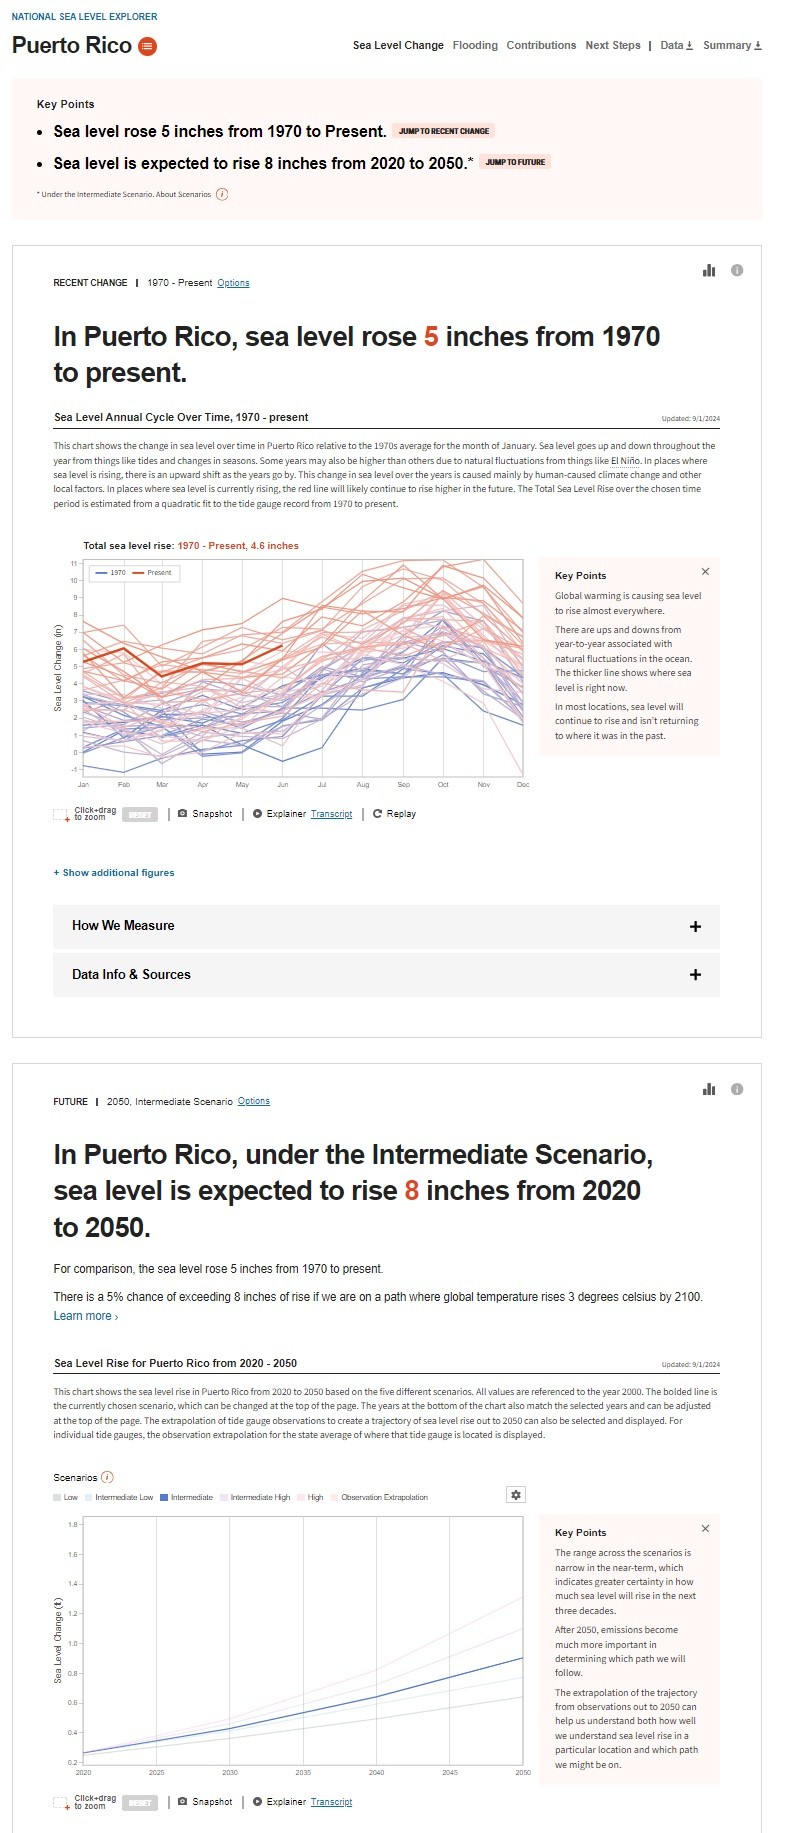
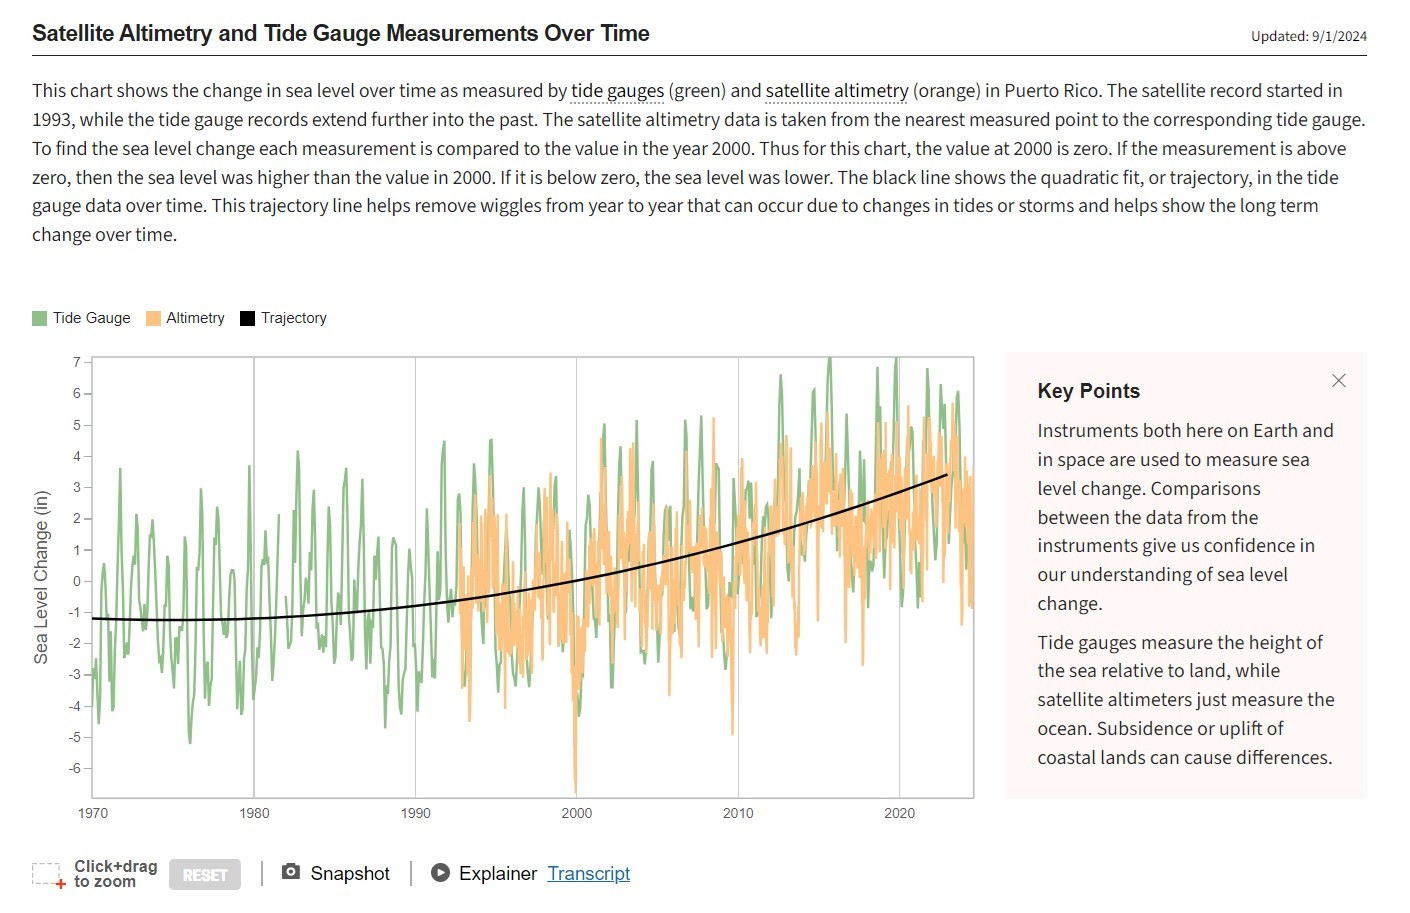
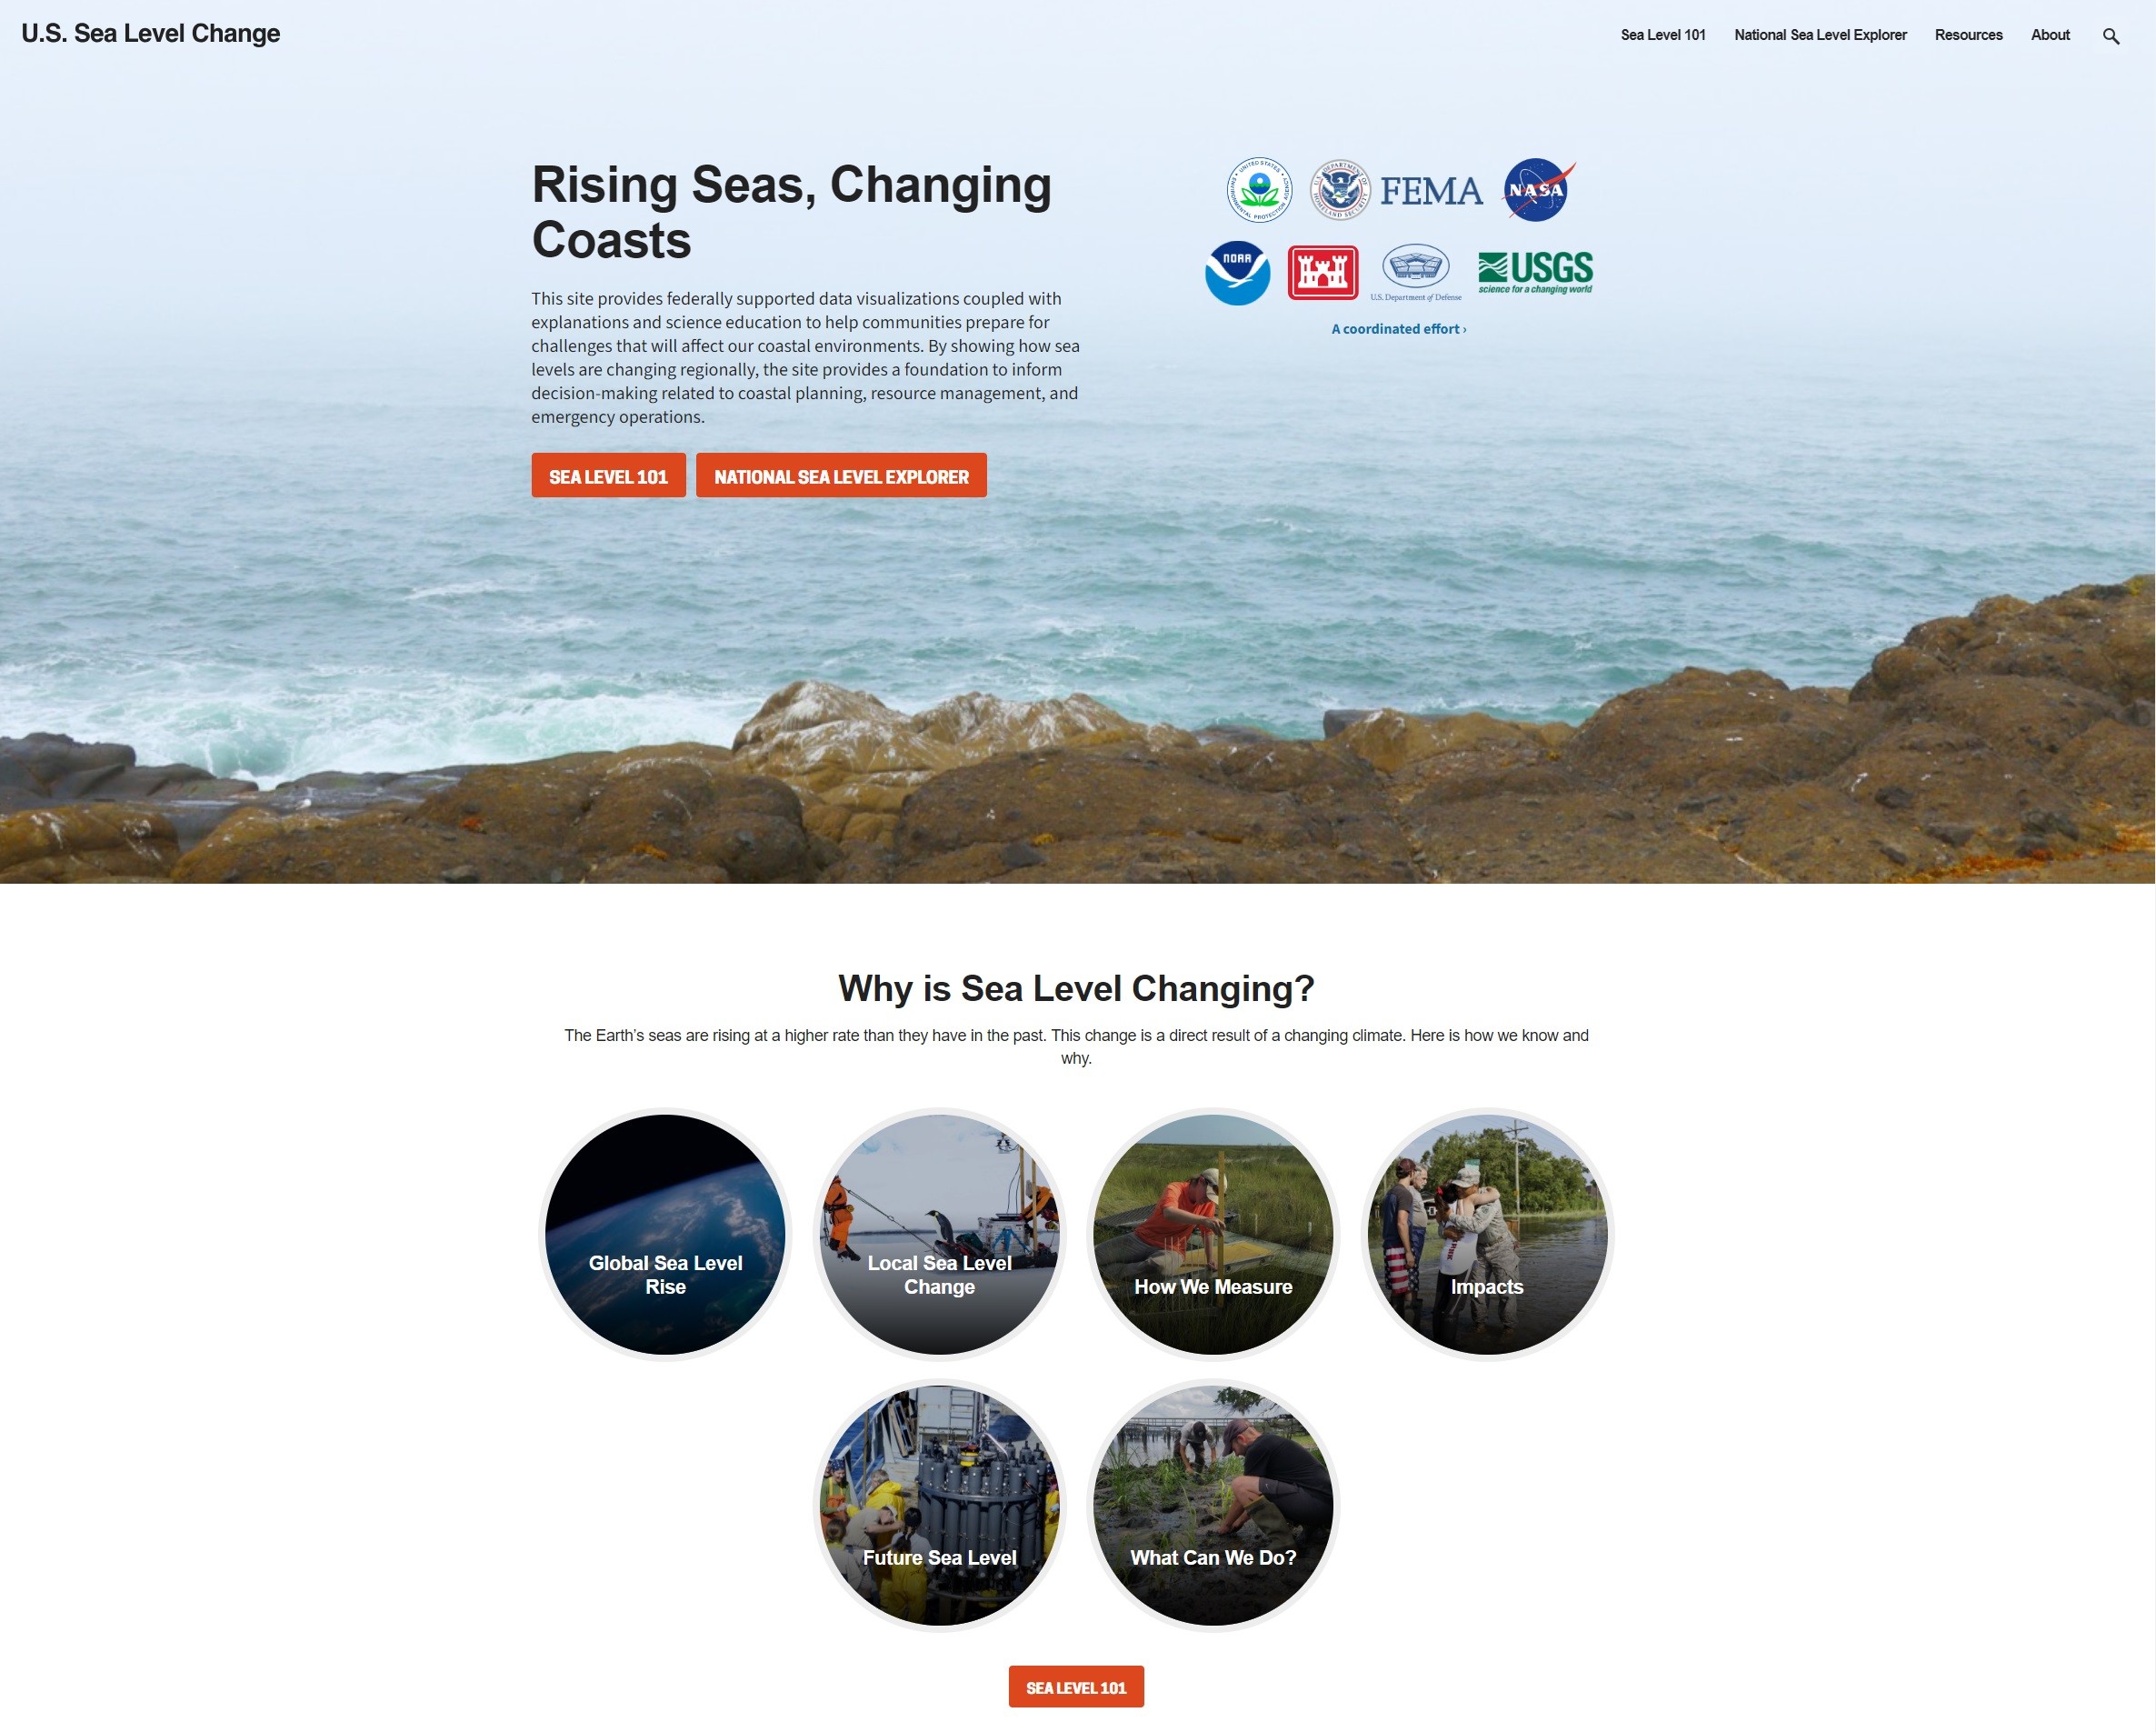
U.S. Sea Level Change - Rising Seas, Changing Coasts [web resources/ Federal website]
--
https://sealevel.globalchange.gov/ <-- shared web resource
--
https://www.nasa.gov/earth/climate-change/nasa-helps-build-new-federal-sea-level-rise-website/ <-- NASA press release
--
#GIS #spatial #mapping #spatialanalysis #spatiotemporal #risk #hazard #infrastructure #habitats #ecosystems #sealevel #sealevelrise #SLR #climatechange #webresources #spatialdata #opendata #coast #coastal #communities #USGCRP #US #USA #model #modeling #projections #flooding #innundation #water #hydrology #hydrospatial #interactive #multimedia #educational #management #planning #impacts #humanimpacts #coastalengineering #geomorphometry
@USEPA @fema @nasa @NOAA @USACEHQ @DeptofDefense @USGS @DHSgov
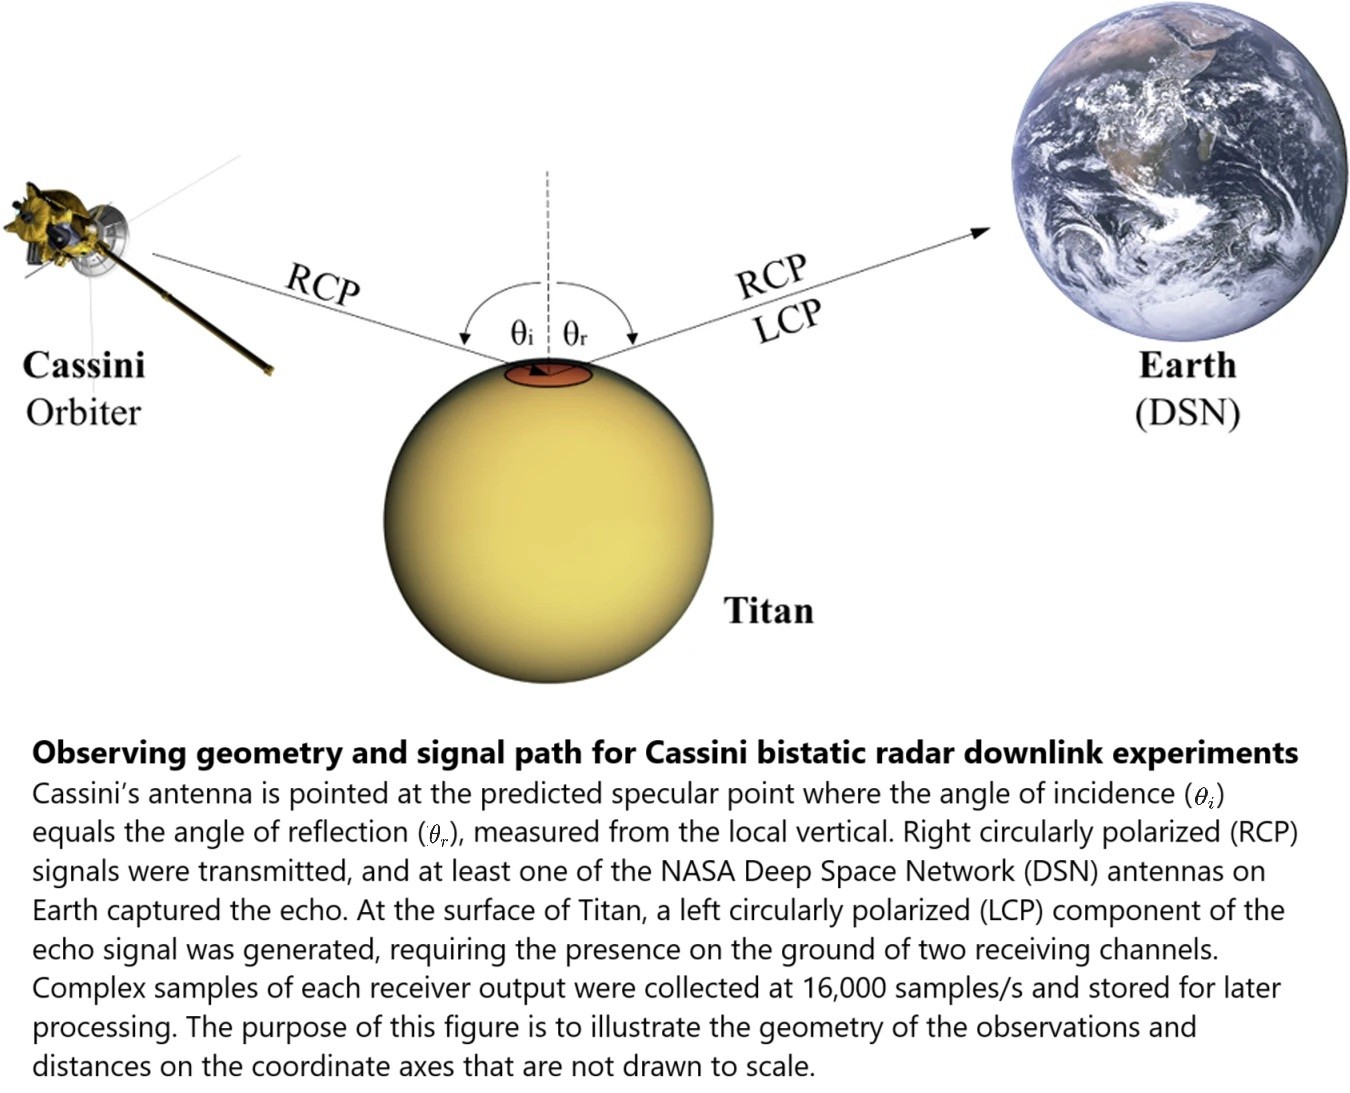
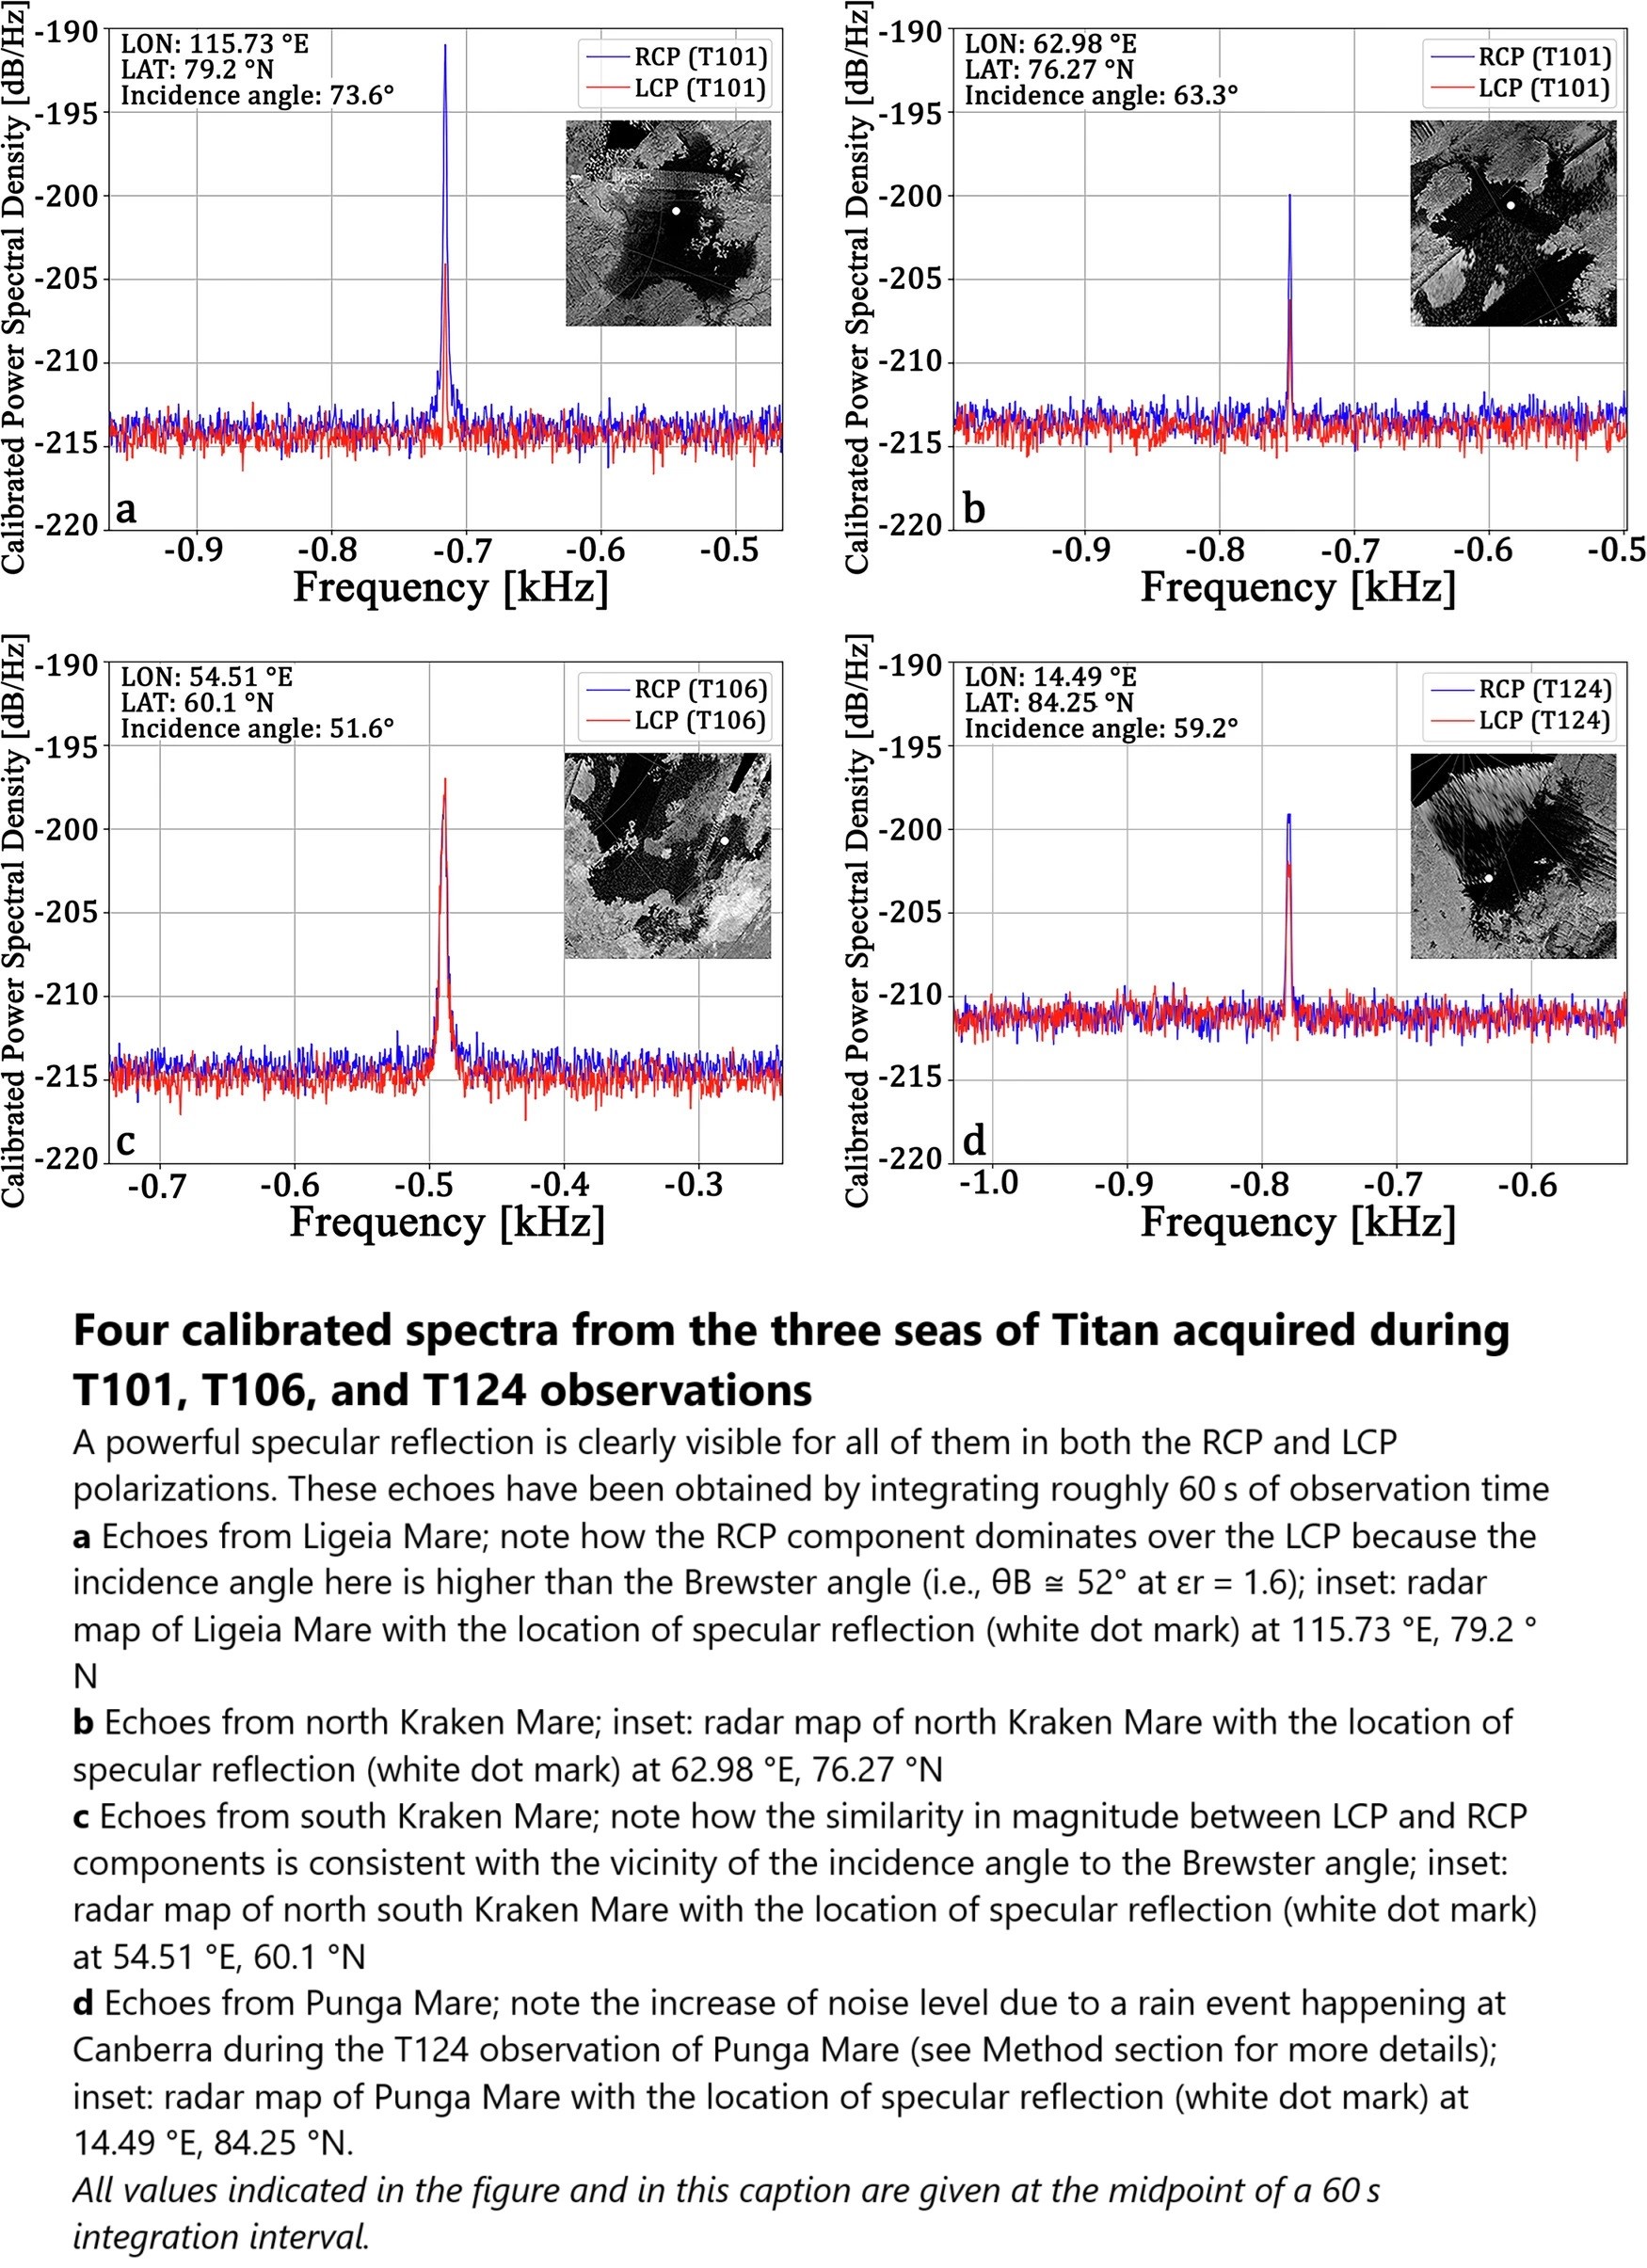
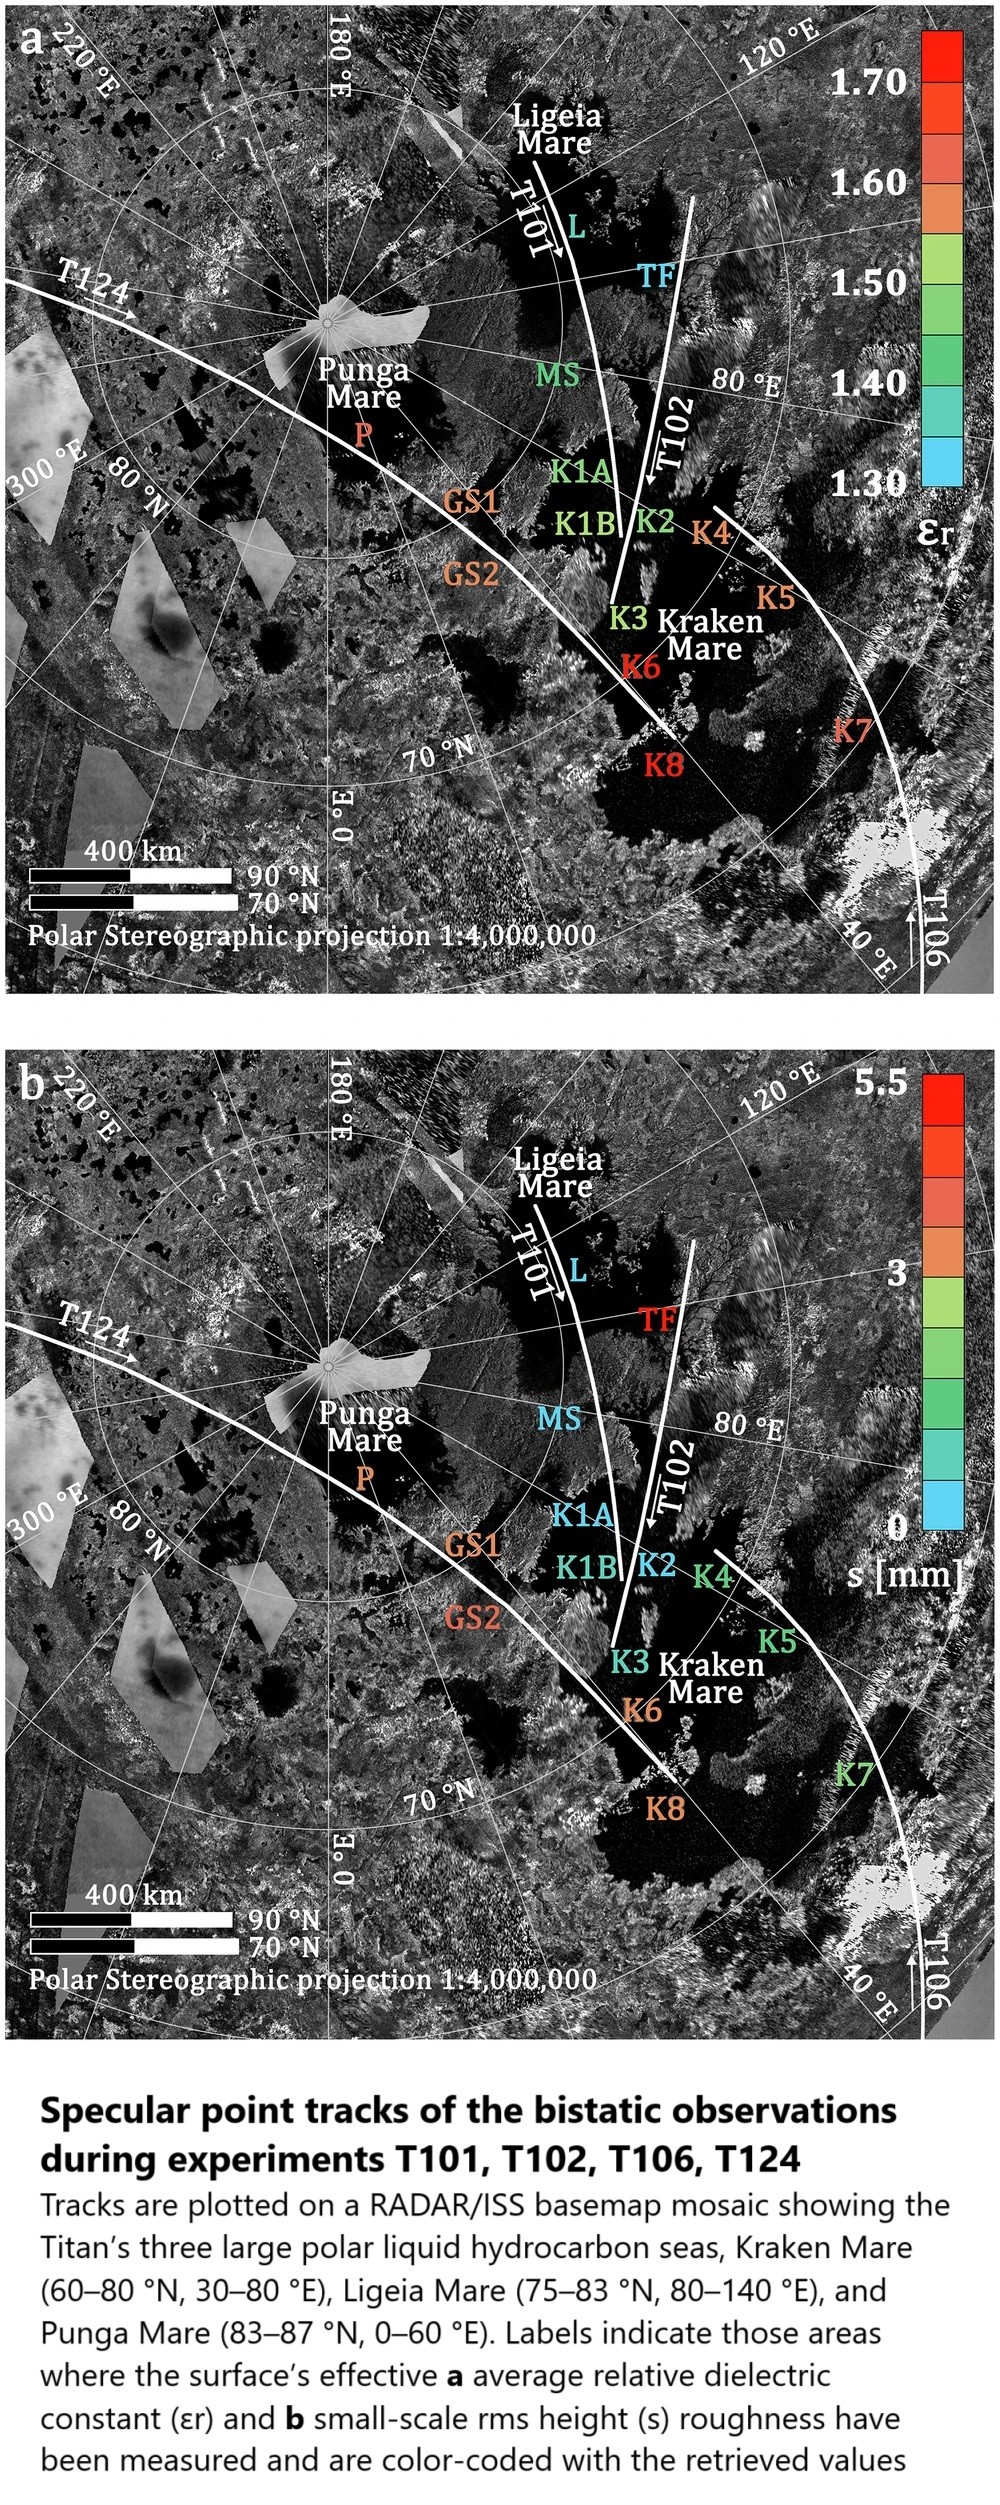
Saturn's Moon Titan Has An Equivalent Of Freshwater Rivers And Salty Oceans
--
https://www.newscientist.com/article/2439695-moon-of-saturn-has-an-equivalent-of-freshwater-rivers-and-salty-oceans/ <-- shared technical article
--
https://doi.org/10.1038/s41467-024-49837-2 <-- shared paper
--
#GIS #spatial #mapping #astrogeology #saturn #moon #titan #moon #remotesensing #radar #methane #ethane #NASA #cassini #lake #river #estuary #astrohydrology #DeepSpaceNetwork #model #modeling #hydrospatial #tidal
![compiled images - False-color, medium-resolution Cassini synthetic aperture radar mosaic of Titan's north polar region, showing hydrocarbon seas, lakes and tributary networks. Blue coloring indicates low radar reflectivity areas, caused by bodies of liquid ethane, methane and dissolved nitrogen.[1] Kraken Mare, the largest sea on Titan, is at lower left. Ligeia Mare is the large body below the pole, and Punga Mare at half its size is just left of the pole. White areas have not been imaged.](https://files.mastodon.social/cache/media_attachments/files/113/167/889/436/751/513/original/07923948dbb17492.jpg)
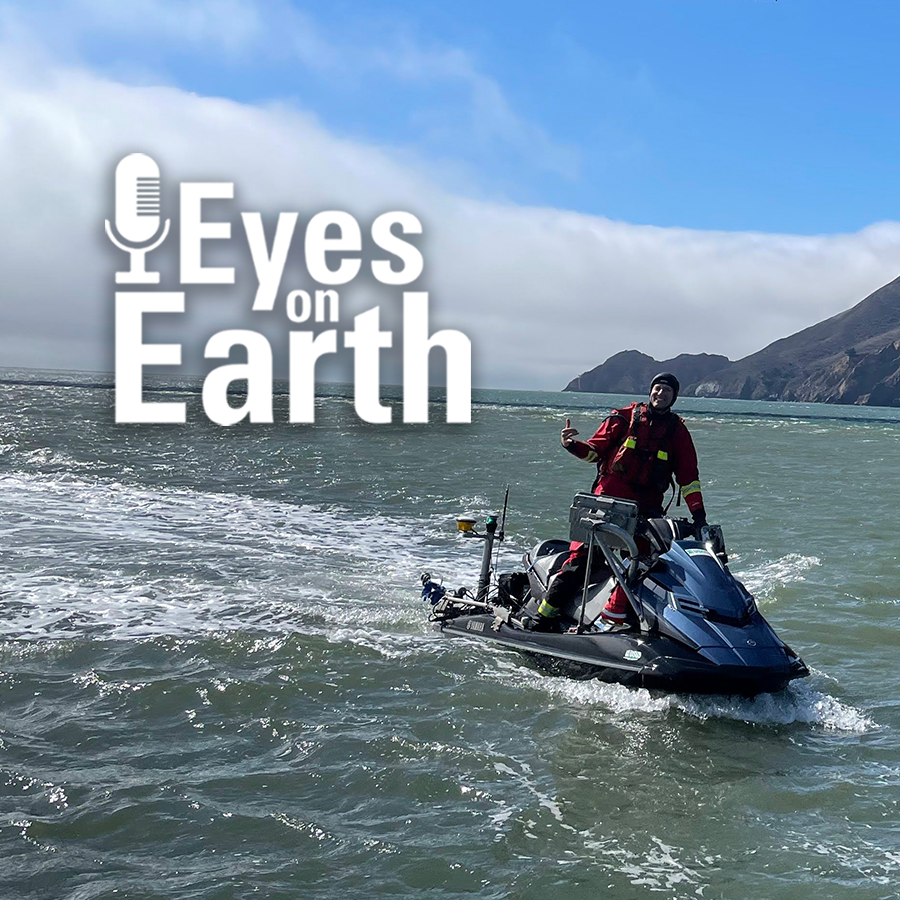
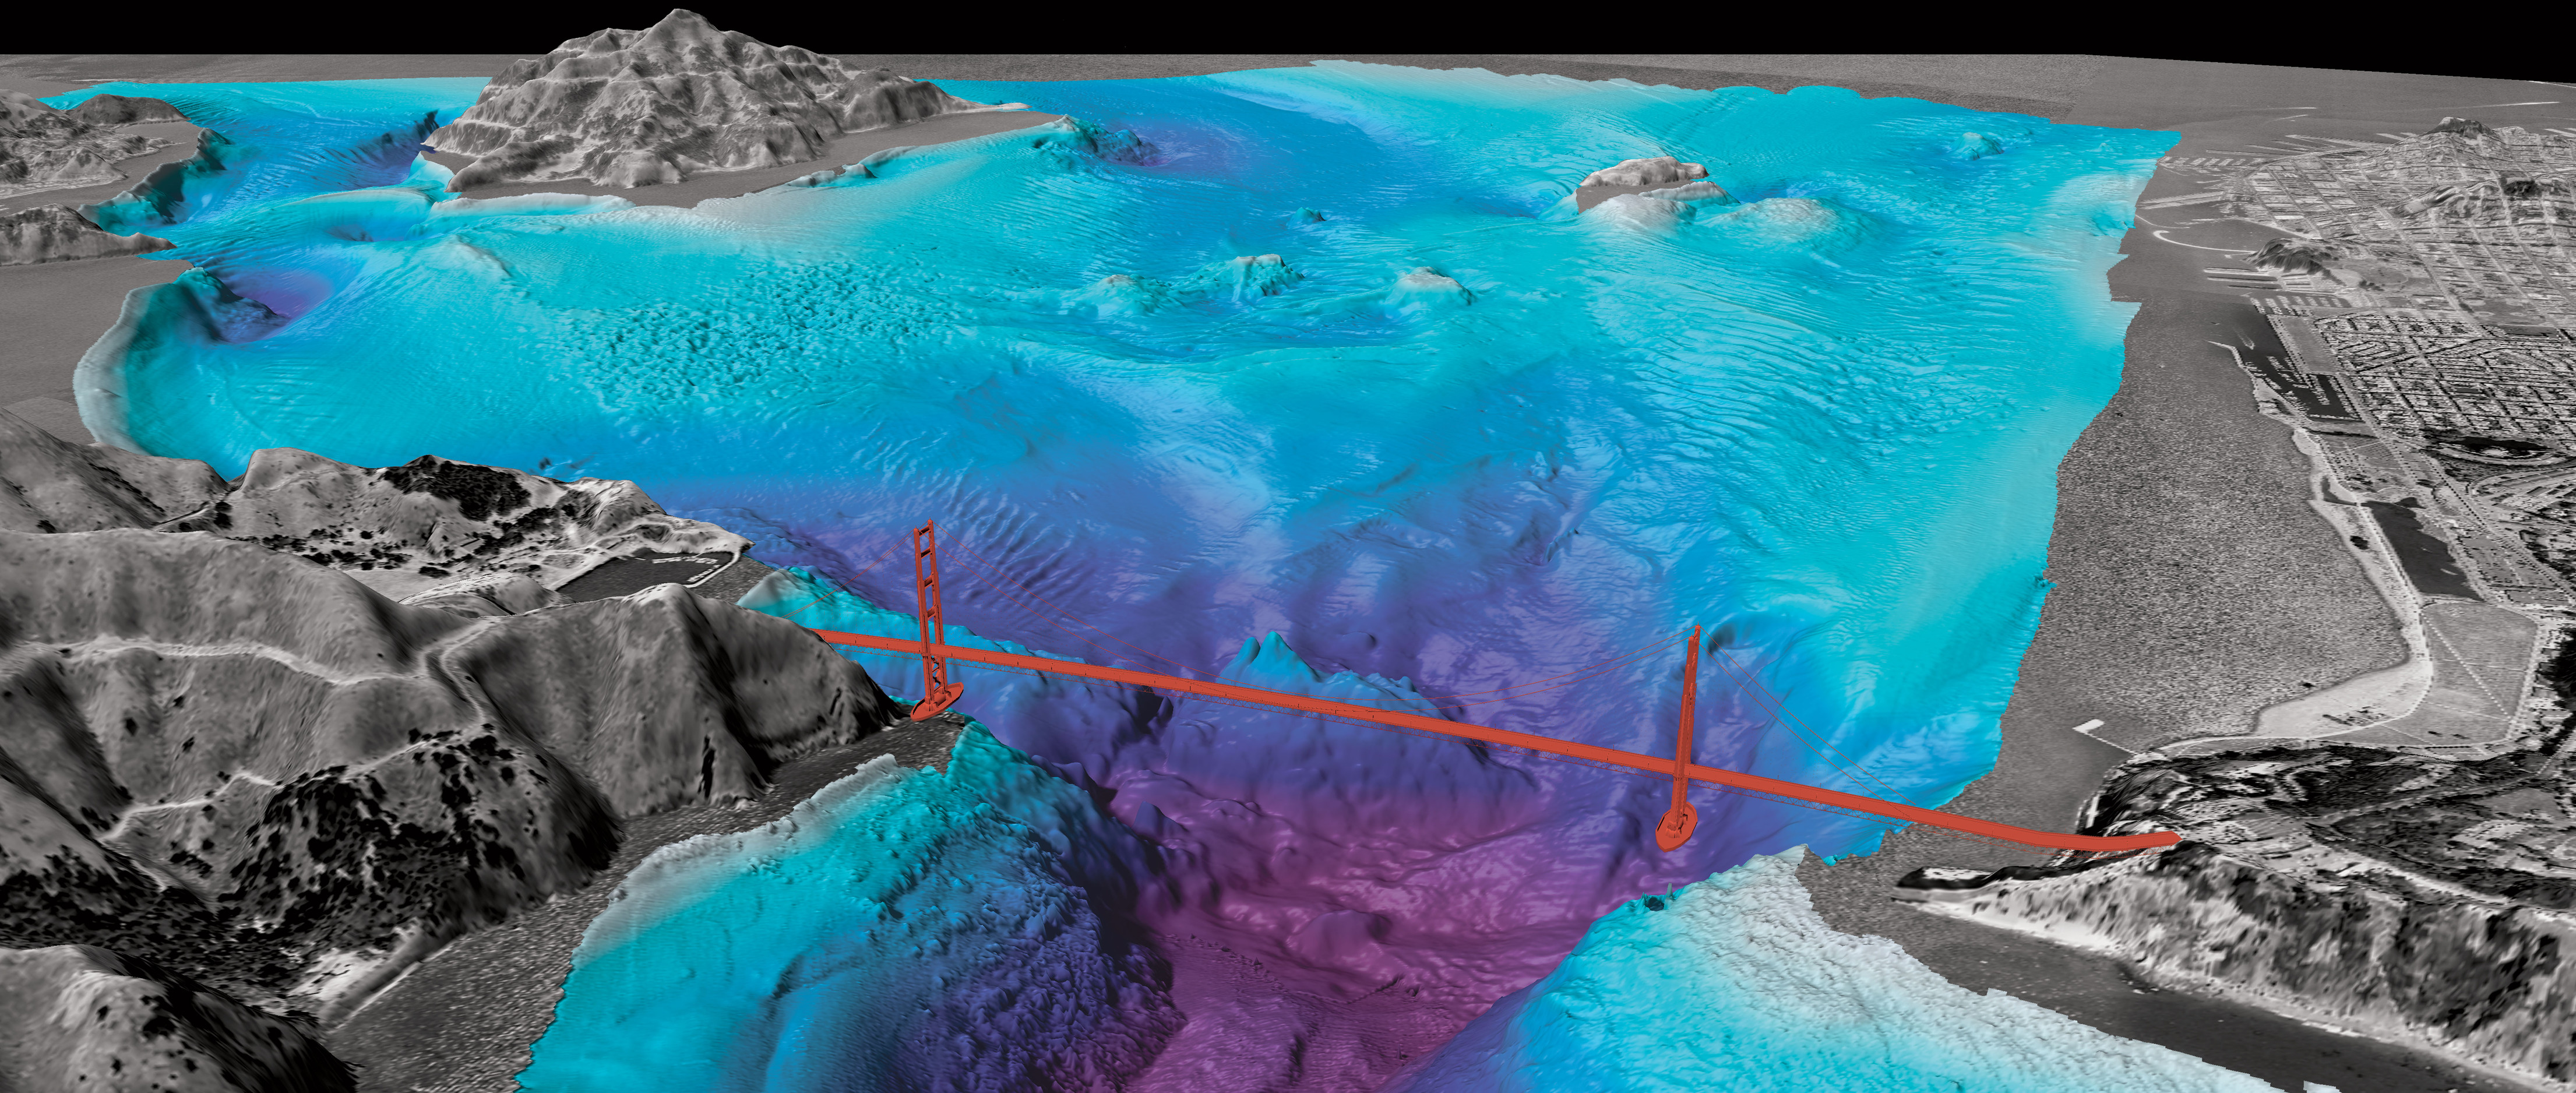
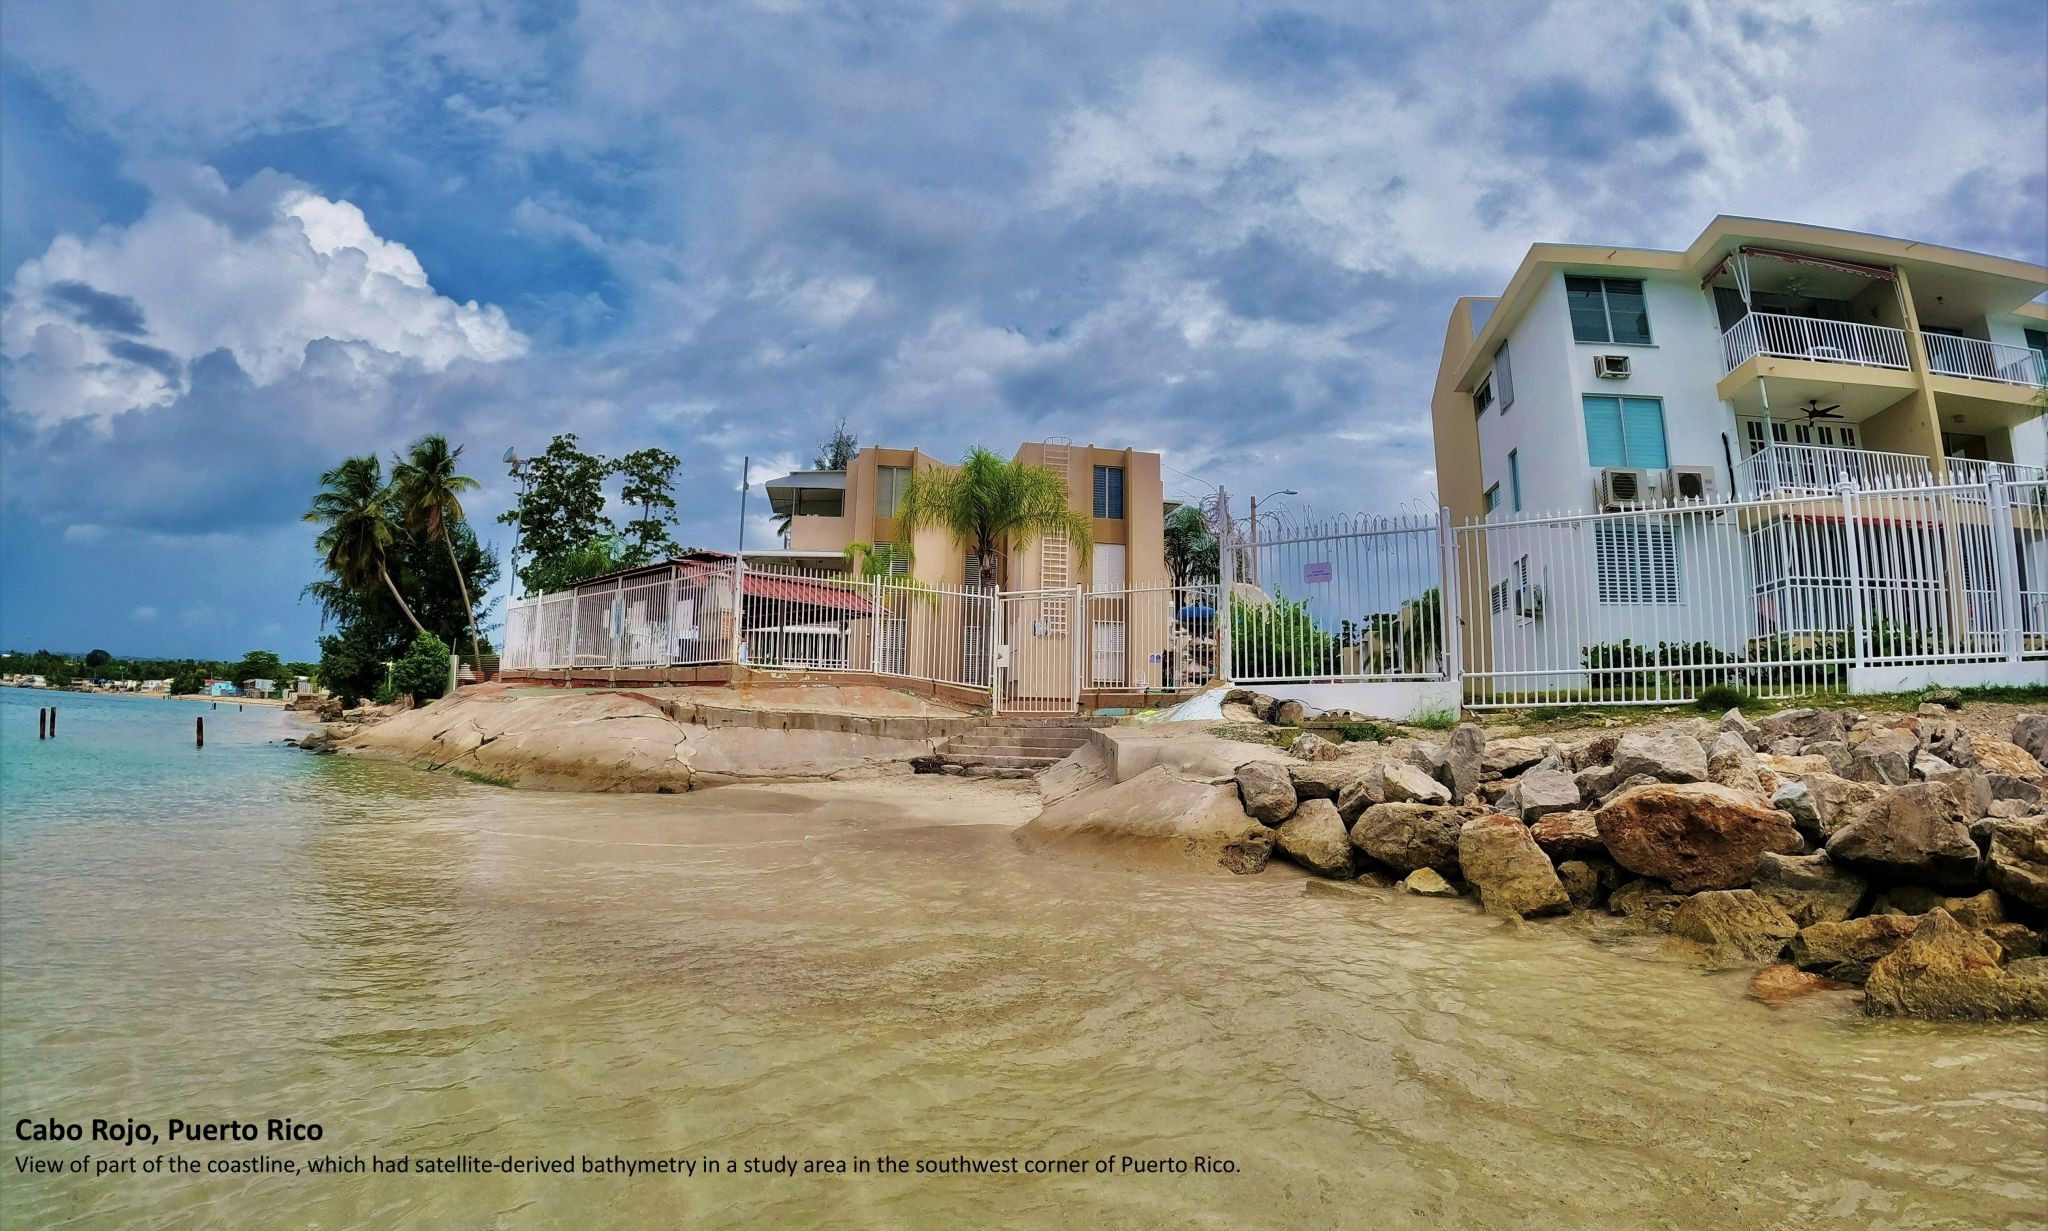
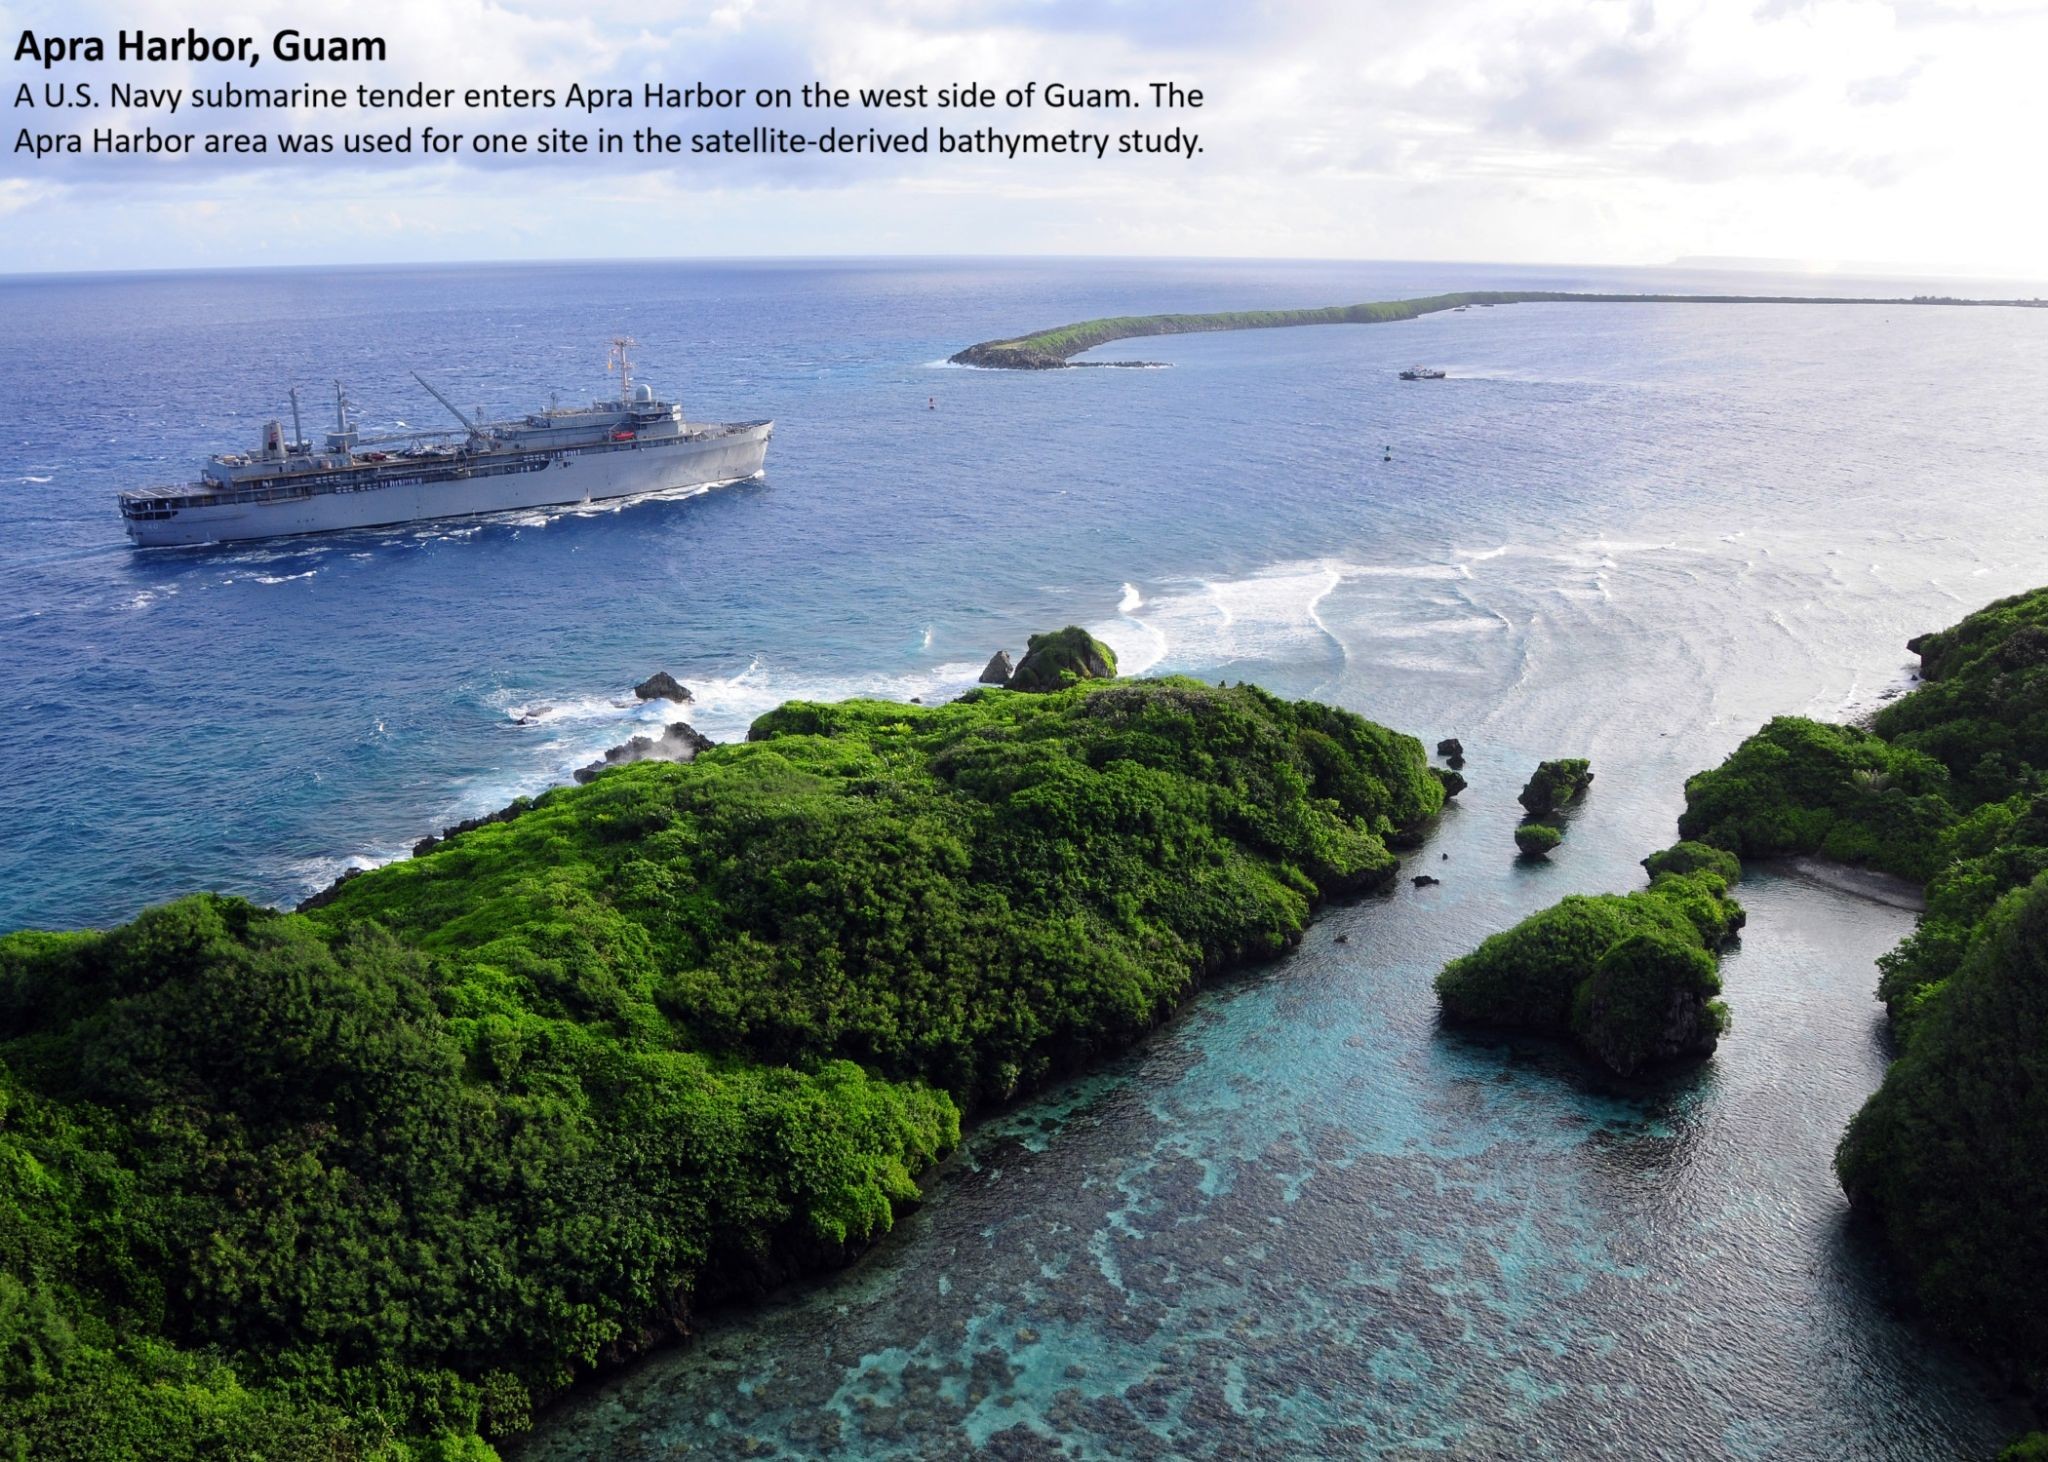
Eyes on Earth Episode 123 – Bathymetry Mapping
--
https://www.usgs.gov/centers/eros/science/eyes-earth-episode-123-bathymetry-mapping <-- shared link to podcast
--
https://www.linkedin.com/posts/gregcocks_gis-spatial-mapping-activity-7214045947876581377-4zcm <-- my earlier overview post
--
#GIS #spatial #mapping #research #remotesensing #earthobservation #landsat #satellite #water #hydrology #marine #hydrospatial #bathymetry #topobathy #elevation #seafloor #Landsat9 #LandsatNext #resolution #PuertoRico #Guam #oceanoptics #atmosphere #coast #coastline #podcast #interview
@USGS @EROS

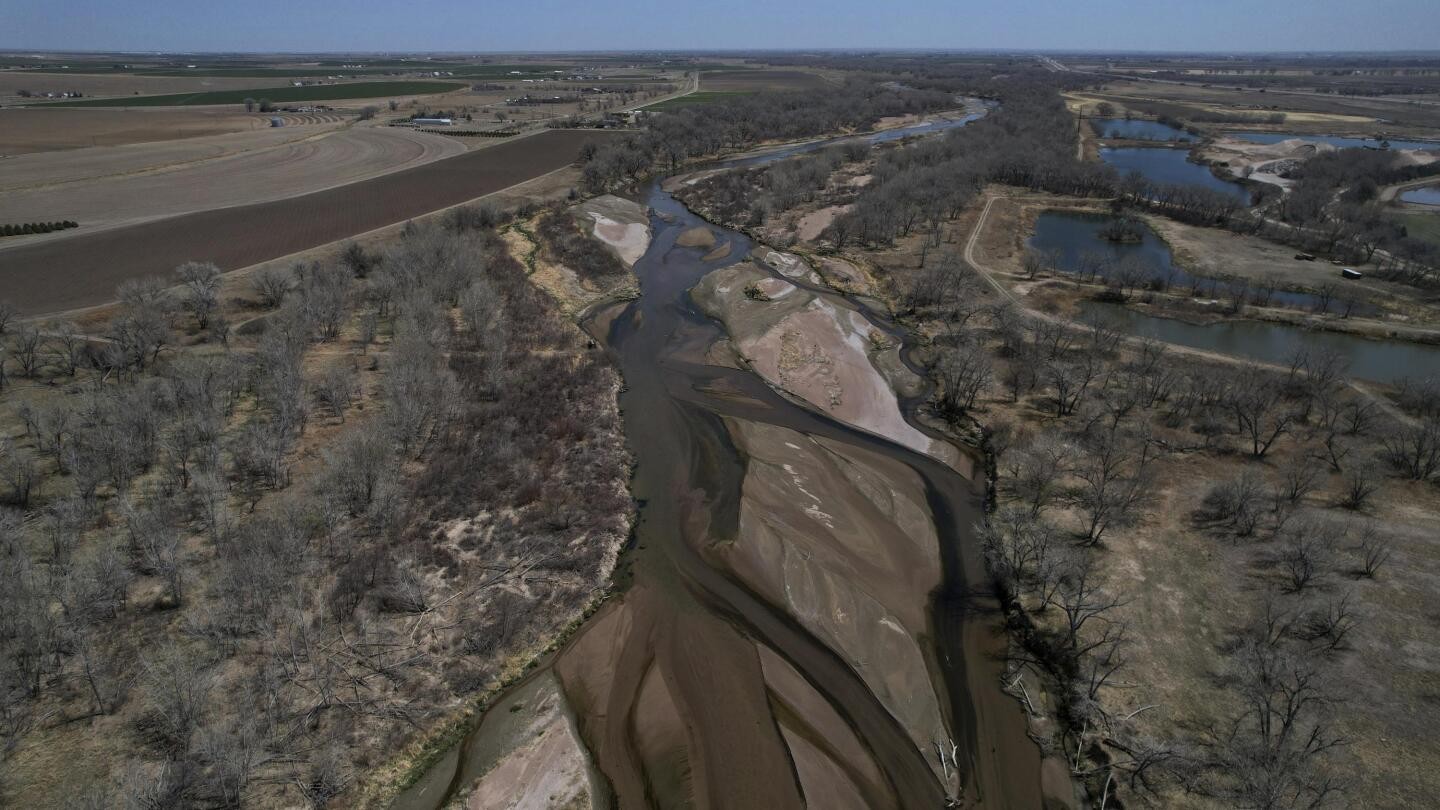
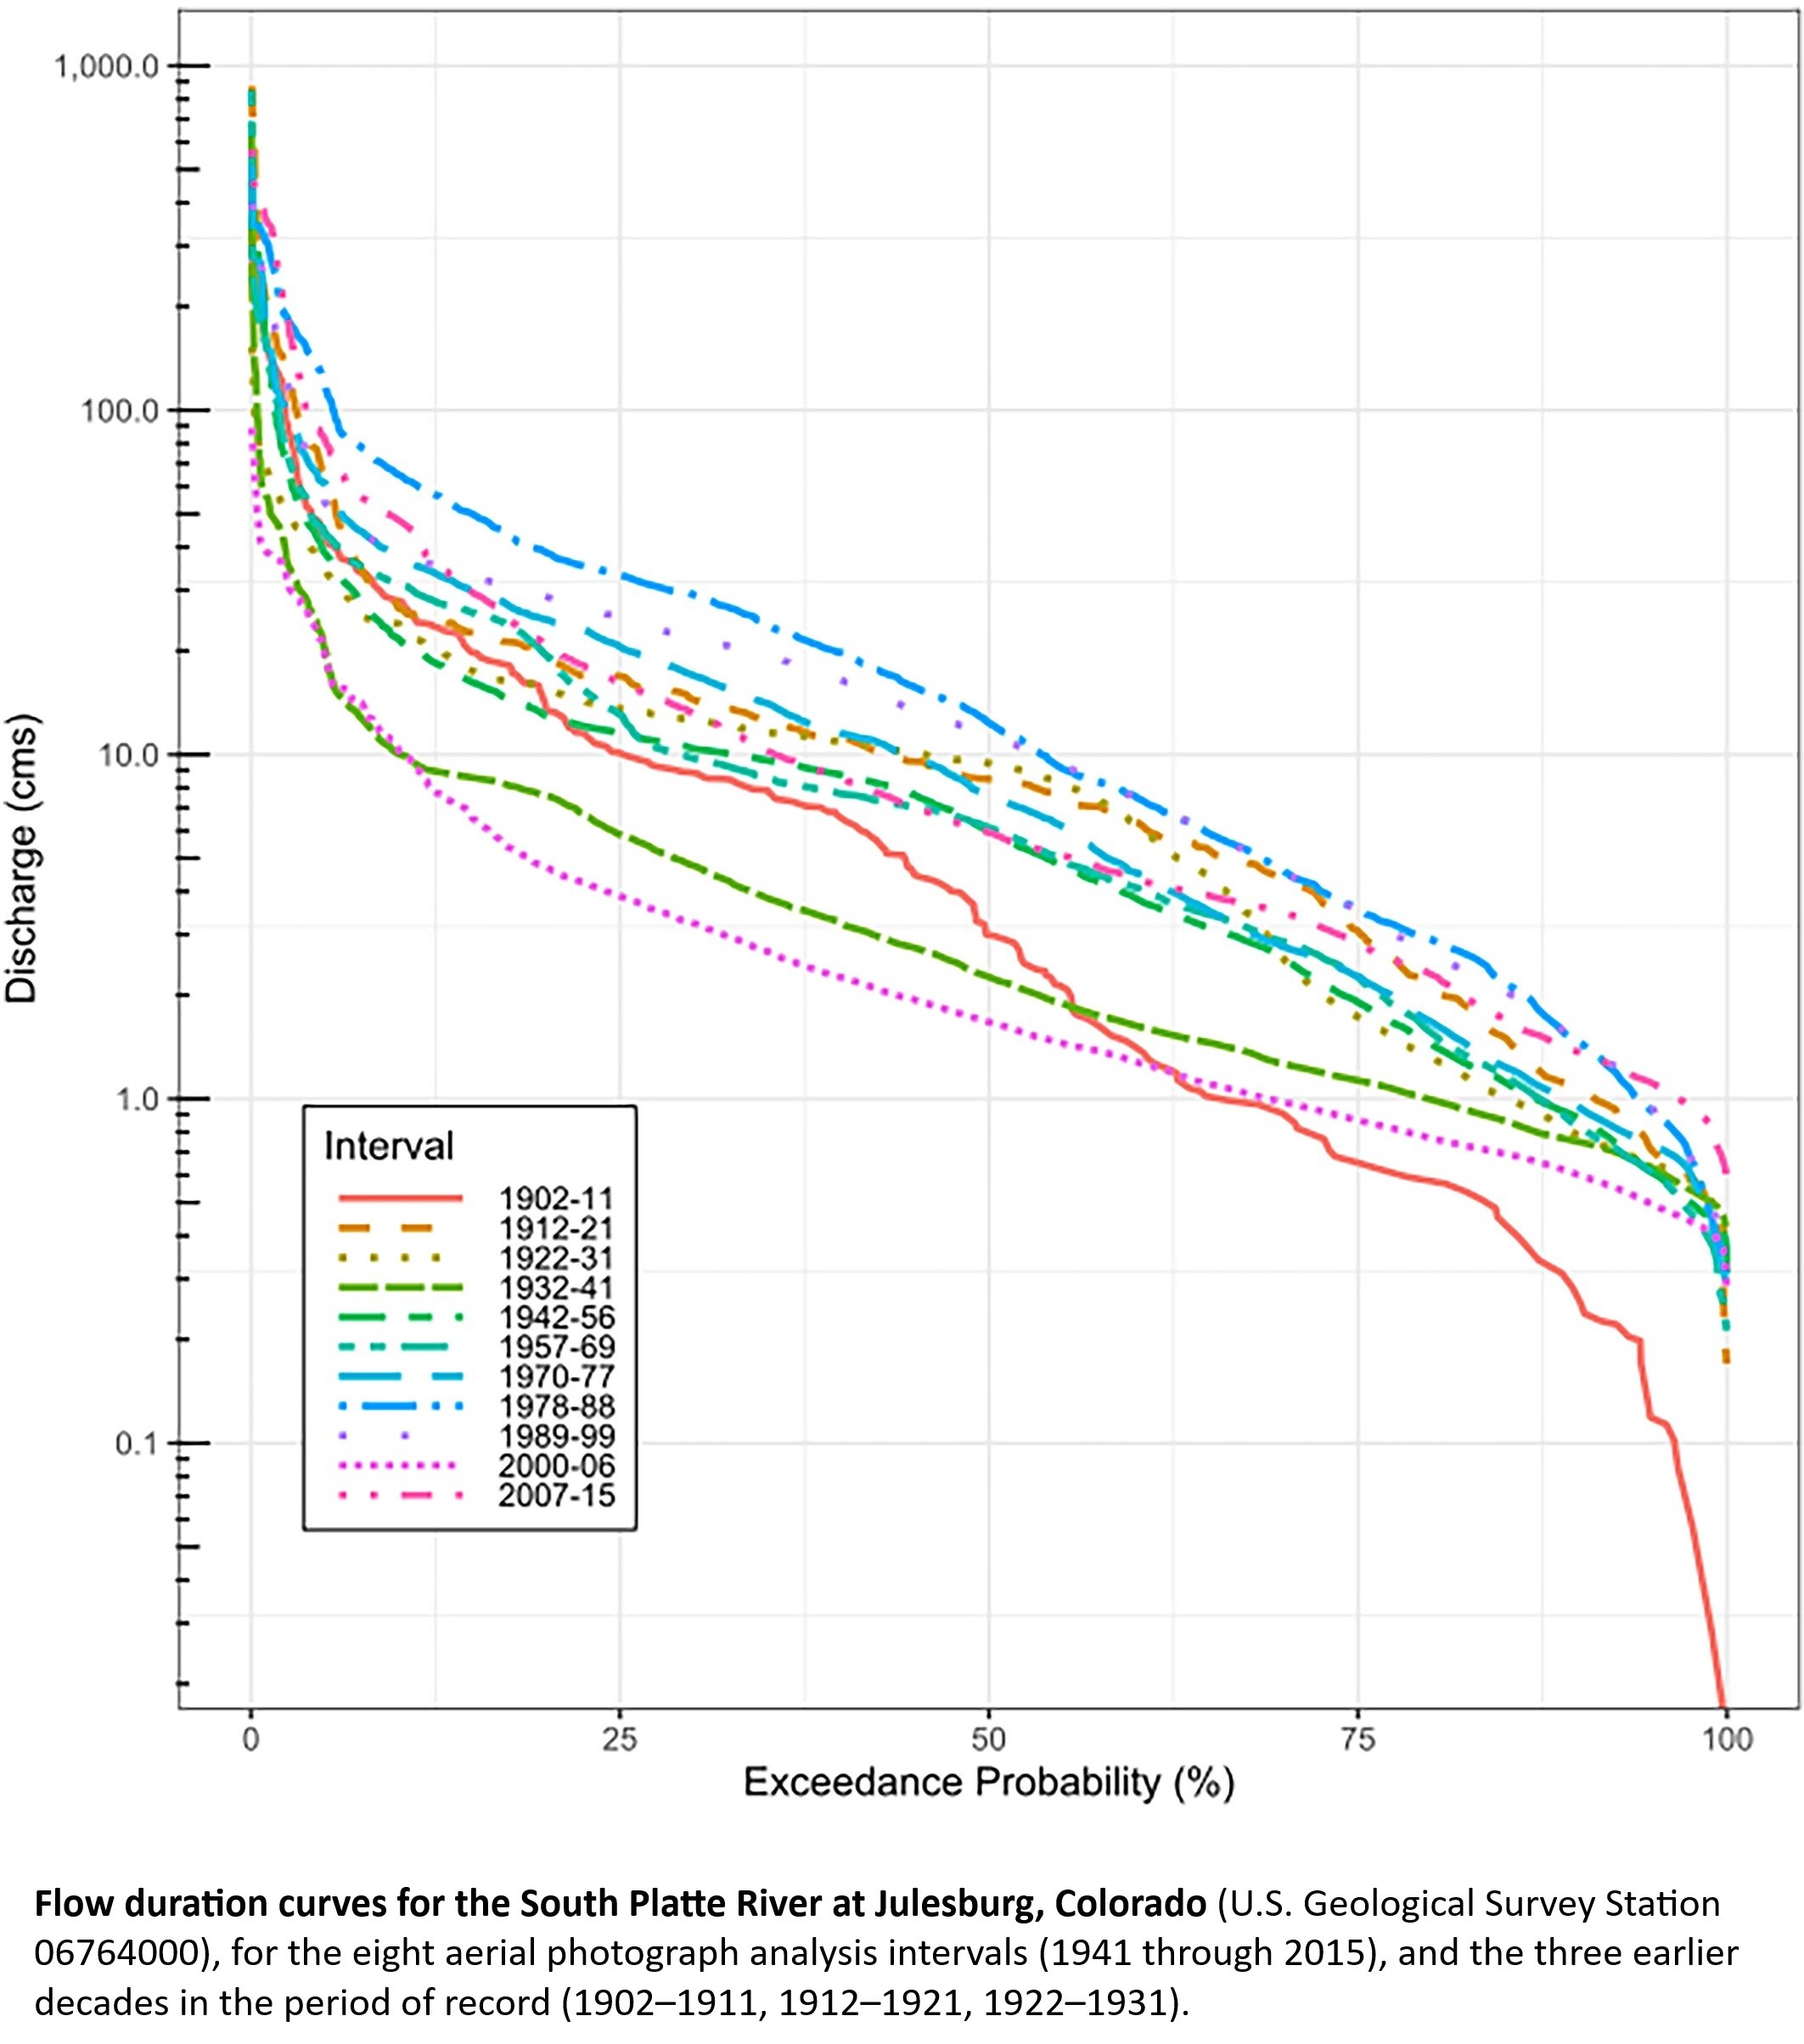
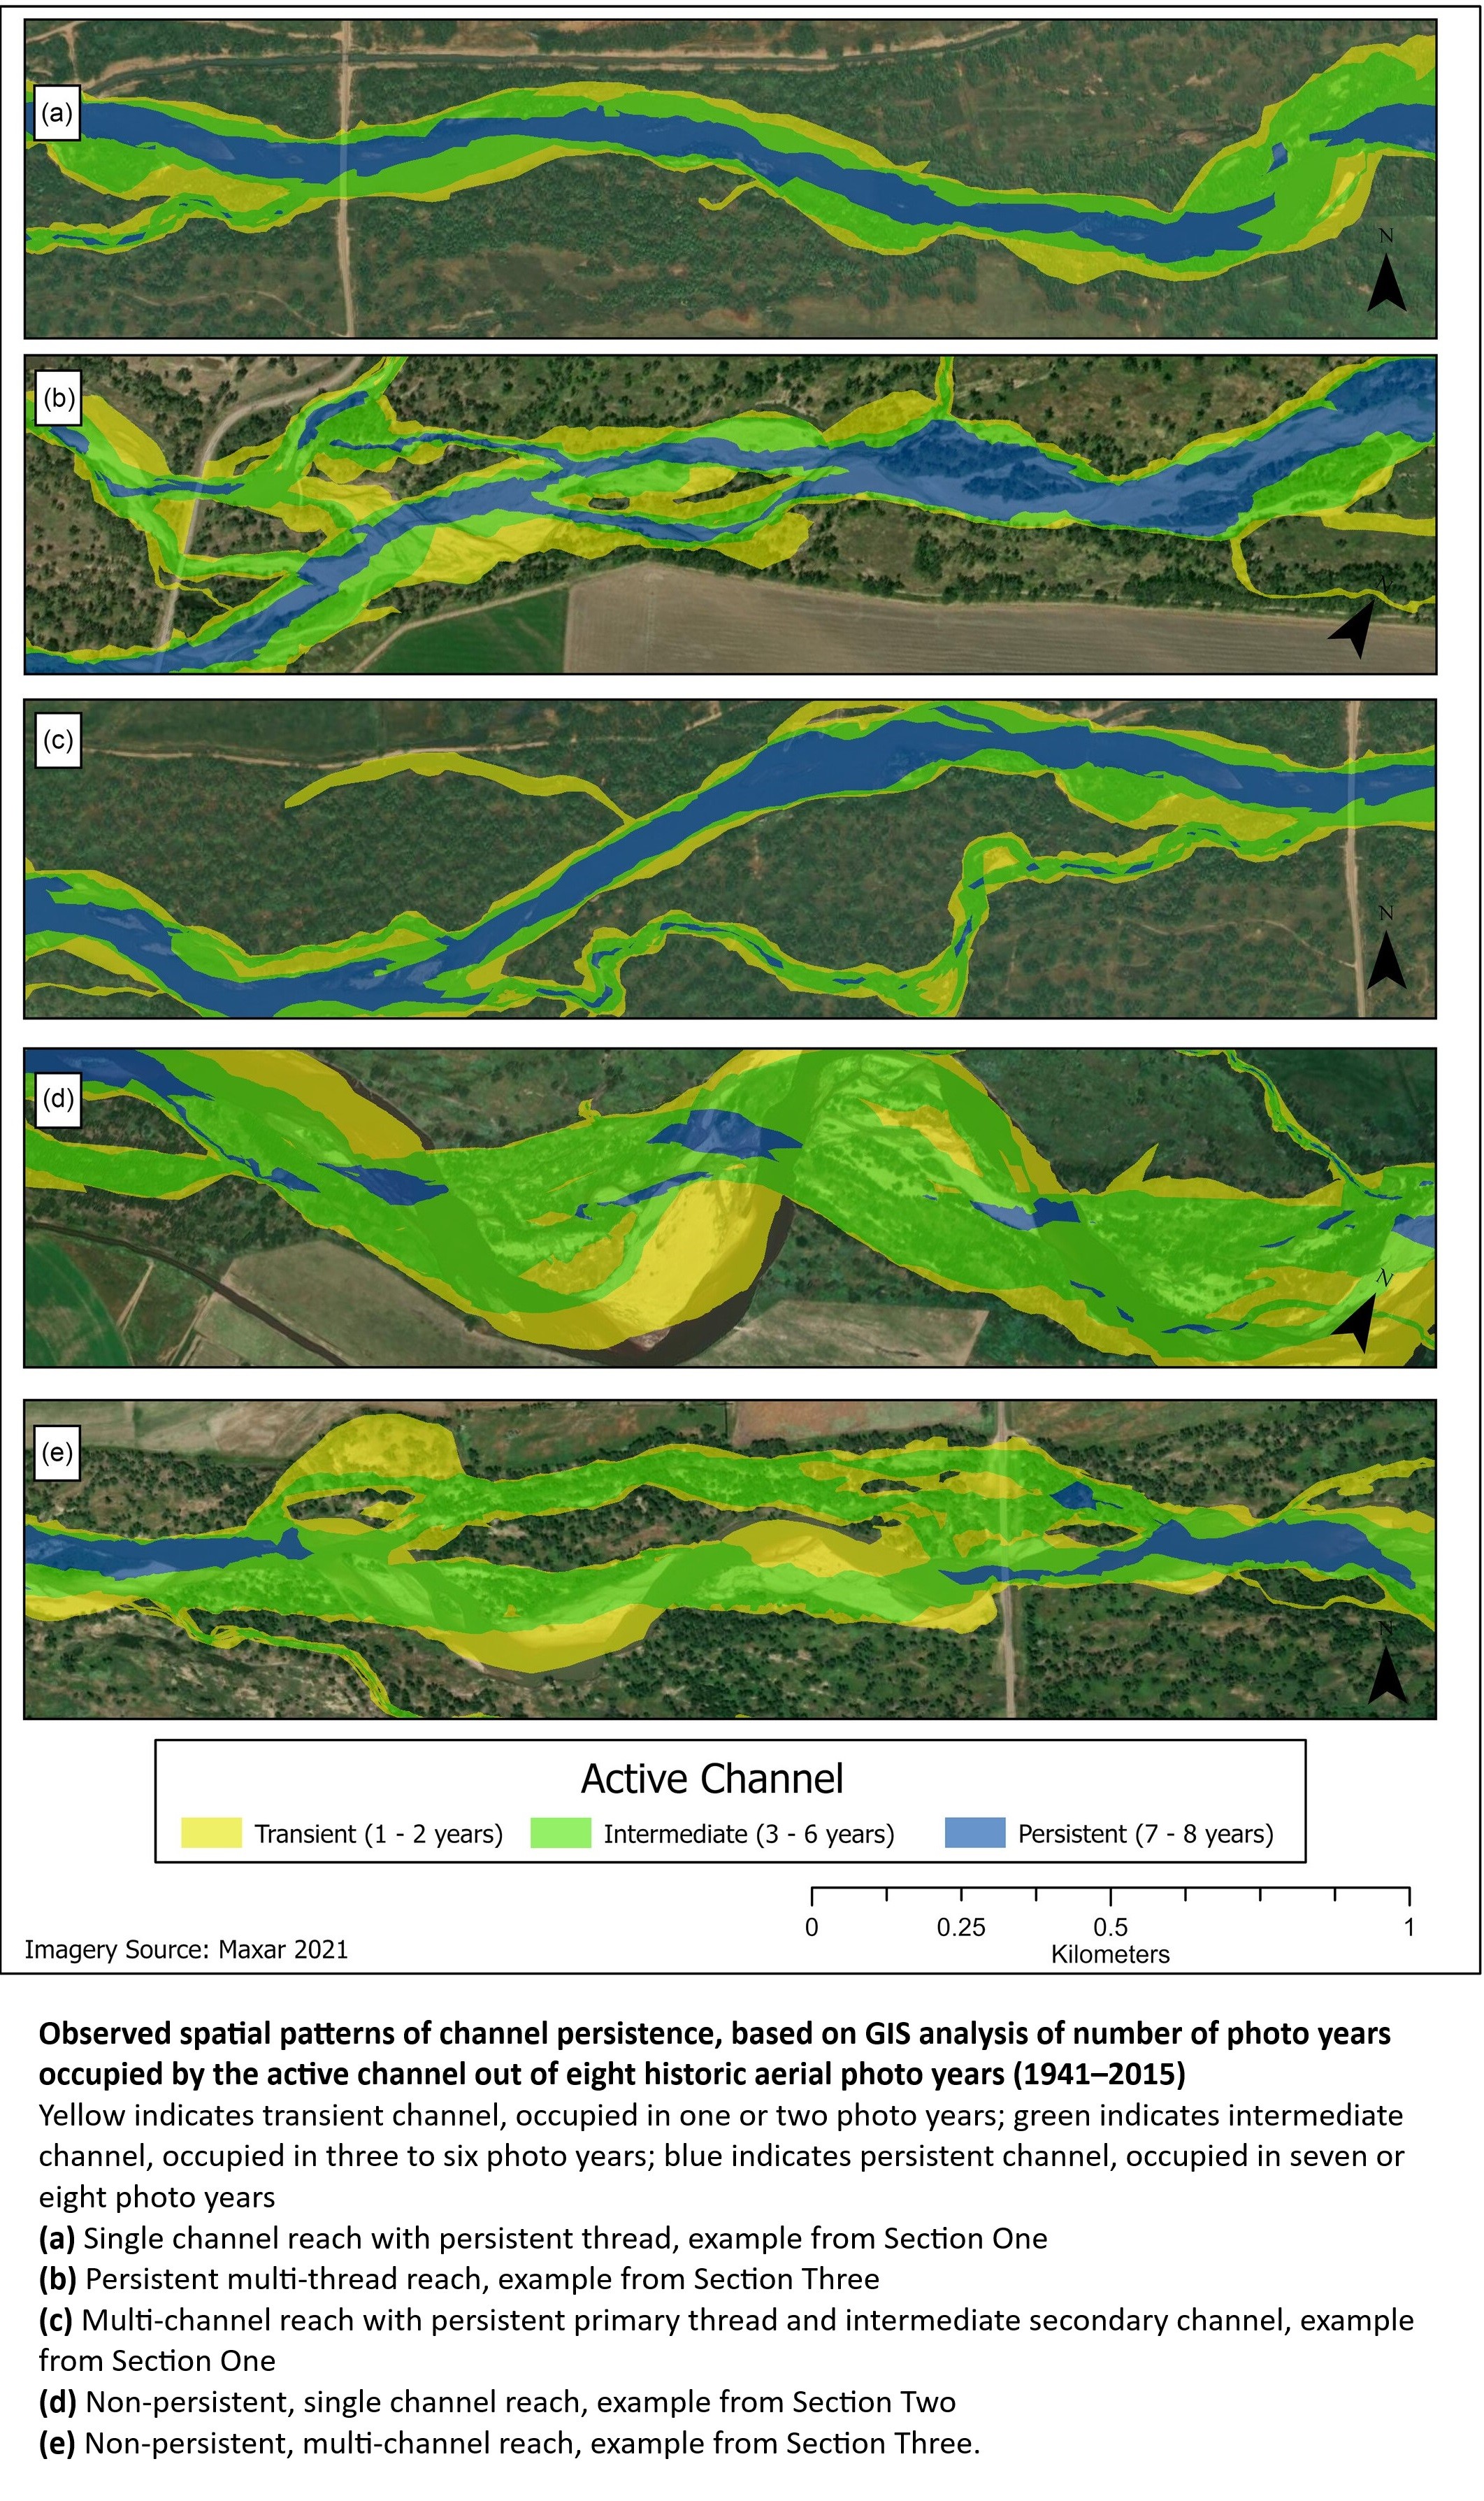
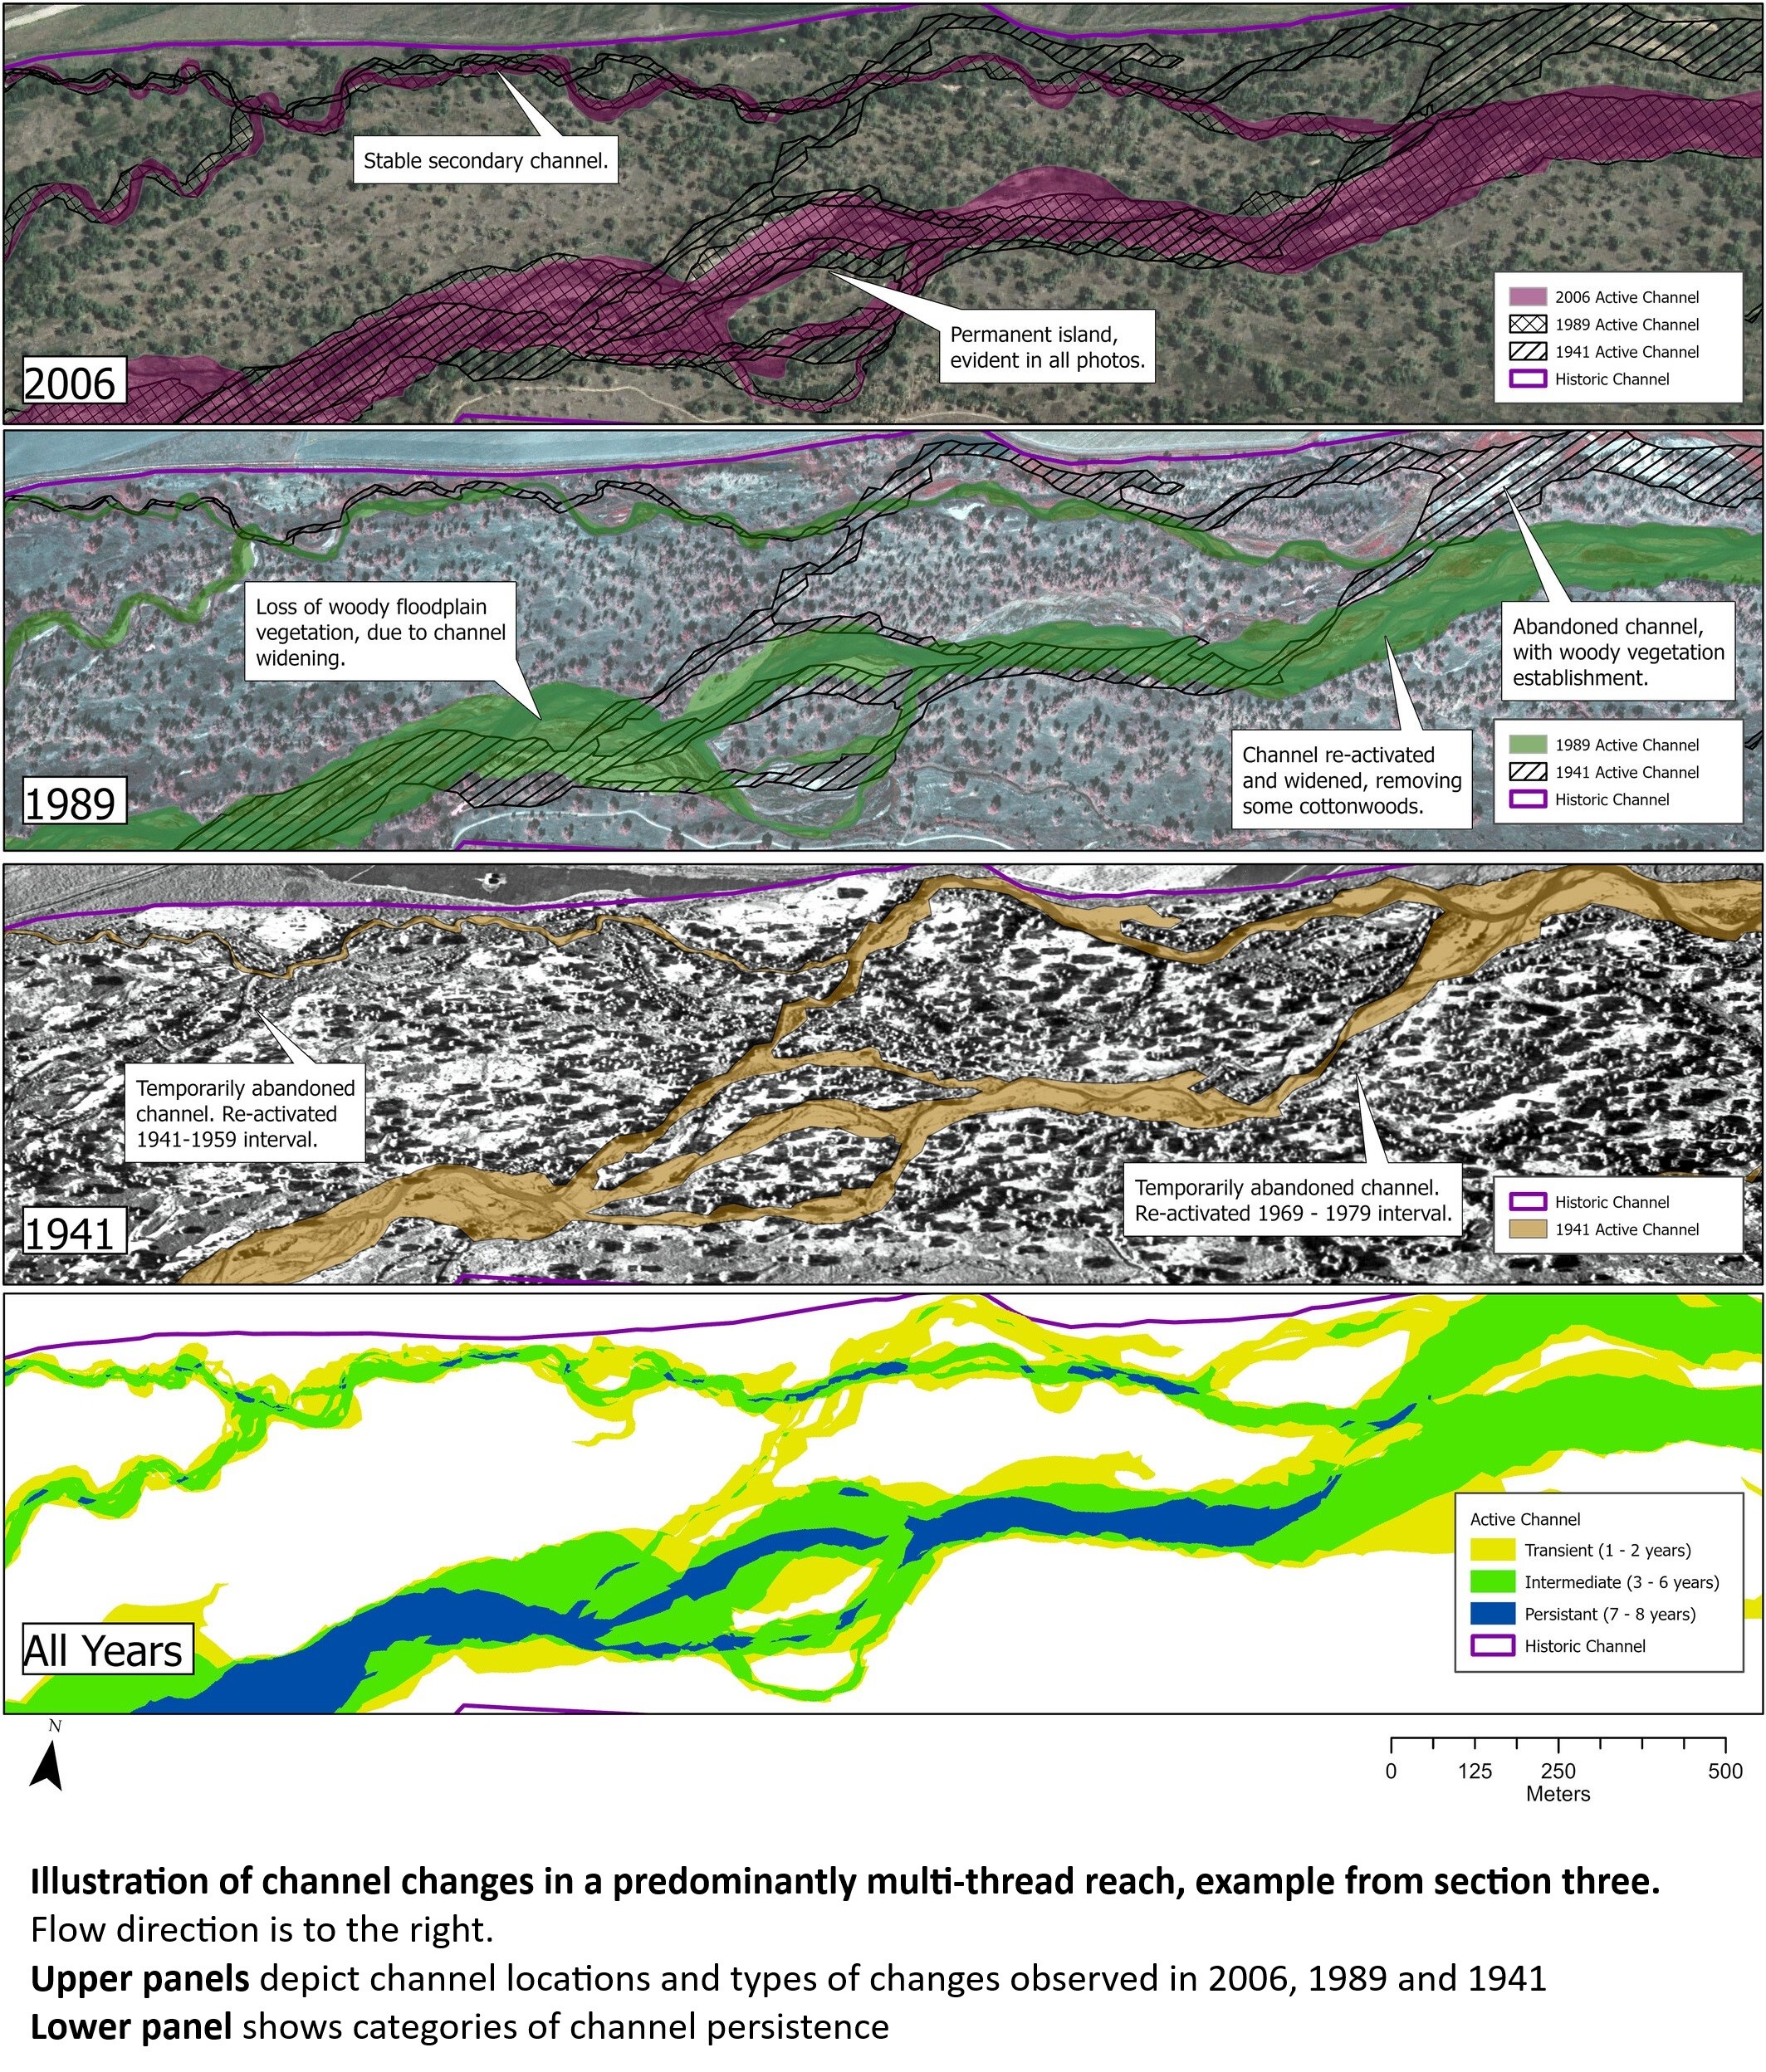
Historic Channel Dynamics Of A Highly Developed Dryland River [spatiotemporal / hydrospatial analysis]
--
https://doi.org/10.1002/esp.5939 <-- shared paper
--
#GIS #spatial #mapping #hydrospatial #Colorado #USA #SouthPlatte #sustainable #sustainability #water #surfacewater #river #waterresources #hydrology #remotesensing #riverchannel #channel #spatialanalysis #spatiotemporal #change #history #historic #development #engineering #climatechange #discharge #watersecurity #wateruse #waterrights #farming #agriculture #economy #economiccost #dynamic #municipal #industrial #dryland
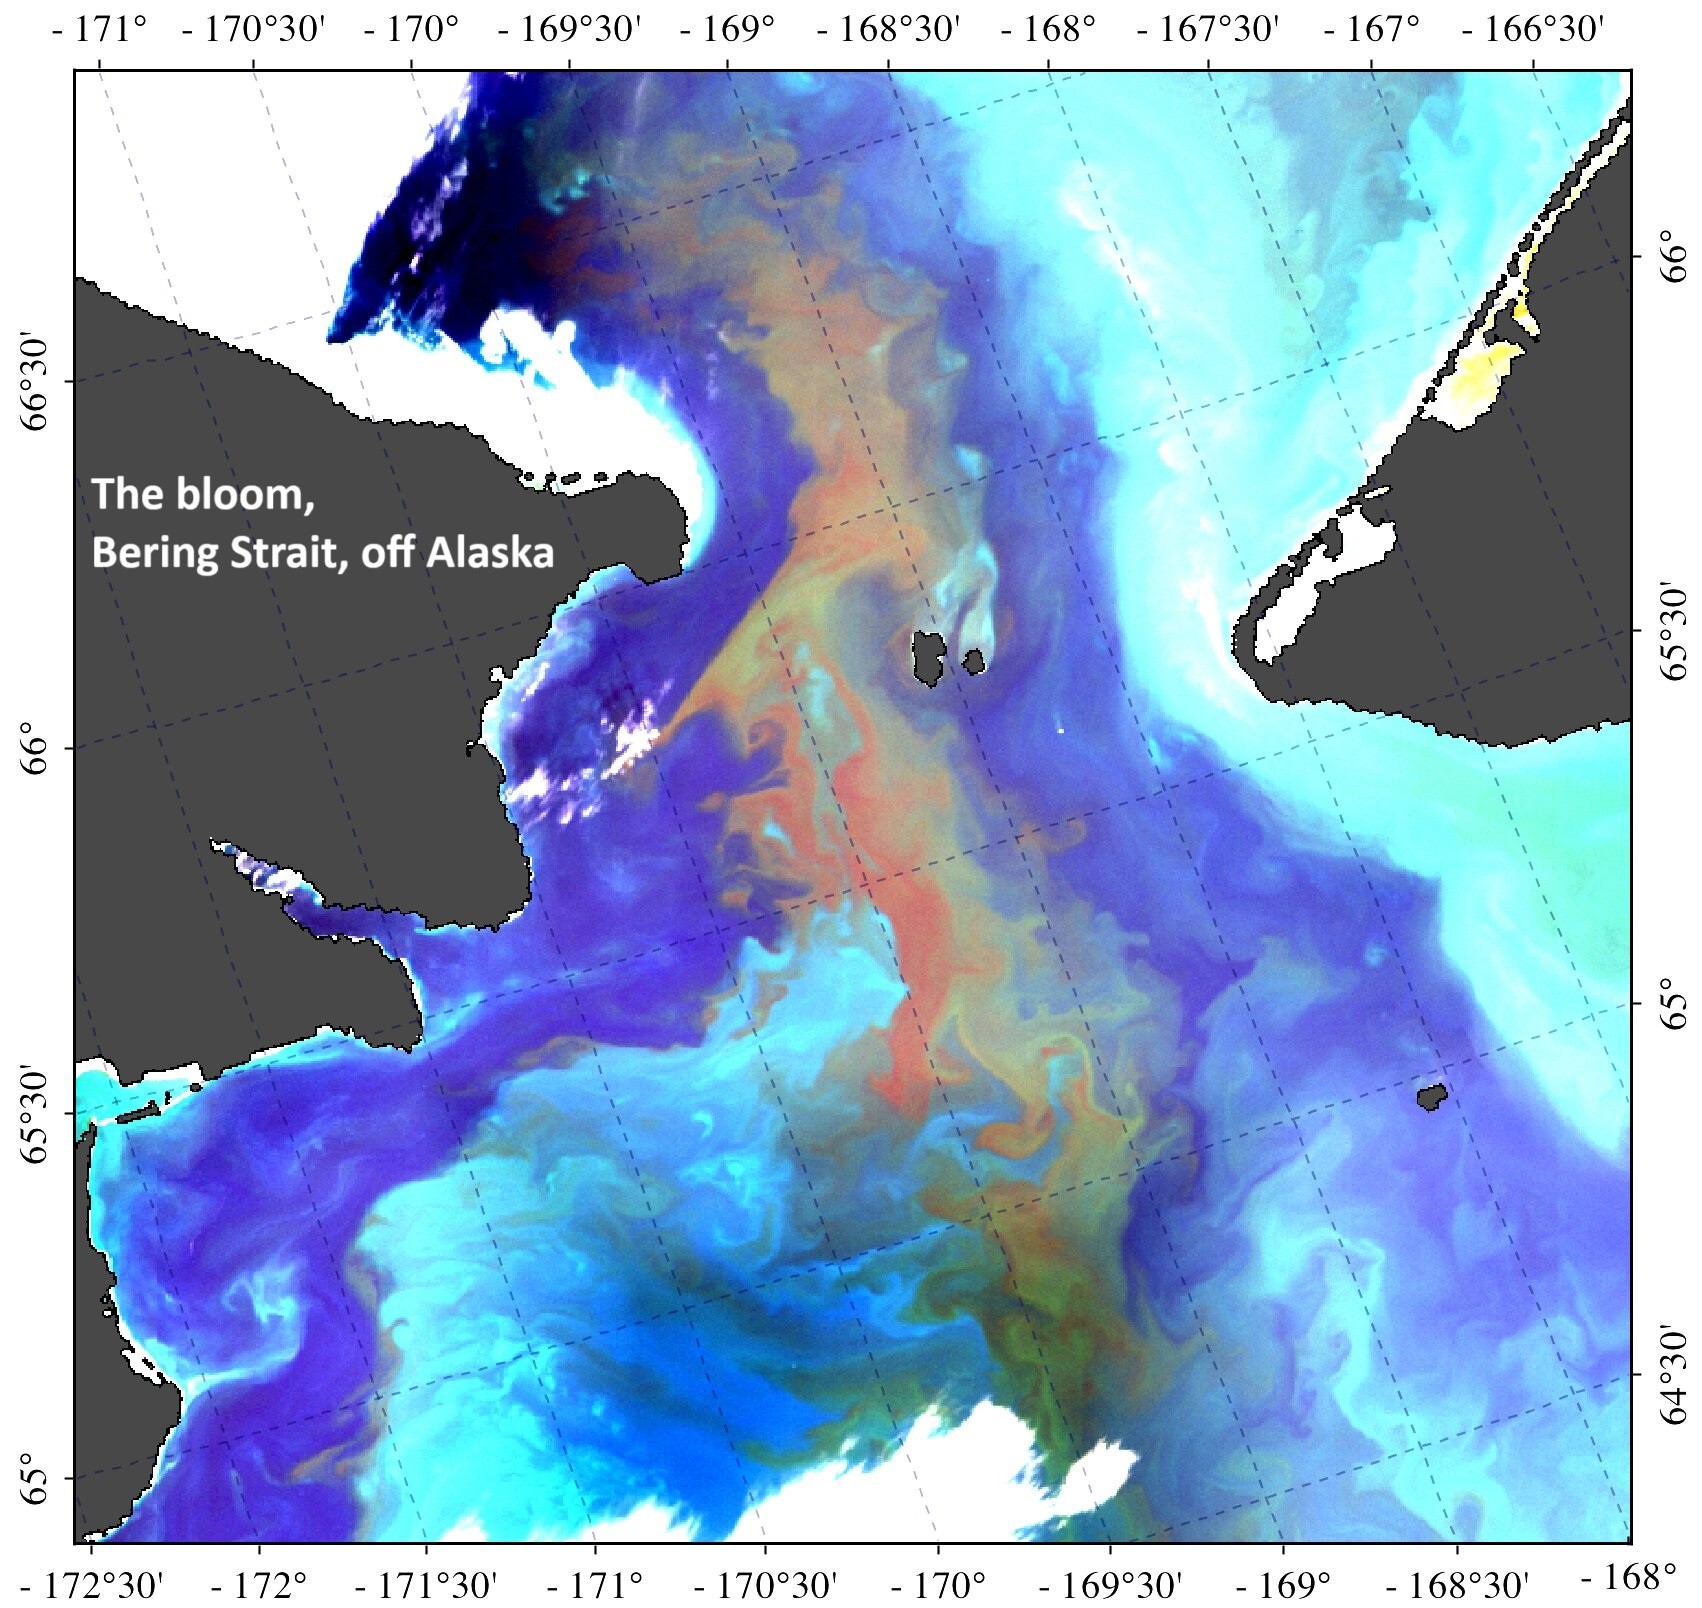
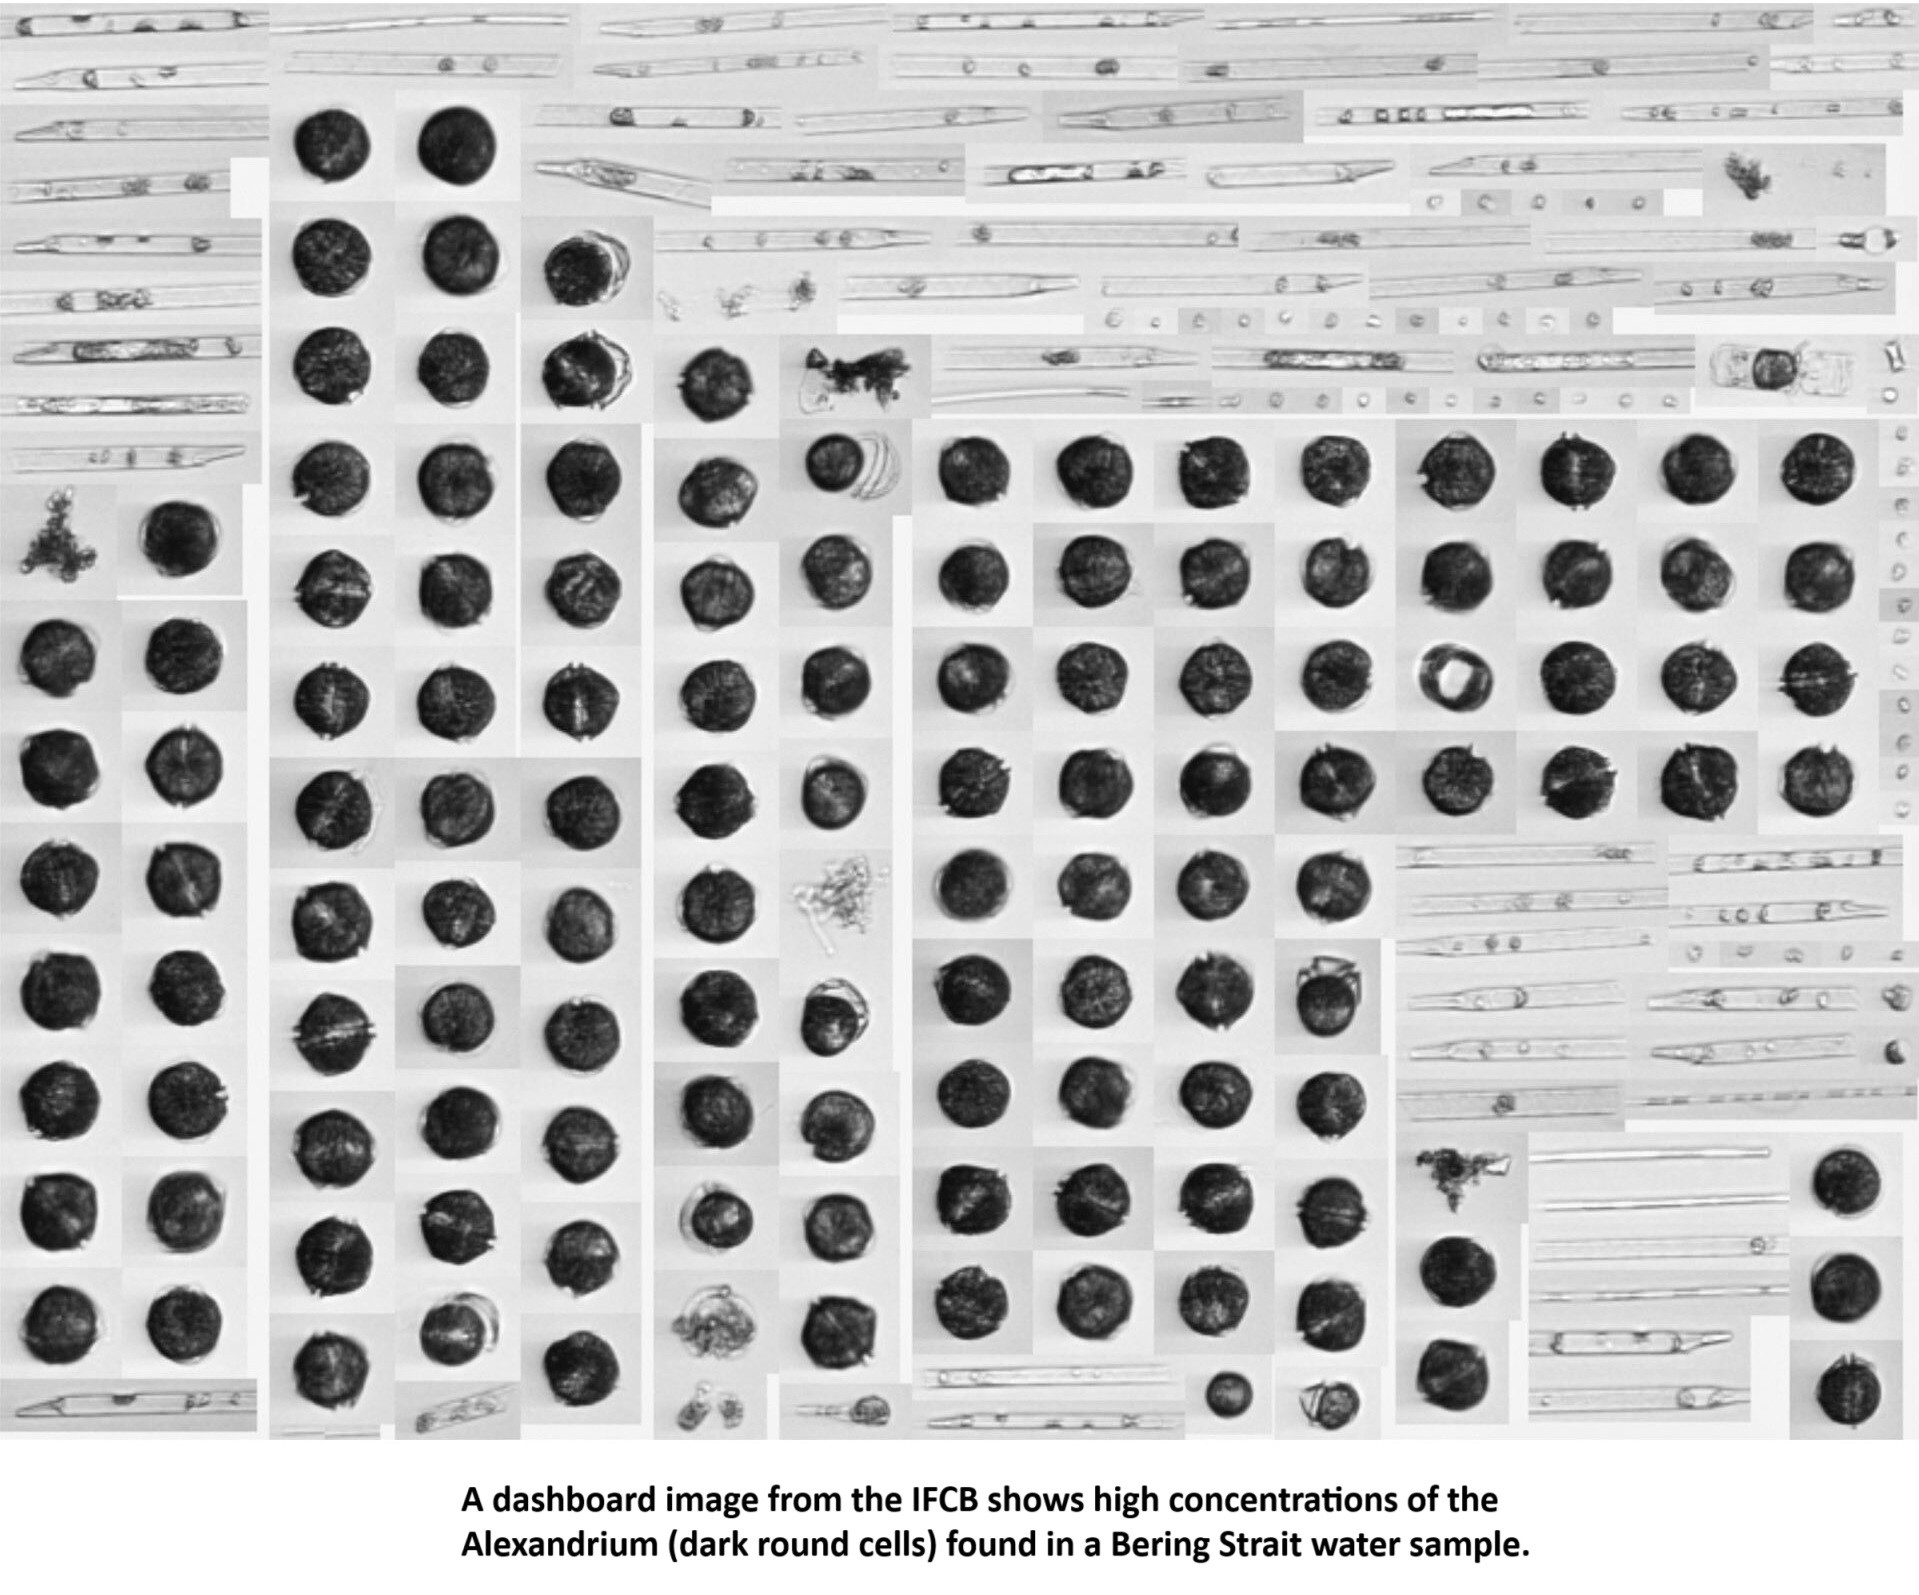
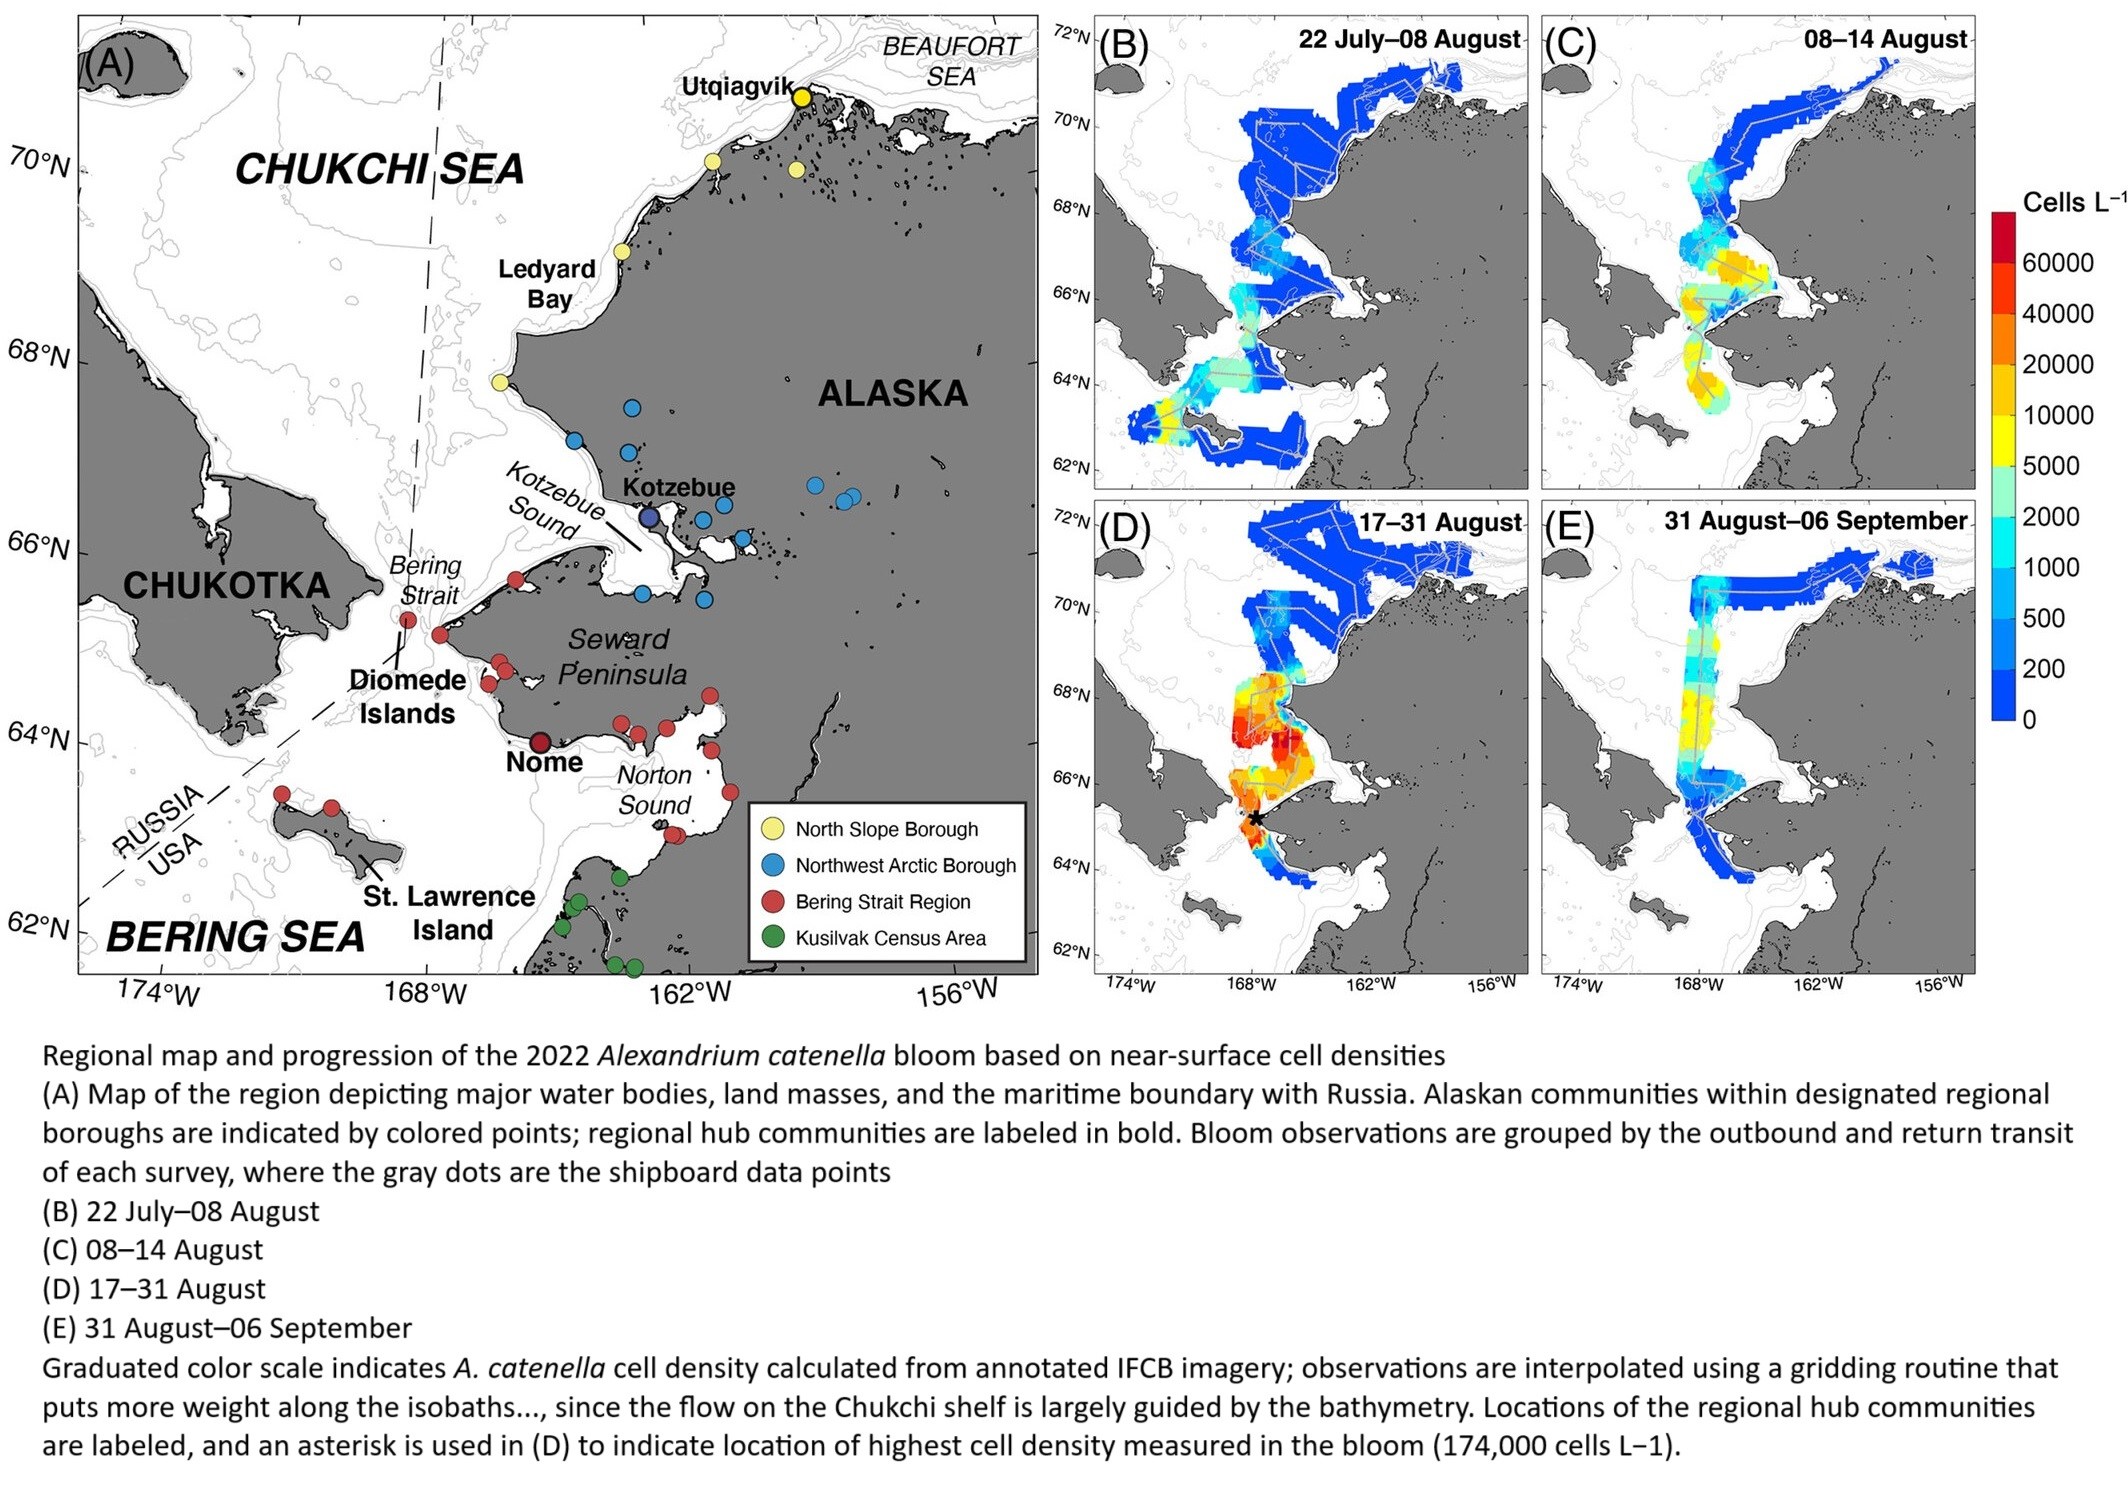
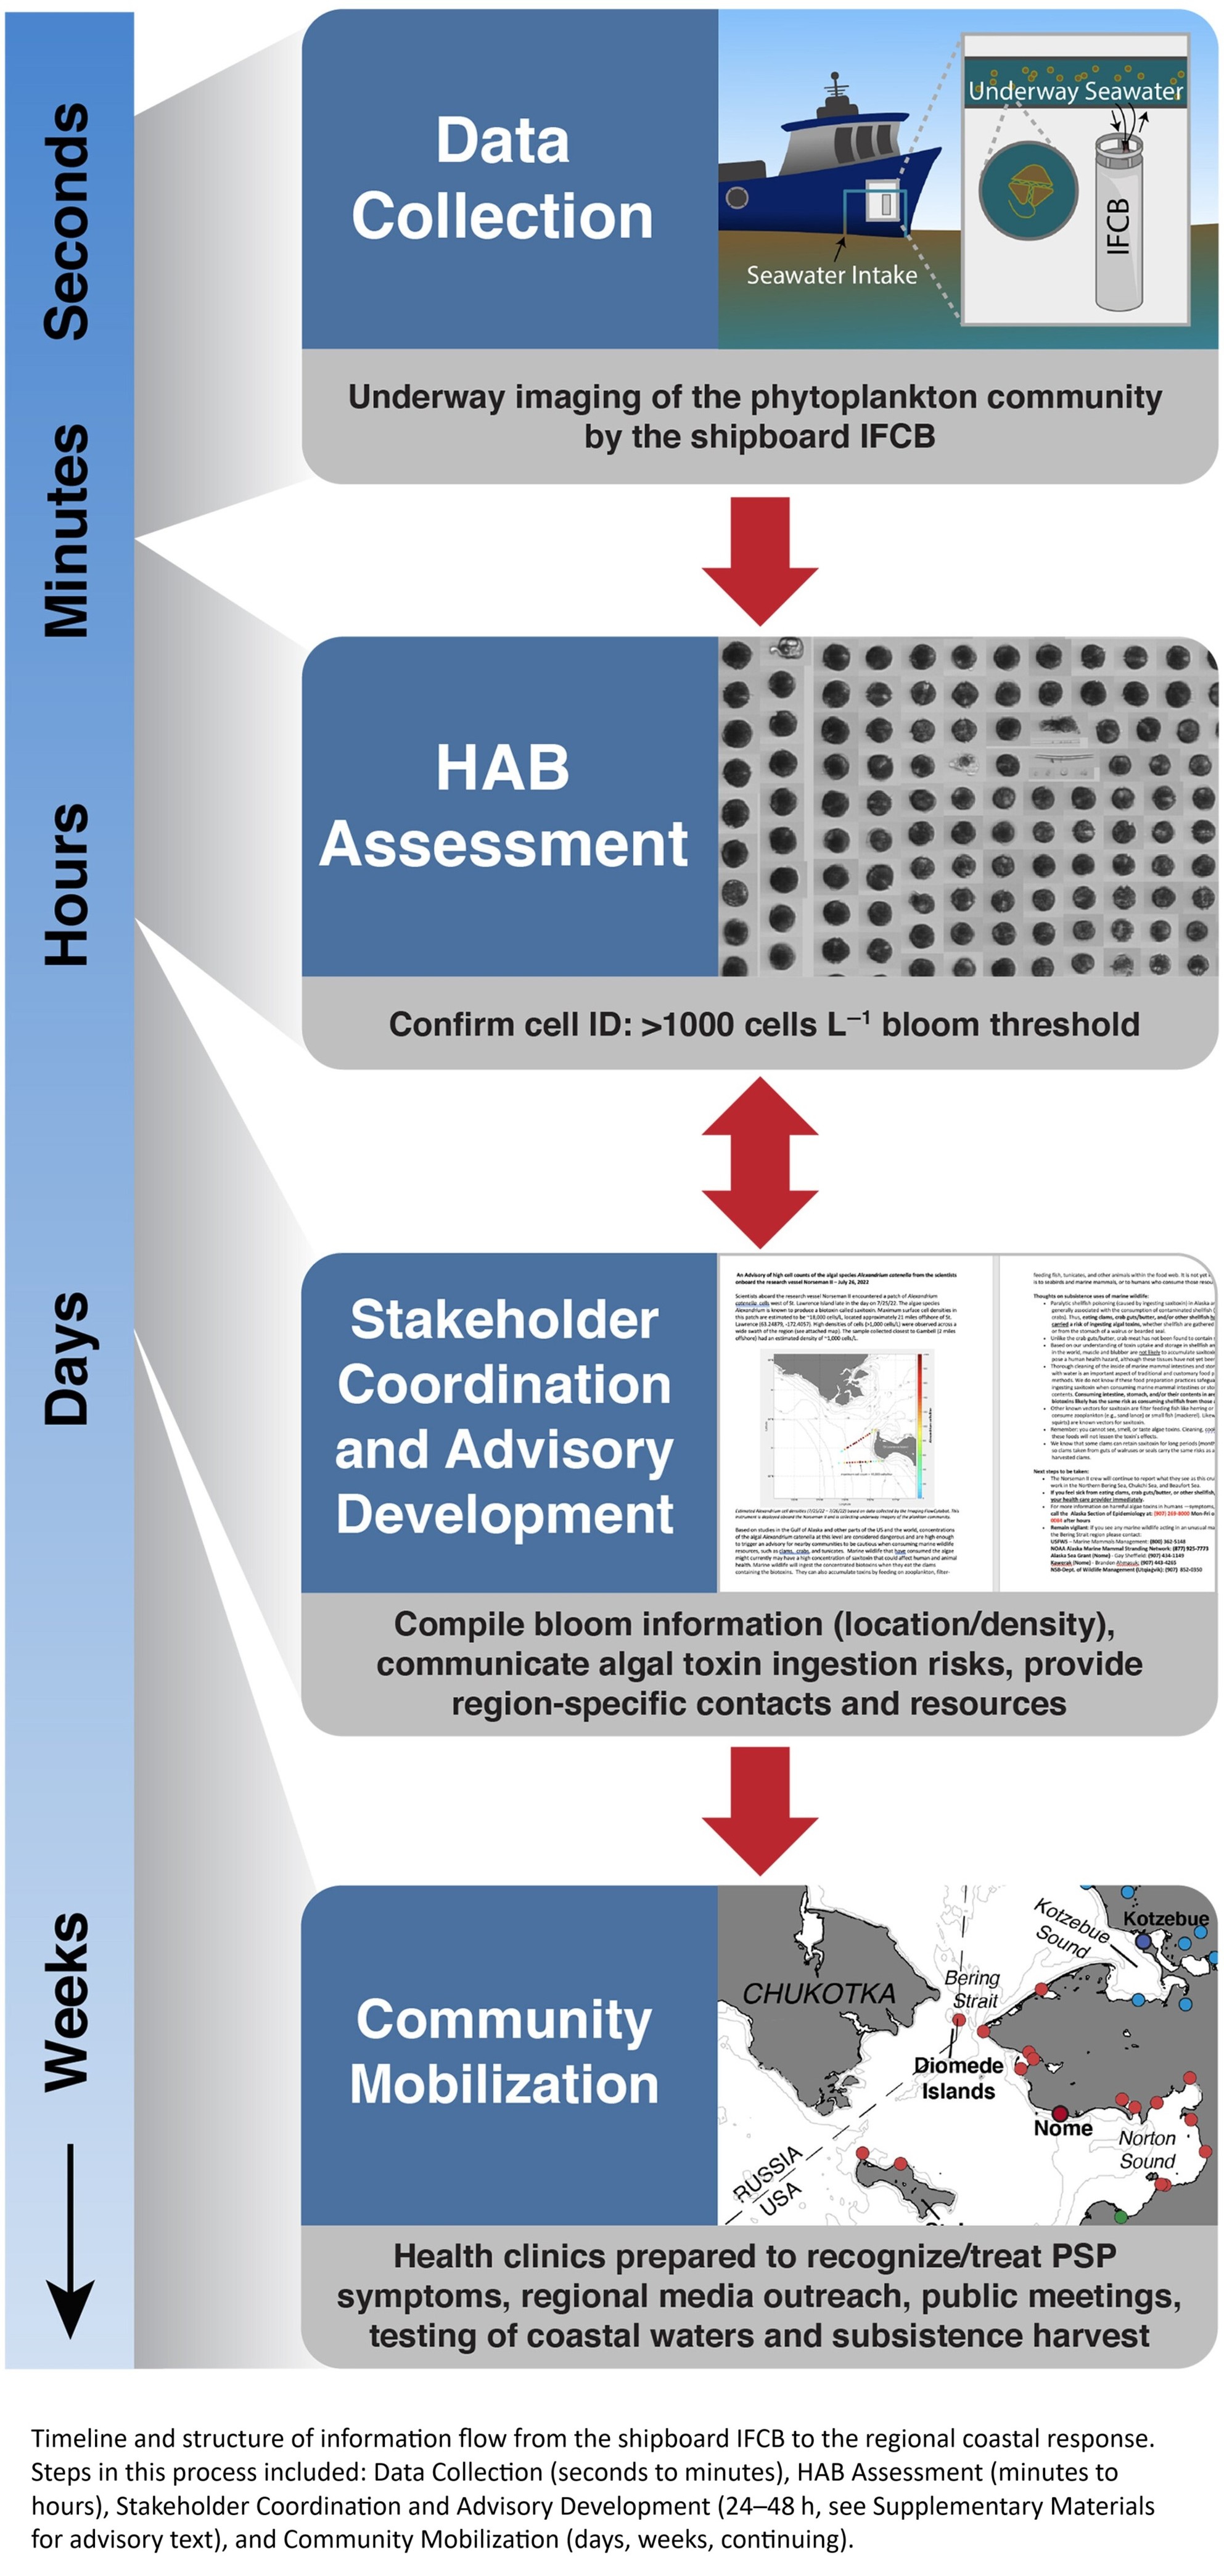
The Detection Of A Massive Harmful Algal Bloom In The Arctic Prompts Real-Time Advisories To Western Alaskan Communities
--
https://phys.org/news/2024-07-massive-algal-bloom-arctic-prompts.html <-- shared technical article
--
https://doi.org/10.1002/lol2.10421 <-- shared paper
--
#GIS #spatial #mapping #sampling #publichealth #ecosystem #habitat #climatechange #harmful #agalbloom #HAB #polar #marine #healthimpacts #toxins #Arctic #water #hydrospatial #sampling #model #modeling #BeringStrait #magnitude #scale #density #toxicity #coast #coastal #remote #communities #FirstNation #risk #hazard #response #monitoring #hazardassessment #communication #realtime #advisories #Alaska #WesternAlaska #maritime #subsistence #harvest #fisheries #tracking #spatiotemporal #spatialanalysis #WHOI #PST #algae #foodchain #foodweb #mortality #impacts #subsidence #eventresponse #waterquality
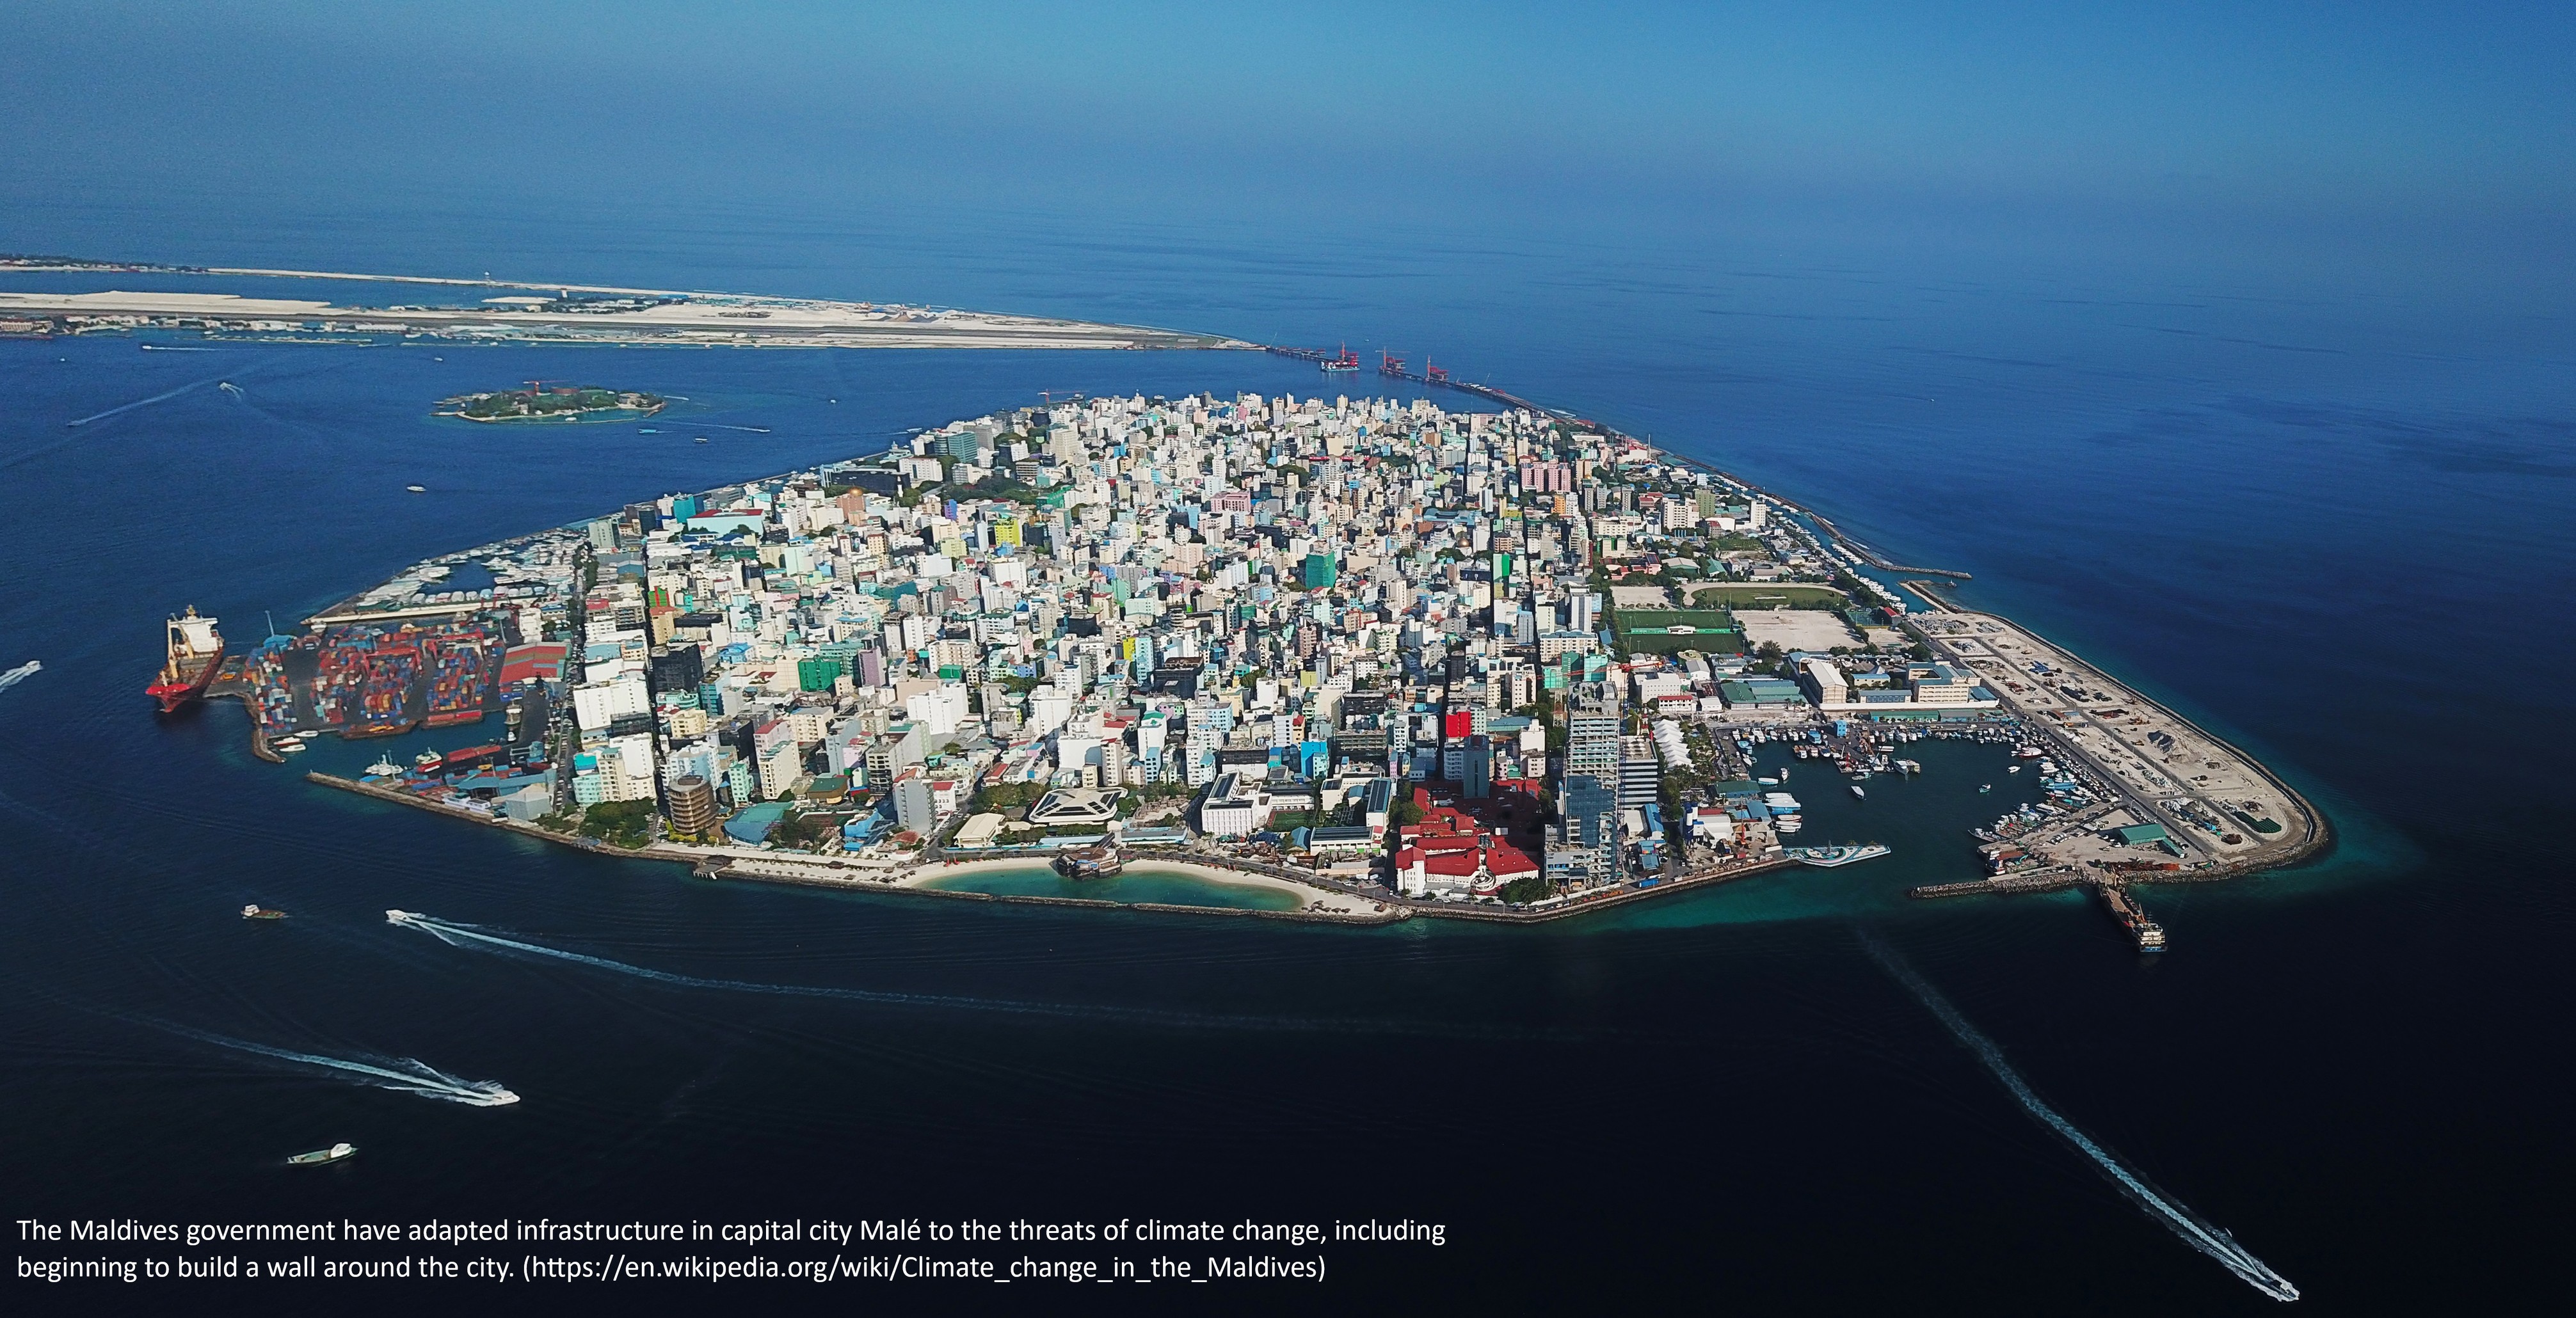
The Vanishing Islands That Failed to Vanish [Maldives]
--
https://www.nytimes.com/interactive/2024/06/26/climate/maldives-islands-climate-change.html <-- shared media article
--
[be sure that many tropical islands ARE vanishing, like Tuvalu, and indeed many in the Maldives; this study is working to see why some are not or are not as fast as modeled (the extensive coastal engineering around the capital Male notwithstanding)]
#GIS #spatial #mapping #Maldives #climatechange #IndianOcean #model #modeling #coast #coastal #coastalengineering #SLR #sealevel #sealevelrise #tropicalisland #risk #hazard #mitigation #marine #ocean #hydrospatial #remotesensing #elevation #research #ontheground #spatialanalysis #spatiotemporal

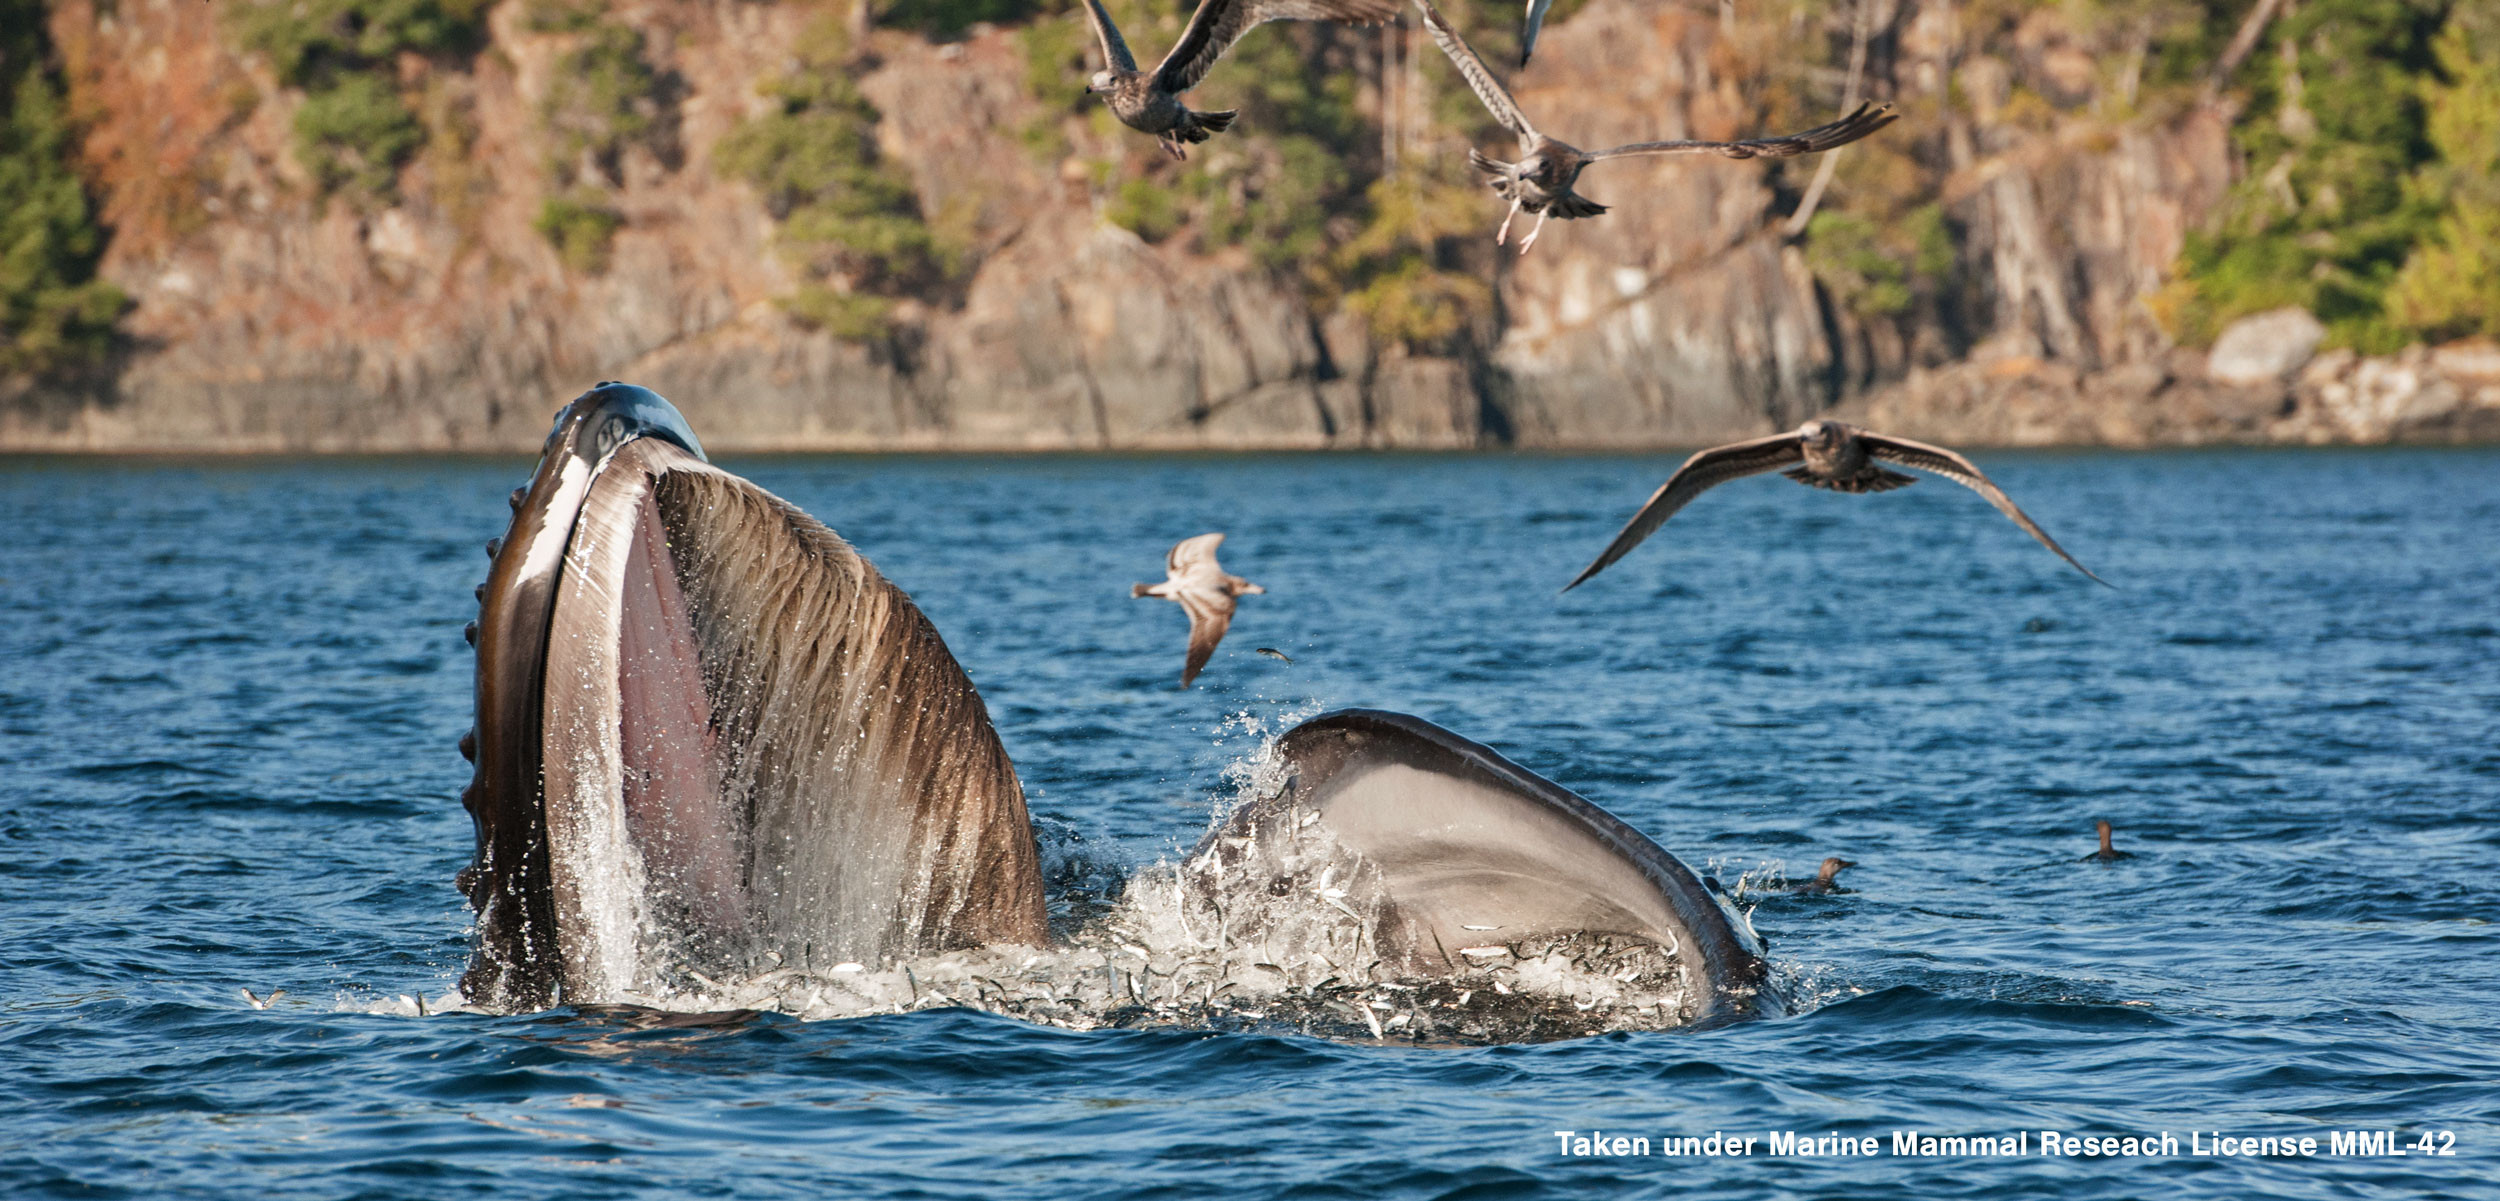
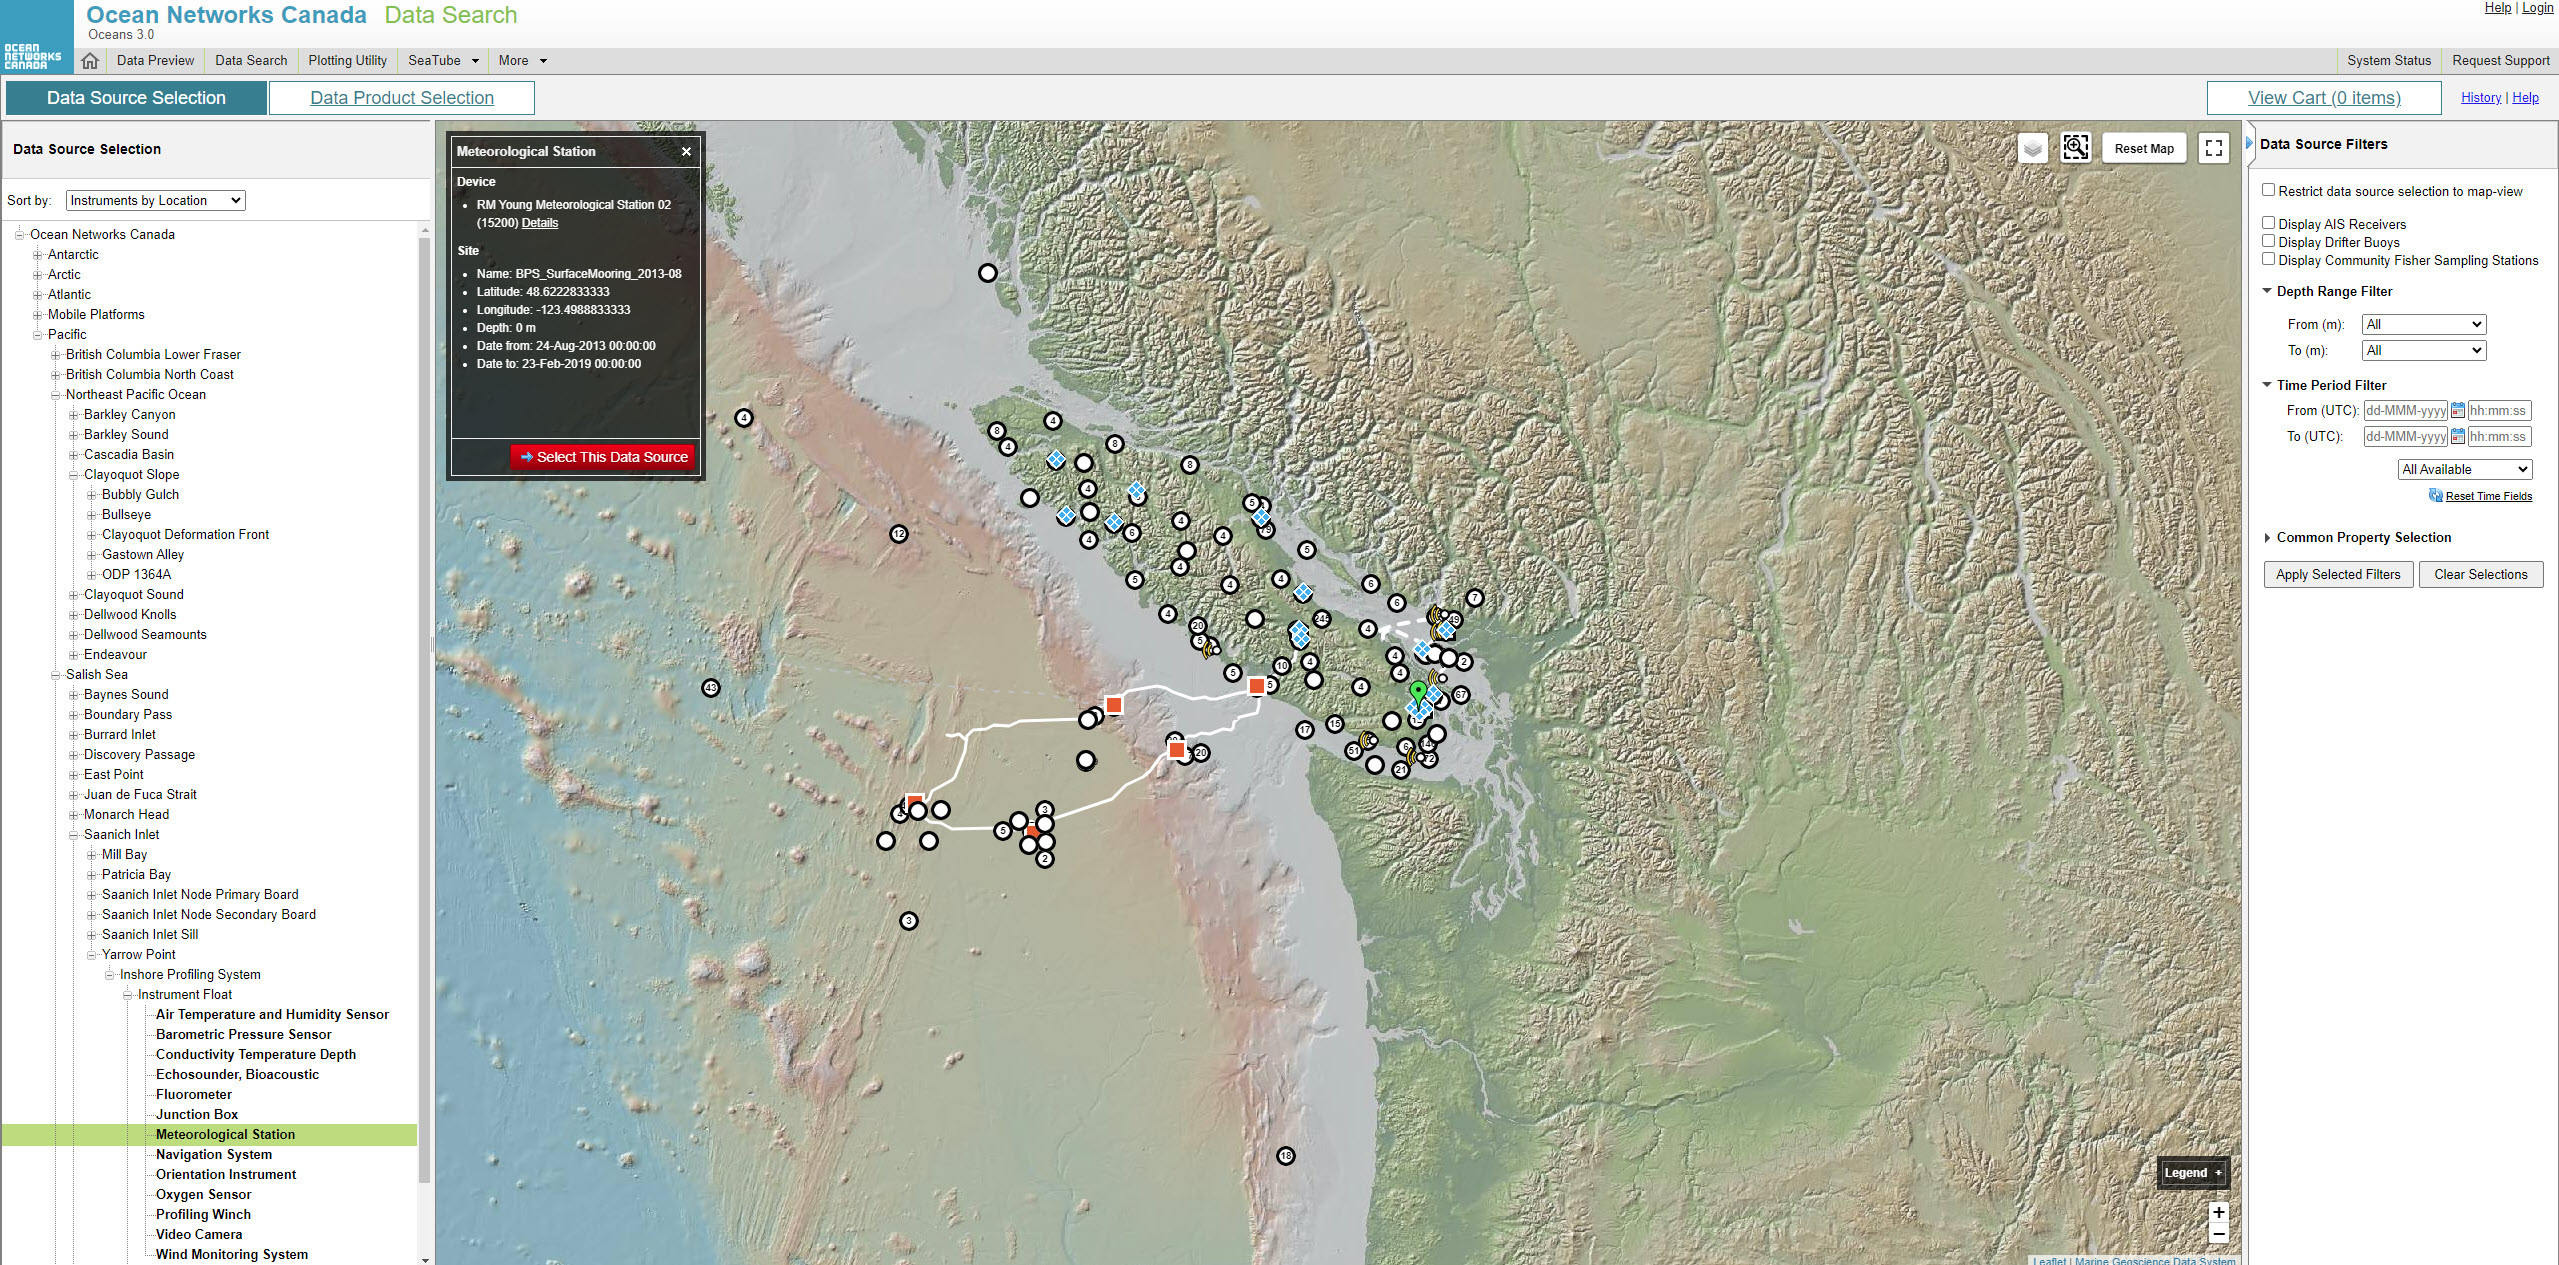
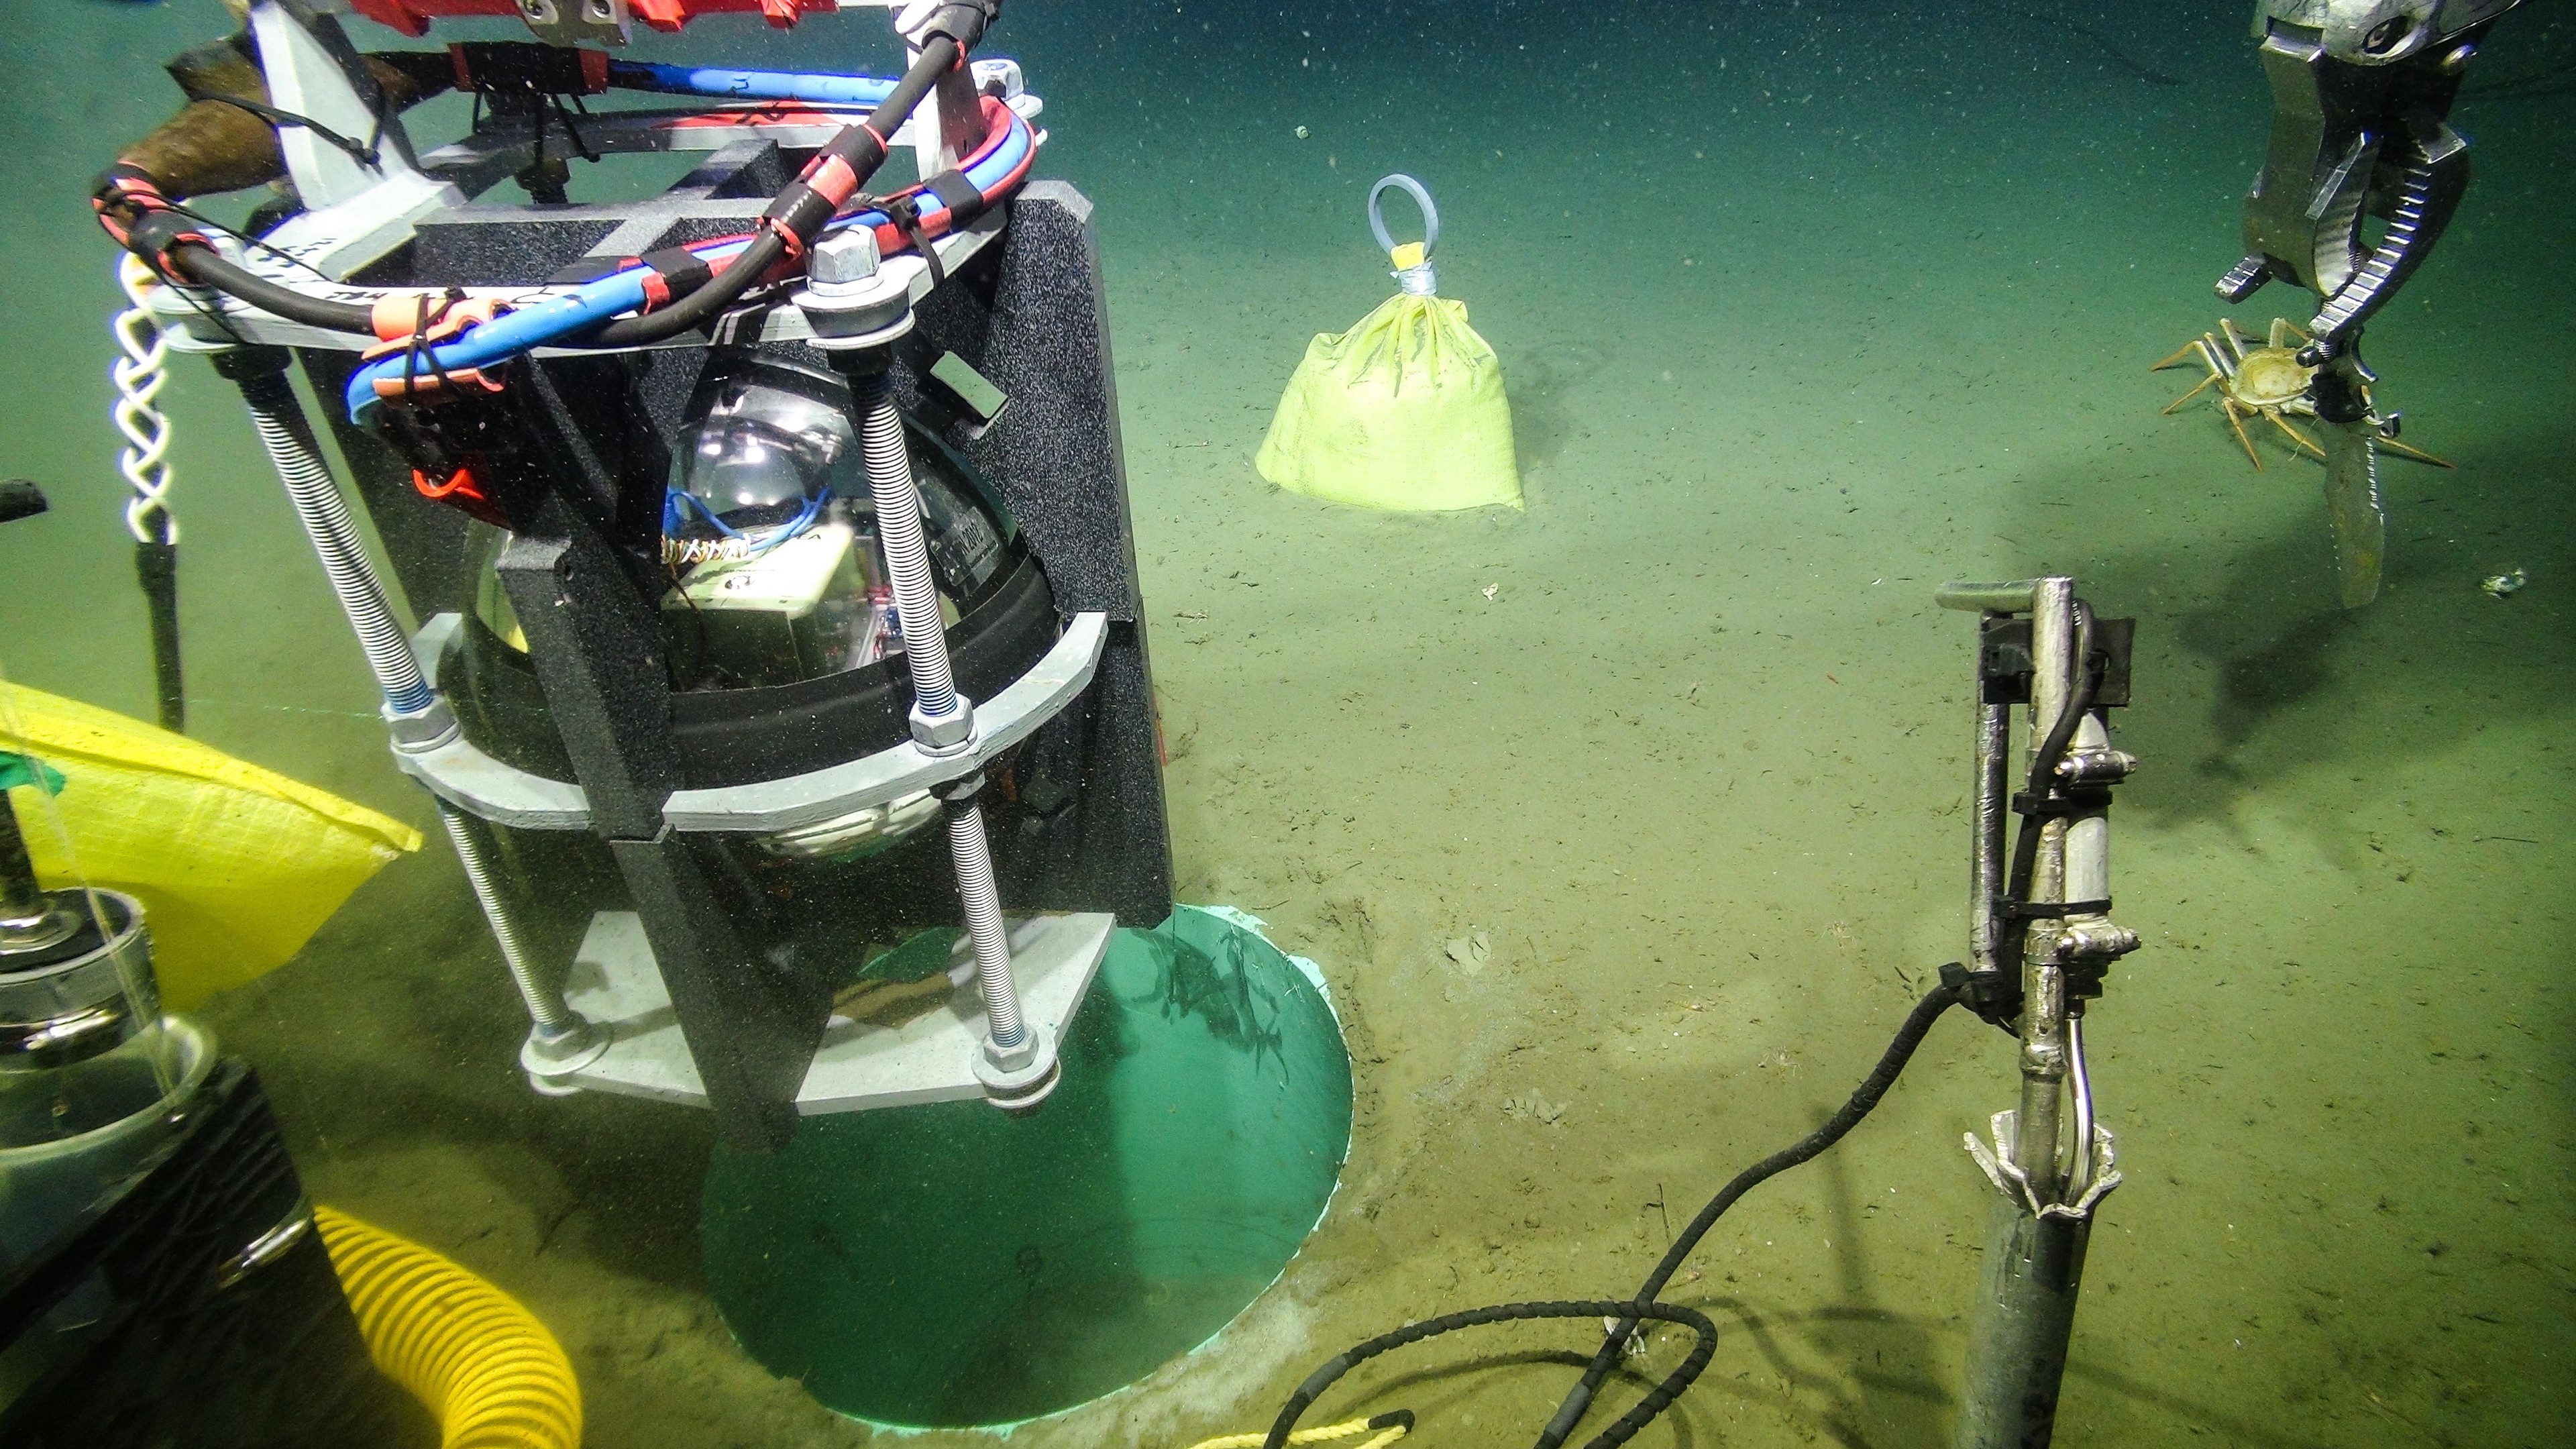
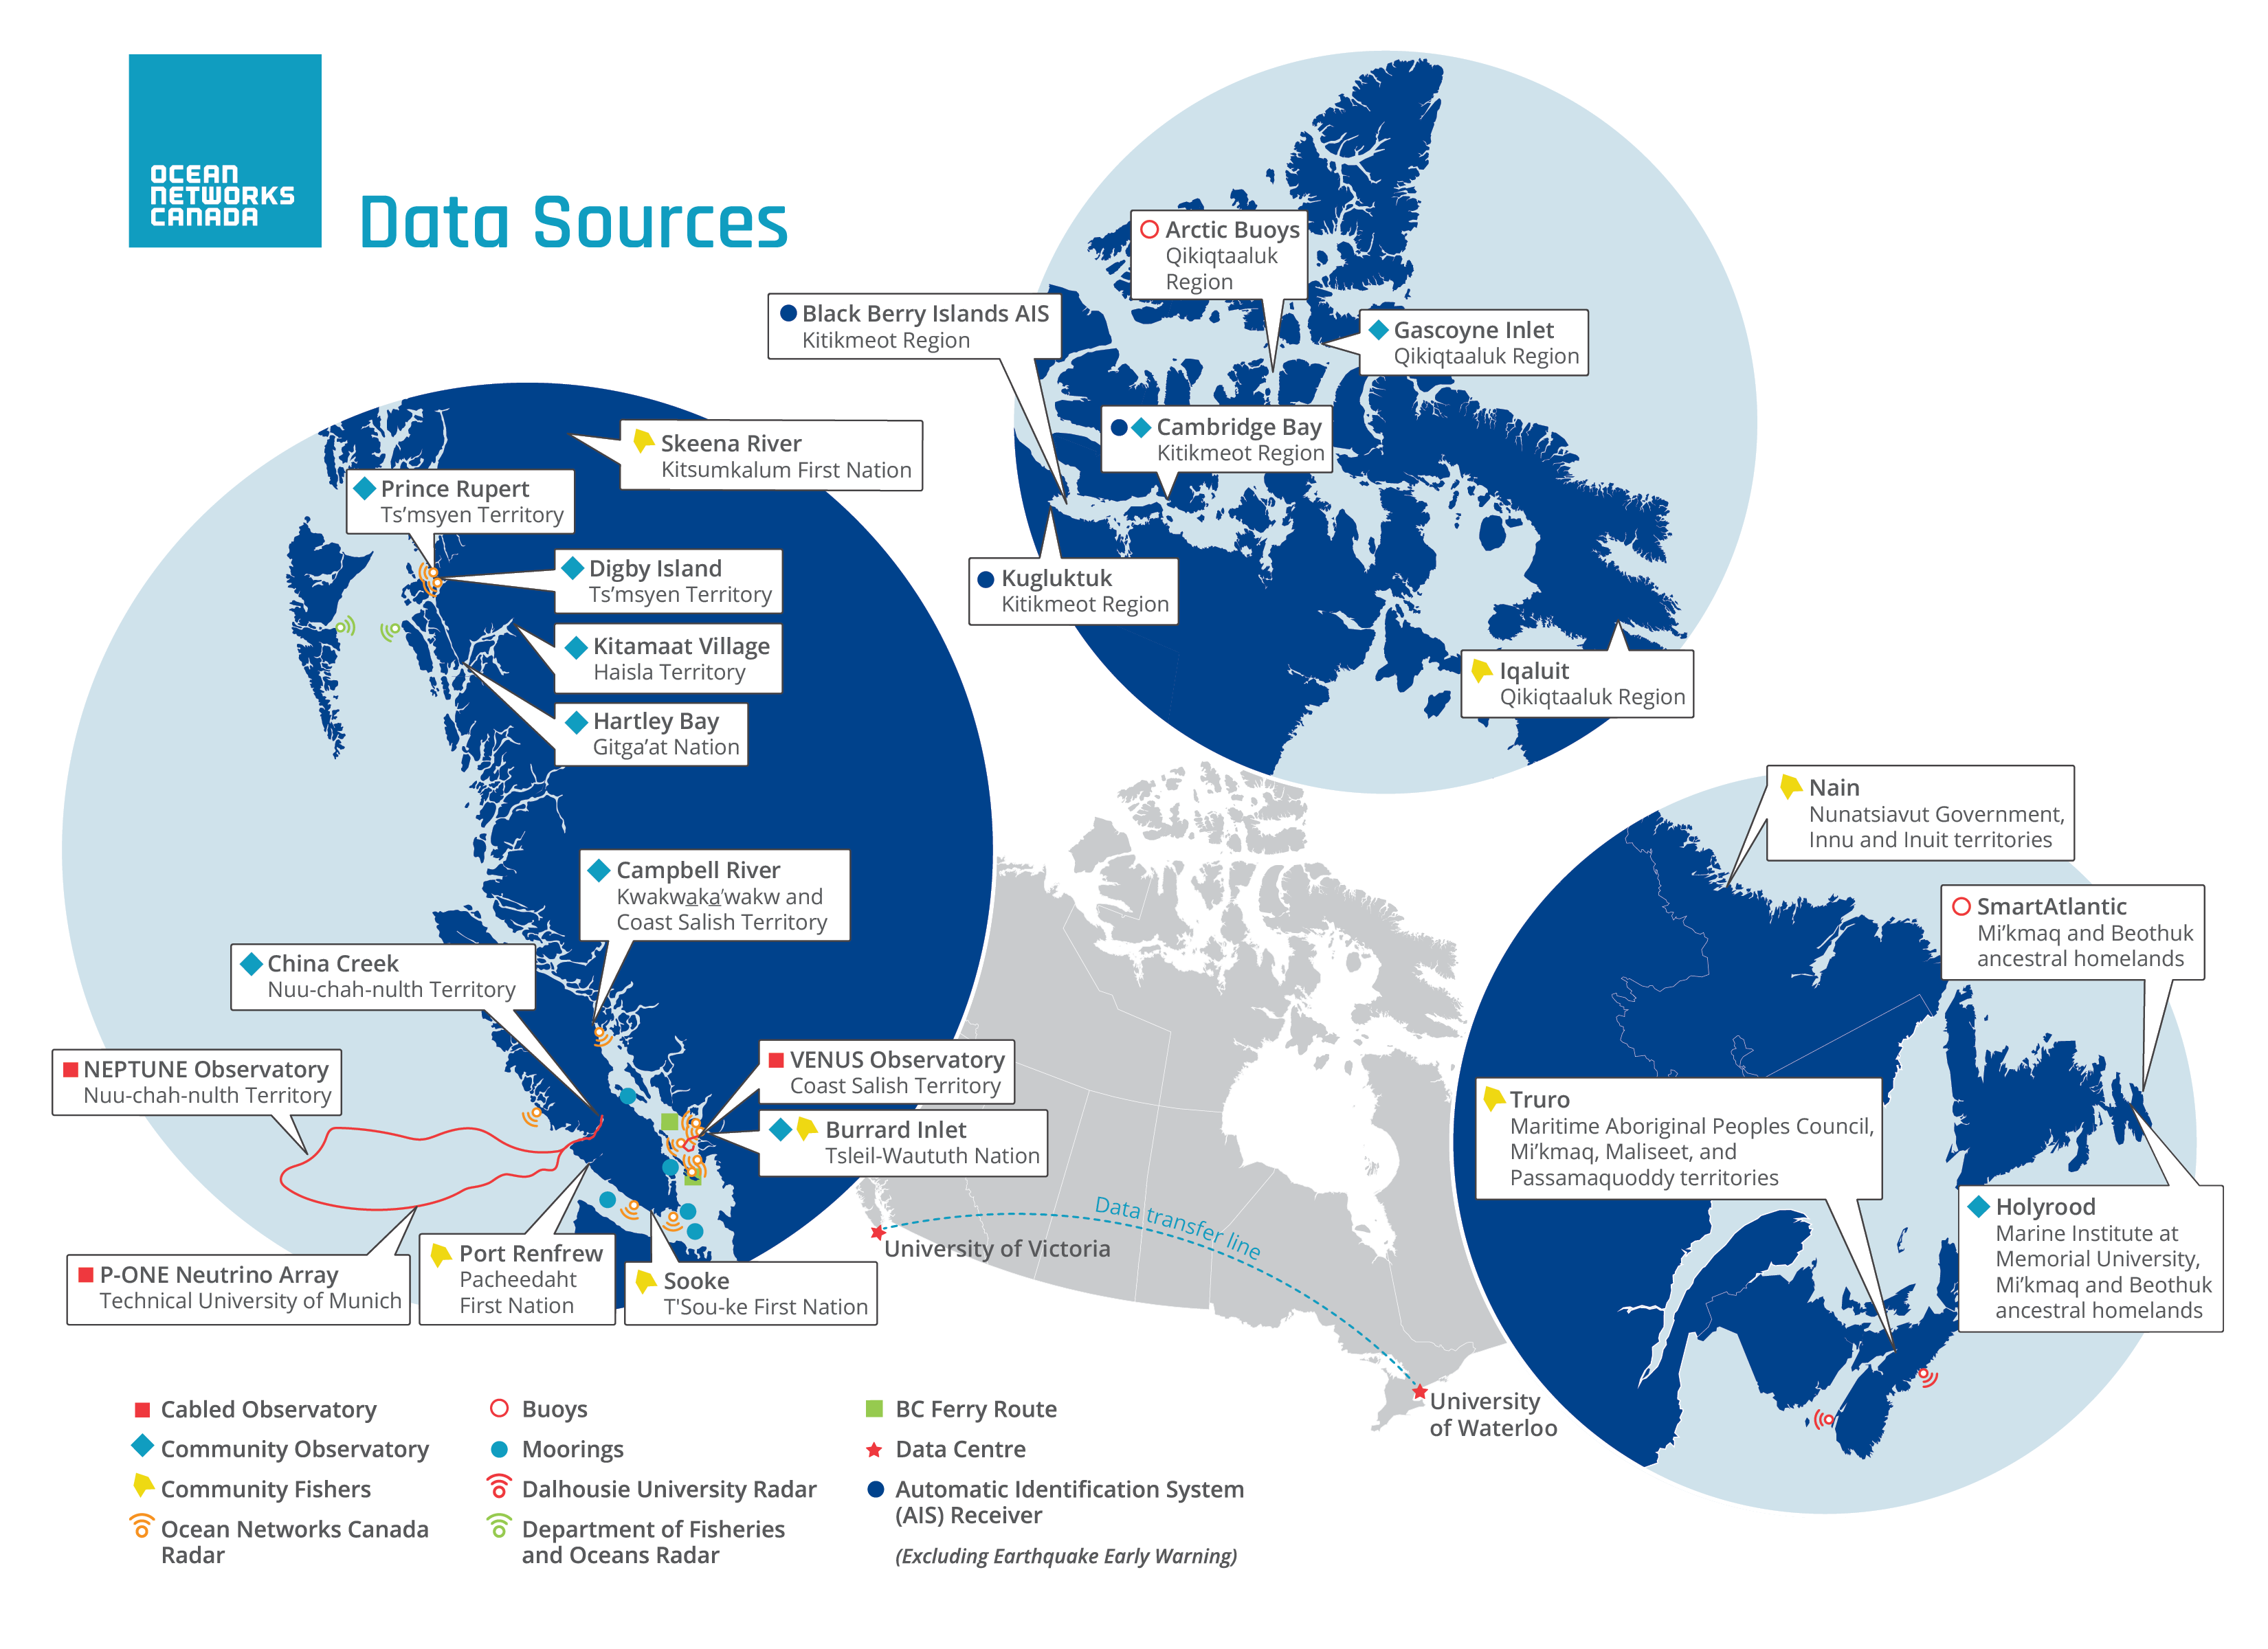
Ocean Networks Canada (ONC) Data Portal
--
https://data.oceannetworks.ca/home <-- Ocean v3.0 Data Portal
--
#GIS #spatial #mapping #Canada #hydrospatial #data #dataportal #OceanNetworksCanada #ONC #marine #ocean #research #fisheries #economics #climatechange #oceanobservation #coast #coastal #boology #chemistry #geology #weather #metrology #usecase #appliedscience #infrastructure #sensors #FirstNation #indigenous #monitoring #training #education #canadaday
@Ocean_Networks
USGS Finds New Way To Measure Ocean Depth With Landsat
--
https://www.usgs.gov/centers/eros/news/usgs-finds-new-way-measure-ocean-depth-landsat <-- shared technical article
--
https://doi.org/10.3390/rs16050843 <-- shared paper
--
#GIS #spatial #mapping #research #remotesensing #earthobservation #landsat #satellite #water #hydrology #marine #hydrospatial #bathymetry #topobathy #elevation #seafloor #Landsat9 #LandsatNext #resolution #PuertoRico #Guam #oceanoptics #atmosphere #coast #coastline
@USGS @landsat @EROS @landsat9

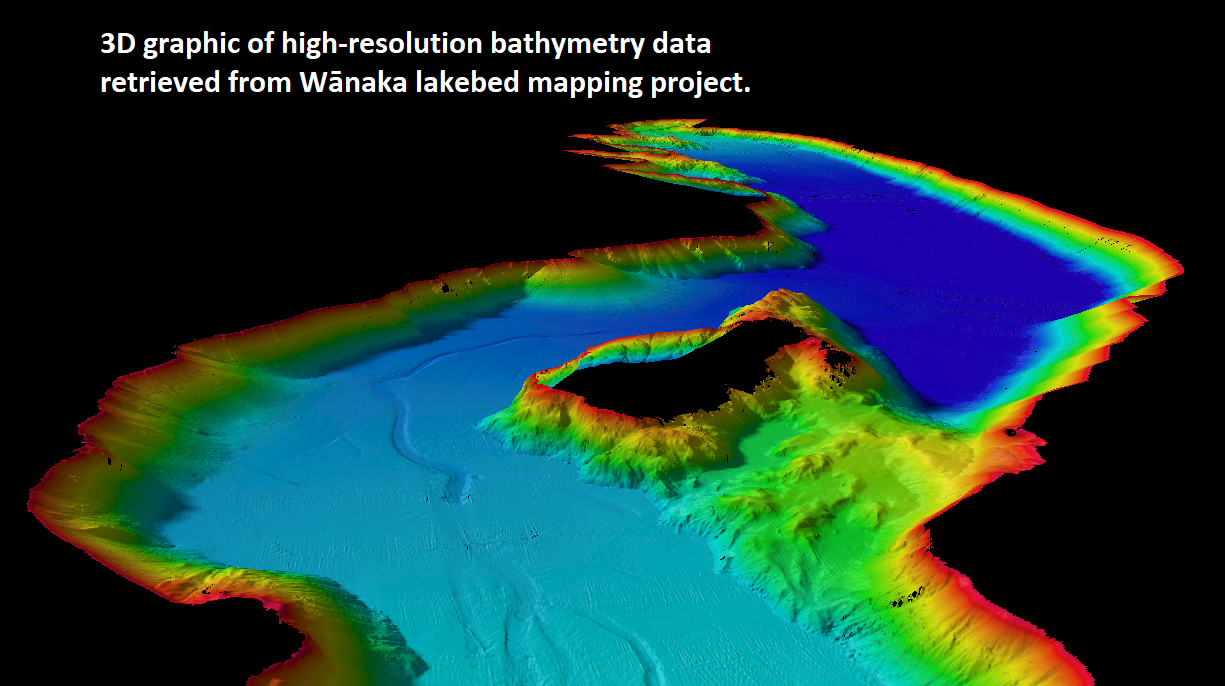
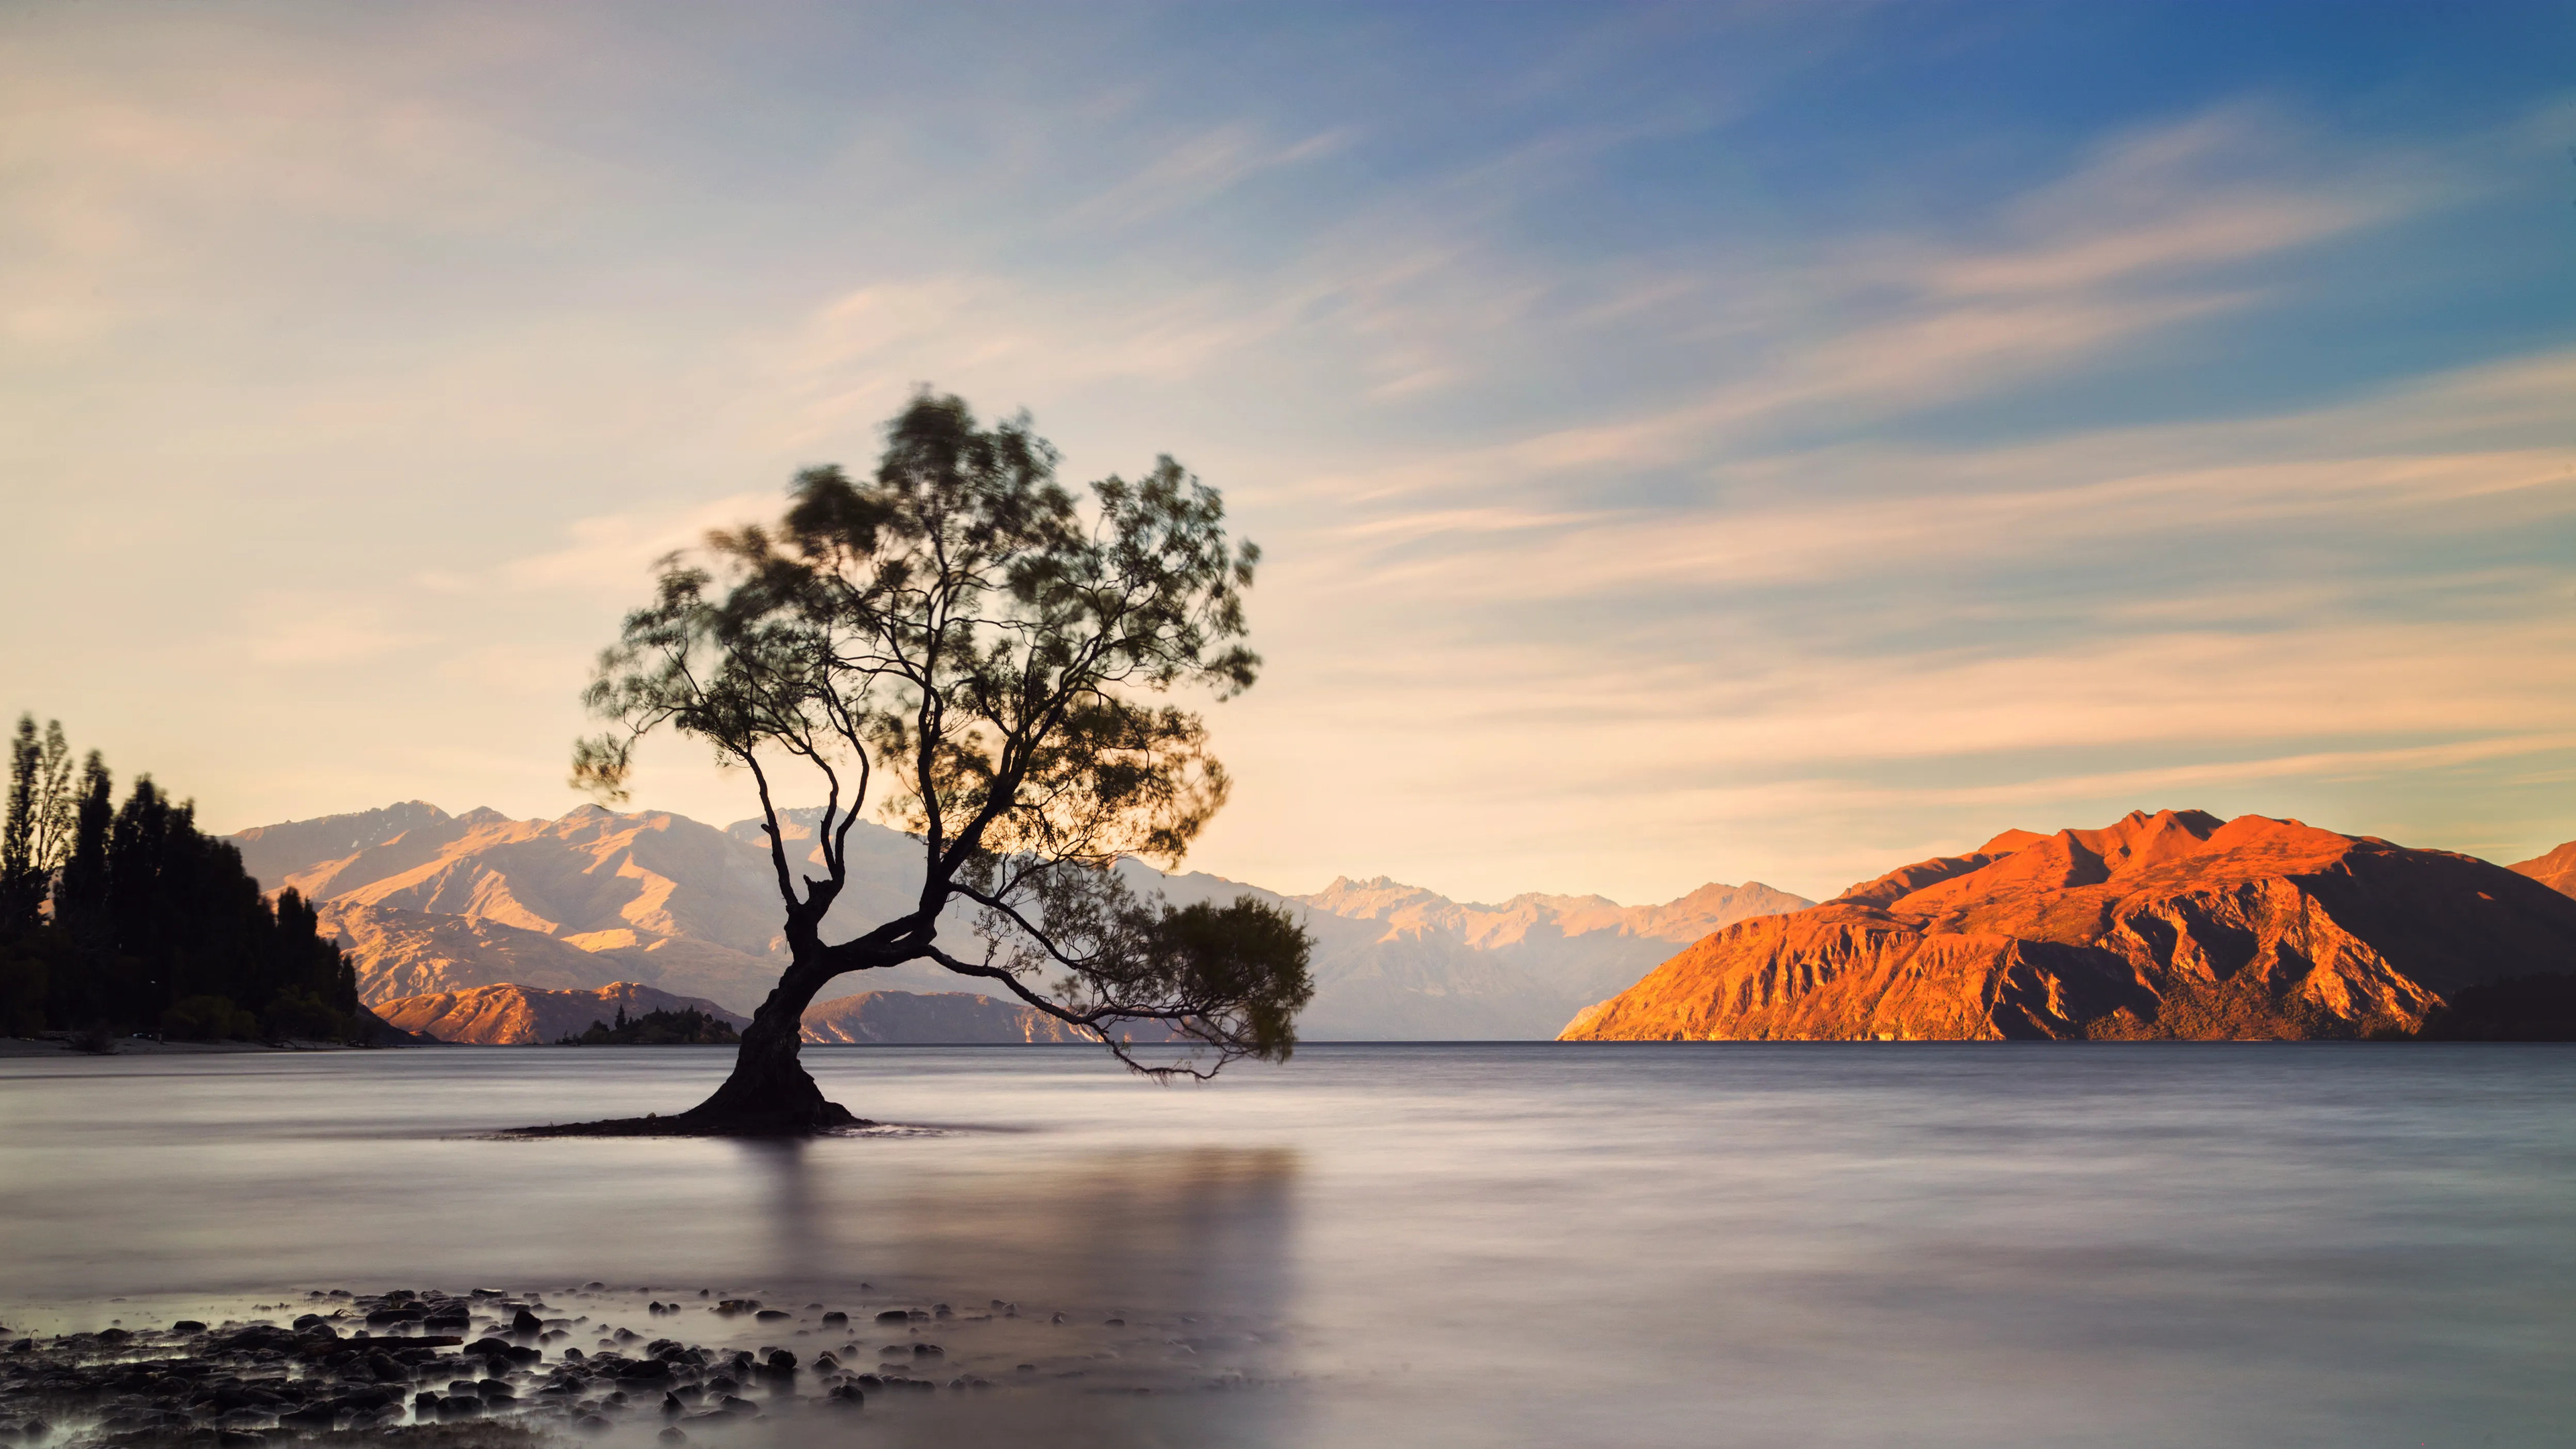
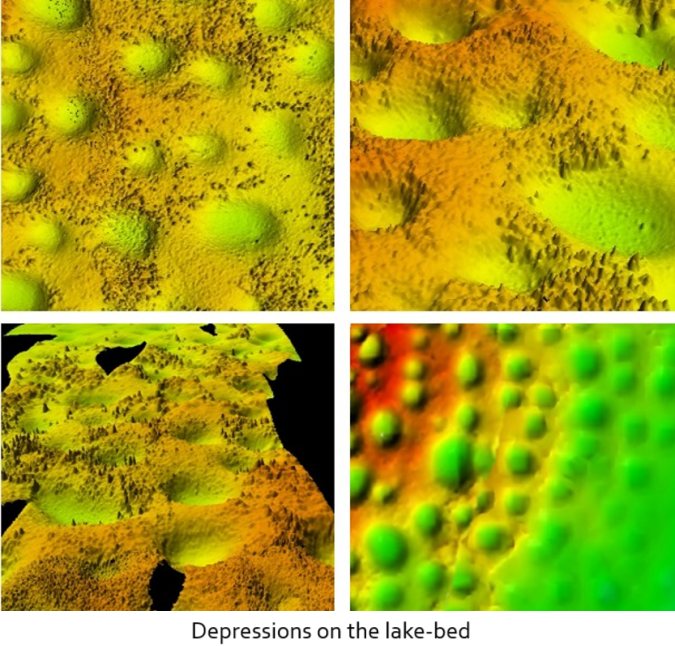
Lake Wānaka Mapped In Exquisite Detail [topobathy, New Zealand]
--
https://niwa.co.nz/news/lake-wanaka-mapped-exquisite-detail <-- shared technical article
--
#GIS #spatial #mapping #hydrospatial #bathymetry #remotesensing #LakeWanaka #Wanaka #NewZealand #topobathy #lake #floor #water #hydrology #survey #underwater #geology #geomorphometry #earthquake #fault #faulting #NIWA #lakebed #glacial #glacier #multibeam #echosounder #3dmodel #waterquality #landuse #freshwater #nutrients #sediment #sedimentation #climatechange #model #modeling #catchments #hydrodynamics
@niwa_nz