#DataExplorer

iCode2Ifeanyi5
2024-11-21

The Graphic Walker Data Explorer has undergone a much needed upgrade.

With a focus on the frontend, it is now simpler, nicer, and more user-friendly than the previous version, having moved away from the side bar, which reduced the display space of the explorer when launched.

You can enjoy the new look here: graphic-walker-data-explorer.n

Would appreciate your feedback, too! 🙏

💧🌏 Greg CocksGregCocks@techhub.social
2024-10-24

OpenET Project – Estimating The Volume Of Evapotranspiration From Remote Sensing Weather & Other Data Sources
--
etdata.org/ <-- link to the project / data resources
--
[sharing of this post does not constitute an endorsement of this product or company]
#GIS #spatial #mapping #remotesensing #OpenET #evapotranspiration #weather #waterresources #watersecurity #watermanagement #water #hydrology #USWest #US #USA #webmaps #EarthEngine #spatialdata #API #ET #farming #agriculture #satellite #DataExplorer #sustainability #irrigation #landsat #waterbudgets #people #ecosystems #environment #groundwater #consumption #planning #budgeting #model #modeling

screen shot - OpenET home pagephoto - SW USA desertphoto - groundwater system in a cropped field, Nebraskaremote sensing imagery - farms in California's Sacramento - San Joaquin River Delta face strict reporting requirements for water useage because the delta supplies most of the state's freshwater; this landsat image uses infrared wavelengths to depict vegetation
Alvin Ashcraft 🐿️alvinashcraft@hachyderm.io
2024-10-10
2023-04-19

News!

We’ve worked to update the HM Land Registry #UKHPI service - incorporating the latest #LocalGovernment boundary changes for the April statistics release.

🔍 Explore the updated #OpenData #LinkedData #DataExplorer here: landregistry.data.gov.uk/app/u

Decorative graphic - dark pink background with bold off white text in centre: #UKHPI updated with April’s Local Government Changes and a small Epimorphics swish logo as the full stop.  Below this a link to the project page: www.epimorphics.com/projects/uk-house-price-index
Jonny Axelssonjaxroam
2022-11-25

@Gurre Frustratingly I can't draw either, annoying as I have urban ideas that would be far easier to visualise than to describe with words.

However with most of these graphs I think I could assist, as there are packages that do this, often people have done them already. Only takes some finding.

, , and other have datasets and . They and others have graph packages.

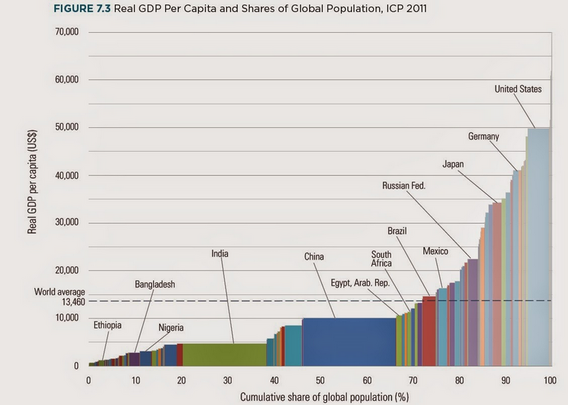
Chart of world's countries' average GDP per capita (in PPP) and stacked horizontally by population. Area shows country's total GDP.
Jonny Axelssonjaxroam
2022-11-22

@eivind

Jøss, andre gang på samme kveld som jeg får bruk for .

Jeg har gjort samme tankeeksperiment selv, hva fører til størst utslipp, ta flyet, bilen, eller gå til Canossa eller hvor det skal være. For det siste alternativet gjør det stor forskjell om du har ost eller bananer som niste.

ourworldindata.org/environment

Jonny Axelssonjaxroam
2022-11-22

@tildalwave @edmat also has a on .

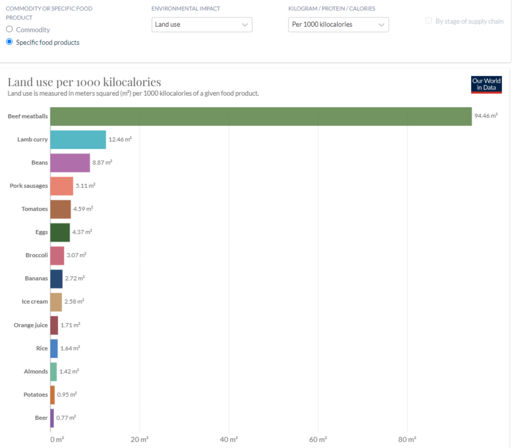
There you can see the impact on , , , and (that was a lot of hashtags), by kg, by amount of protein, fat or kcal.

ourworldindata.org/environment

Example use of the linked data explorer.

Land use per 1000 kcal for a dozen products, from beef meatballs (94.5 m2) to beer (0.8 m2).

Client Info

Server: https://mastodon.social
Version: 2025.04
Repository: https://github.com/cyevgeniy/lmst