#hungatonga

@roewoe1

Dieser Artikel? "Monsun setzt Indiens Metropolen zu"
orf.at/stories/3395670/
Der ist aber wirklich sehr gut. Finde ich.

Deine Vermutung, dass der starke Regen im Mai in Mumbai und wohl bis runter nach Bangalor dem Klimawandel geschuldet wäre, muss nicht stimmen.

Bangalore hat diesen Mai tatsächlich die höchste monatliche Regensumme seit Aufzeichnungsbeginn 1901 gehabt: 569.7mm
Von Mumbai hab ich keine Daten.
Da Mai ja eigentlich noch gar nicht zum Monsoon gehört, ist das besonders herausragend.

Aber.
Da es keinen Trend gibt, dem Mai 2025 bloß eine Krone aufgesetzt hätte, muss man wohl auch woanders nach Gründen gucken. Und da bietet sich die Vulkanexplosion #HungaTonga im Januar 2022 an, deren Injektion von Wasserdampf in die Stratosphäre nämlich noch immer ihr Unwesen treibt.
Jucker et al 2024 haben das für Temperatur und Regen modelliert journals.ametsoc.org/view/jour
Die Autoren haben auch einen Prosa-Artikel geschrieben: theconversation.com/tongas-vol

Die Veränderung im Regen rund um Indien ist für die Jahre 2025-2029 für Juni-August als eine der drei stärksten Veränderungen global modelliert worden.
Ich zähle Mai 2025 zu den Monaten Juni-August – und hab meine Erklärung für diese herausragende Regensumme in Bangalore. Klimawandel nicht nötig.

4 maps for significant temperature change due to H2O vapour from Hunga Tonga explosion for the 3 month groups DJF, MAM, JJA, SON in year 3 to 7 after the explosion. 
"Significant" means, the authors only plotted those signals that were significantly different to the climatology 2005-2021. 
For DJF, significant anomaly in °C is:
colder in Scandinavia, warmer in North Africa, hotter in South-West Asia, hotter in Canada, cooler in Antarctica. 

MAM: hotter in East Eurpoe and Russian arctic, cooler in Greenland and East Canada.

JJA: warmer in Arctic, cooler in Australia, hotter in West-Antarctica.

SON: hotter in Arctic, cooler in Mongolia. 

Image also shows 4 maps for significant precipitation anomaly in those months groups for year 3-7 after the explosion. 

DJF increase in Europe, SouthEast Asia and Oceania
MAM decrease in central Europe, Southern Canada
MAM increase in  Australia, Indonesia
JJA decrease in East Europe, central America.
JJA increase in Southwest and North-West Europe, Australia, South and SouthEast Asia.
SON decrease several regions in South America, all over Africa, Indonesia
SON increase west Europe, East Canada

Read more about the study in the pub-sci article written by the authors themselves: 
https://theconversation.com/tongas-volcanic-eruption-could-cause-unusual-weather-for-the-rest-of-the-decade-new-study-shows-231074

DOI: 10.1175/JCLI-D-23-0437.1

@GhostOnTheHalfShell @Su_G @petergleick

Word!
Remember after #HungaTonga in January 2022? When some cli-sci said, the effect of the water vapour in the stratosphere on global climate would be negligible?
Negligible my ass.
England and Northern Germany drowned in winter 2023 and again 2024. And again in January 2025. Including winter crops. Due to HungaTonga.
Negligible my ass.
Central and Northern Europe has its driest spring ever this year since records began. Happy sowing season in dust! Happy pollination without water for insects! Due to HungaTonga.

Jucker et al 2024 shows this as "significant" European deviation from the 2005-2021 average.

Oh, but global average temperature only gained a temporary 0.03°C from HungaTonga, so what...
These types of cli-sci really don't get WHY they're doing what they do.

And the fact that these types of cli-sci who have net zero instinct for impacts on society, are so prominent in the public makes it even worse.

4 maps for significant temperature change due to H2O vapour from Hunga Tonga explosion for the 3 month groups DJF, MAM, JJA, SON in year 3 to 7 after the explosion. 
"Significant" means, the authors only plotted those signals that were significantly different to the climatology 2005-2021. 
For DJF, significant anomaly in °C is:
colder in Scandinavia, warmer in North Africa, hotter in South-West Asia, hotter in Canada, cooler in Antarctica. 

MAM: hotter in East Eurpoe and Russian arctic, cooler in Greenland and East Canada.

JJA: warmer in Arctic, cooler in Australia, hotter in West-Antarctica.

SON: hotter in Arctic, cooler in Mongolia. 

Image also shows 4 maps for significant precipitation anomaly in those months groups for year 3-7 after the explosion. 

DJF increase in Europe, SouthEast Asia and Oceania
MAM decrease in central Europe, Southern Canada
MAM increase in  Australia, Indonesia
JJA decrease in East Europe, central America.
JJA increase in Southwest and North-West Europe, Australia, South and SouthEast Asia.
SON decrease several regions in South America, all over Africa, Indonesia
SON increase west Europe, East Canada

Read more about the study in the pub-sci article written by the authors themselves: 
https://theconversation.com/tongas-volcanic-eruption-could-cause-unusual-weather-for-the-rest-of-the-decade-new-study-shows-231074

DOI: 10.1175/JCLI-D-23-0437.1Map of Europe from the EU Crop Monitor with colour-coded water deficits, water excess, and sowing delay.
All of Europe from Paris, Benelux, Germany, to the Baltics and Southern Scandinavia and parts of Turkey have water deficits.
Excess in Northern Italy. 
Sowing delay in South-East Europe. 

Source: https://joint-research-centre.ec.europa.eu/jrc-news-and-updates/yield-outlook-remains-cautiously-positive-2025-04-22_en

1) Das lodernde Sauerland hatte diesen Feb+März nur 15% des üblichen Regens, Rekord seit 1888. Im trockenen Wald breitet Feuer sich fix aus. Nasser Wald brennt nicht.
2) Kumulatives Feuer-CO2 basiert auf Hitzebeobachtung per Satellit: So heiß wie bis 15.April brannte es bisher frühestens bis 17.Juni!
Dass es nicht geregnet hat, muss aber nicht am Klimawandel liegen. Man sieht ja auch, dass es in den frühen Stationsjahren am Kahlen Asten durchaus mal vorkam.

3) Verdächtig ist eher HungaTonga!👇
Der Wasserdampf, den #HungaTonga in die Stratosphäre brachte, treibt dort noch immer sein Unwesen.
Für März bis Mai im Jahr 3 bis 7 nach der Explosion haben Jucker et al 2024 nämlich zB signifikant weniger Regen für Deutschland und Polen dadurch ausgemacht.

Falls es Klimawandel-bedingt von Februar-15.April zu warm war, wäre auch der Dampfhunger der Luft größer u hätte Pflanzen u Boden zusätzlich für den Brandstifter 🚬🔥vorgetrocknet. Das hab ich jetzt aber nicht geguckt.

Line chart for rain sum Februar+March since 1888 for 2 stations in the region Sauerland.
Kahler Asten station is on 839m elevation, Lennestadt is on 286m and located 60km west of Kahler Asten.
The rain evolution for both is very similar except Kahler Asten receives a bit more rain.
The alltime-average for rain Feb+Mar is 190mm and 157mm respectively. 
In 2025 however, both stations received 27mm in both months together. Record-low for both.
Years 1890, 1920, 1923, 1929 and 2012 came close. 
There's no trend, no reduction nor gain. Year-on-year variability is large: quite usual is from 80mm to 330mm, with 2 peaks at 500mm.


source:  opendata.dwd.de/climate_environment/CDC/observations_germany/climate/daily/kl/recent/Copernicus weekly fire statistics since 2006 for Germany as 4 line charts.
Noteworthy:
while the weekly cumulated burnt area has reached the alltime-maximum for this time of year. But the large jump in CO2 from fires in the past 2 weeks has no equivalent to the area burnt in the same time frame. That was quite small in the past 2 weeks. 
Which means: the fires detected by the satellite in the past 2 weeks were burning particularly hot.
Because the land was particularly dry!


source: https://forest-fire.emergency.copernicus.eu/apps/effis.statistics/seasonaltrendWeltkarte der signifikanten Regenabweichung März bis Mai vom Mittel der vorhergegangenen 20 Jahre. 
Osteuropa und auch Ostdeutschland sind leicht trockener, Norwegen leicht feuchter. 
Starke Abweichungen gibt es vor allem von Australien hoch über Papua Neuguinea und bis Japan. Im unteren Teil ist mehr Regen als Folge der Explosion modelliert worden. Südliches Japan kriegt weniger Regen, nördliches Japan mehr. 
Dann gibts im Mittel-Pazifik noch zwei parallele Strecken mit stark weniger Regen. 
Sonst noch einige, aber nur schwache Abweichungen. 
Im Amazon, im Nordosten Brasiliens soll es leicht mehr regnen. Das wär ja schön. 

Source: https://journals.ametsoc.org/view/journals/clim/37/17/JCLI-D-23-0437.1.xml
2025-03-12

Forschende untersuchen mit der Messkampagne #ASCCI den Einfluss von #Ozon und #Wasserdampf auf den arktischen #Klimawandel.

Das #Forschungsflugzeug #HALO misst Spurenstoffe in der #Stratosphäre, um Prozesse wie den #Ozonabbau und die Auswirkungen des #HungaTonga-Ausbruchs zu analysieren.

Die Ergebnisse helfen, klimatische Veränderungen besser zu verstehen und #Satellitenmissionen wie #CAIRT vorzubereiten.

kit.edu/kit/pi_2025_018_flugze

#Arktis #Klimaforschung #Atmosphäre #Luftschadstoffe #KIT

💧🌏 Greg CocksGregCocks@techhub.social
2025-01-22
maps - Concentrations of chlorophyll a spanning a period of 10 days in the region near Hunga Tonga-Hunga Haʻapai (HTHH), whose position is depicted as a red triangle. (a) 11 January, before the main HTHH eruption; (b) 16 January, with the first available observations after the main eruption; (c) 21 January, 6 days after the eruption. The largest landmass (brown in the figure) to the south of HTHH is the island of Tongatapu. Black areas depict missing observations.satellite images - True color images of the Hunga Tonga-Hunga Haʻapai (HTHH) region from the geostationary satellite GOES-West. (a) Aerial emission linked with the volcanic activity on 13 January; (b) Ash plume emitted during the main eruption on 15 January. Red lines depict the coastline and the yellow triangle depicts the position of the HTHH volcano.maps - Estimates of chlorophyll a (a, c) and normalized fluorescence line height (nFLH) (b, d) from the MODIS Aqua satellite. (a, b) Satellite image from 16 December 2021, before the beginning of the Hunga Tonga-Hunga Haʻapai (HTHH) volcanic activity; (c, d) Satellite image from 17 January 2022, 2 days after the main volcanic eruption. Values of nFLH have been corrected for changes in nonphotochemical quenching. Black areas depict missing observations.satellite view - ESA - 2022 Submarine Eruption Of The Hunga Tonga-Hunga Haʻapai Volcano
scinexx - das wissensmagazinscinexx@nrw.social
2024-11-07

Auslöser der Tonga-Eruption gefunden? Stärkster Vulkanausbruch der letzten Jahrzehnte begann an einer kleinen Schwächezone. #Tonga #Vulkanausbruch #HungaTonga #Vulkan #Unterseevulkan #Eruption
scinexx.de/news/geowissen/ausl

💧🌏 Greg CocksGregCocks@techhub.social
2024-11-05

A Seismic Precursor 15 Min Before The Giant Eruption Of Hunga Tonga-Hunga Ha'apai Volcano On 15 January 2022
--
doi.org/10.1029/2024GL111144 <-- shared paper
--
"KEY POINTS:
• The volcano generated Rayleigh waves about 15 min before the giant eruption with no apparent surface activity
• These waves dominated in 0.03–0.1 Hz with amplitudes comparable to the amplitude of M4.9
• Seismic stations 750 km from the volcano and appropriate data analyses allowed [them] to capture precursors of the catastrophic eruption..."
#geology #seismology #tonga #volcano #eruption #vulcanism #HungaTonga #RayleighWave #earthquake #precursor #remotesensing #imagery #satellite #HTHH #model #modeling #spatialanalysis #spatiotemporal #caldera #seismicstation #monitoring #naturalhazard #naturaldisaster #risk #hazard #engineeringgeology

geology cross sections / schematics - Schematic cross-section of the HTHH before the January 15 eruption (Alvarez & Camacho, 2023) (a), the eruption onset shortly after 4:00 (b), and the climactic phase starting around 04:15 (c). A scenario from the precursor to the eruption consists of high-pressure magma beneath some parts of the circular weak zone (d), tensile fracture generating the precursor around 03:45 (e), penetration of magma, magmatic gas, and seawater into the fracture (f), and magma-water interaction triggering the eruption (g).map and chart - (a) A map (Google Earth) of the seismic stations (MSVF and FUTU) about 750 km from the HTHH. The yellow lines are the azimuth range of the Rayleigh wave arrivals at each station (See Section 3). The azimuths, 
, defined clockwise from the north, are estimated in a 64-s-long time window shifted every 4 s in 03:47:29–03:52:29 on 15 January 2022. The right panels show the results at MSVF (b) and FUTU (c) as functions of the product of vertical-to-north and vertical-to-east cross-correlation coefficients, representing the prominence of the Rayleigh wave in data. Red data points with good correlation (
0.83) are used for drawing the yellow lines in panel (a). The horizontal red dotted lines are the geographical directions from the stations to HTHH.photos - sequences - eruption of Hunga Tonga-Hunga Ha'apai Volcano, Tonga, 2022charts - (a) The RMS of vertical velocity components in 0.04–0.08 Hz, 
, observed at MSVF (blue) and FUTU (orange). The vertical-to-horizontal cross correlation coefficients are displayed in panels (b–e) by colors: (b) 
 and (c) 
 at MSVF, (d) 
 and (e) 
 at FUTU. The common horizontal axes are the time of January 15, from 02:30 to 04:45. All functions are calculated in 64-s-long windows, and the values are displayed at the windows' central time. The vertical axes in panels (b–e) are the time delay, 
, of 
 relative to the horizontal components. The red vertical reference lines are at 03:49:20, 04:04:46, and 04:17:48, respectively. The orange arrows indicate the prominent Rayleigh wave pattern. (f–g) The transients of the Rayleigh wave power estimated in 0.07–0.09 Hz using 
 at MSVF (blue) and 
 at FUTU (orange) for the precursor (f) and the M5.8 earthquake (g). The times of the peaks and troughs of the transients, labeled by the circled numbers, are shown. The time differences are ①36 s, ②32 s, ③23 s in panel (f) and ①29 s, ②32 s, ③30 s in panel (g).

reuters.com/investigates/speci

Cool webstory by Reuters about future Iceland's and global volcanic eruptions to be triggered by retreating glaciers, when the weight of the ice is no longer keeping a lid on magma chambers.
Apart from neat writing, it's with video, lotsa photos, animated charts and everything one can think of to be included in #scicomm

tldr: yes, volcanic eruptions will increase with the retreat of glaciers. #Antarctica's volcanos too. #Earthquake activity has already been picking up in Iceland since 2021, also elsewhere in the #Arctic near glaciers, and around the globe.

It has happened before when Earth crawled out of the last #iceage into the #Holocene.

I might add: it happened not only at volcanos near glaciers. Rising #sealevel has triggered near-coastal volcanos, too, whether above or below the water. IIRC, a study on Stromboli proved it.

I personally think, #HungaTonga's eruption could have been one of the first submarine volcanos to have been triggered by #climateChange Another submarine volcano erupted near Japan in 2021 or 2022, forgot its name, starts with an O...
Not as huge an explosion like Hunga Tonga tho.

#paleoclimate #volcano #Iceland #volcanism #glacier

@Global_Repercussions @PaulWermer @dan613

Wrt #Hungatonga and the past 13 months: Jucker et al mapped the multi-year effect of the water vapour on precipitation, temperature and jet stream in a detailed global grid.

Their layman's prose article says specifically that according to their results HungaTonga is no factor at all in the bananas phenomenon.
theconversation.com/tongas-vol

Obviously the past months pique everyone's curiosity and I see no reason why we should not speculate wildly what the reasons might be. We are The Society. The science law does not fall into our jurisdiction, so to speak. That people like Rahmstorf don't speculate if they can't back it up with sciency looking stuff – that's fine. I'd rather people like him not speculating without a sliver of attempted proof.
But this rule doesn't apply to us, The Society.

The land carbon sink net collapsed in 2023. A station in Australia Cape Grim capegrim.csiro.au received the signal in January 2024ff. Later than other stations due to delay in atmospheric mixing.

El Nino is a CO2-intense phase. One can sync the CO2 growth rate in the Cape Grim time series to, for example, the ElNino phase 2016 by moving the monthly growth values 8 months back. This sort of helps to triangulate the CO2 sources that arrive in Cape Grim during El Nino phases. Having done that, one sees that last year's Nino CO2 source arrived at Cape Grim earlier than the signals in other Nino years. This points to a CO2-origin that is close by in terms of atmospheric mixing. Close by = in the Southern Hemisphere.

So. The drought in the Amazon? Something like intensified ocean upwelling?
Or... was the mixing stronger and quicker this time than in 2016 or 1997?

3 line charts with El Nino Index and CO2 growth in Cape Grim. Top chart original CO2 growth together with the MEI flavour of ENSO.
Middle chart is the same but moved 8 months back to sync with El Nino 2016. And as described in the post, in 2023/2024, the CO2 signal arrived 4 months earlier than El Nino began in reality. Whereas for example the CO2 signal in the 1997 El Nino arrived 4 months later, pointing to a CO2 source that is further away from Cape Grim in terms of atmospheric mixing. Further away than the 2016 source and also than the 2023/2024 source.  
Bottom chart is just the SST anomaly at ENSO3.4 and Cape Grim's CO2 growth synced to El Nino 2016.
2024-07-29

This week's Featured Links post has links to articles about how the summer COVID surges in the US and Canada say about our long-term future with the disease, a near disaster on a Shuttle mission in 1999, and a new study that disputes Hunga Tonga volcano's role in 2023–24 global warm-up.

coredump3.blogspot.com/2024/07

#Books, #OctaviaButler, #COVID19, #History, #Science, #SFF, #Space, #Volcanos #HungaTonga #ClimateChange

#HungaTonga was on the top of my list of suspects for the bananas year 2023. #Jucker et al's preprint on modelling the effect on #weather was my go-to for months. It has been peer-reviewed and published by now 🔒 journals.ametsoc.org/view/jour
or : d197for5662m48.cloudfront.net/

It just now occurred to me: their model comparison only flags *significant* changes over a planet without water injection into the #stratosphere. And what's more: in year1 after the eruption, which is 2023, only the jet stream showed significant changes. Not temperature. This realisation kinda proves to me that HungaTonga wasn't significant at all wrt temperature in 2023.

Wanting to double-check my realisation with the author on Twix, I found instead his tweet with his writeup in TheConversation💃 theconversation.com/tongas-vol

" This means that the incredibly high temperatures we have measured for about a year now cannot be attributed to the Hunga Tonga eruption." 💃

But like I suspected: the ultra-wet winter with damages in infrastructure, soil and crops in Western Europe was due to HungaTonga by way of its effect on the #jetstream.

And it will be repeated: "For the northern half of Australia, our model predicts colder and wetter than usual winters up to about 2029. For North America, it predicts warmer than usual winters, while for Scandinavia, it again predicts colder than usual winters."

... One more thing::::
Sadly, the #Arctic in year 3 to year 7 is modelled to warm by 0.5°C due to HungaTonga. Put that on top of the potentially permanent bananas heating in 2023 and 2024... then sea ice will shrink, albedo lost, fresh water dilute the AMOC, polar bears lose their cups.

And the temperature gradient between Arctic and equator will be less.
Which probably leads to stalling jetstream wave patterns. Stalling wave patterns spell heat and drought (and crazy omega blockings with heavy rain events). All of which makes crop loss likely in the bread baskets USA, Europe, Ukraine, Russia.
Like in 2018. But 5 years in a row...
OMG...fck

Redaktion kalmenzonekalmenzone
2024-07-18

Könnte die ungewöhnlich regenreiche Witterung der letzten Monate einen hintergründigen Zusammenhang mit Frankenstein, Byrons "Darkness" oder Polidoris "Vampir", kurz: dem Jahr ohne Sommer bzw. vulkanischen Winter 1816 haben? Eine vorläufige, trotzdem differenzierende Antwort wird hier versucht:
vulkane.net/blogmobil/hunga-to

2024-06-10

Good piece on the #HungaTonga eruption and it's (tiny to non-existent) impact on our climate from @andrewdessler .
I think my biggest takeaway from the attribution work is that (some) people will do almost anything to avoid accepting human emissions are driving climate change. open.substack.com/pub/theclima

Martin Kosteramartin@libera.site
2024-06-01
Já jsem to říkal! Já jsem to říkal!
A vy jste mě neposlouchali! 🤪

Hunga Tonga byla zcela výjimečná. Udělala ze Země saunu(alespoň dočasně) a vůbec netušíme, co to ještě udělá. Ty poslední teplotní rekordy klidně můžou být následek tohoto skokového zvýšení vlhkosti v atmosféře.

ScienceAlert wrote the following post Sat, 01 Jun 2024 01:00:29 +0200 Giant Tonga Volcanic Eruption Could Disrupt Weather For Years to Come
https://www.sciencealert.com/giant-tonga-volcanic-eruption-could-disrupt-weather-for-years-to-come?utm_source=flipboard&utm_medium=activitypub

Posted into ScienceAlert @sciencealert-ScienceAlert

#HungaTonga #GlobálníOteplování #GlobalWarming

The Department of Earth-Shattering Kabooms is open for business, but with some unavoidable delays after this #HungaTonga #volcano Sunday Morning Volcano post. flighttowonder.com/2024/05/05/

Obviously, I now must investigate if 1994-1995 and 2016-2017 were in other ways similar to 2023-2024. My favourite culprit would be #HungaTonga – because it's treated as such an underdog in the 2023 discussion that I simply MUST side with that volcanic explosion.😁 (Really, how can they dismiss it? The explosion was HEARD in Alaska, 6000km away... !! Just because as submarine volcano it didn't emit much SO2? That's speci-ist!😁)

August-2016 was preceded by two VEI-4 eruptions in 2015 April and May. That's 17 months between eruptions and the 12 months freak growth rate in North Atlantic 35-50°N. Much like HungaTonga's 18 months between January 2022 and freak 2023-June.
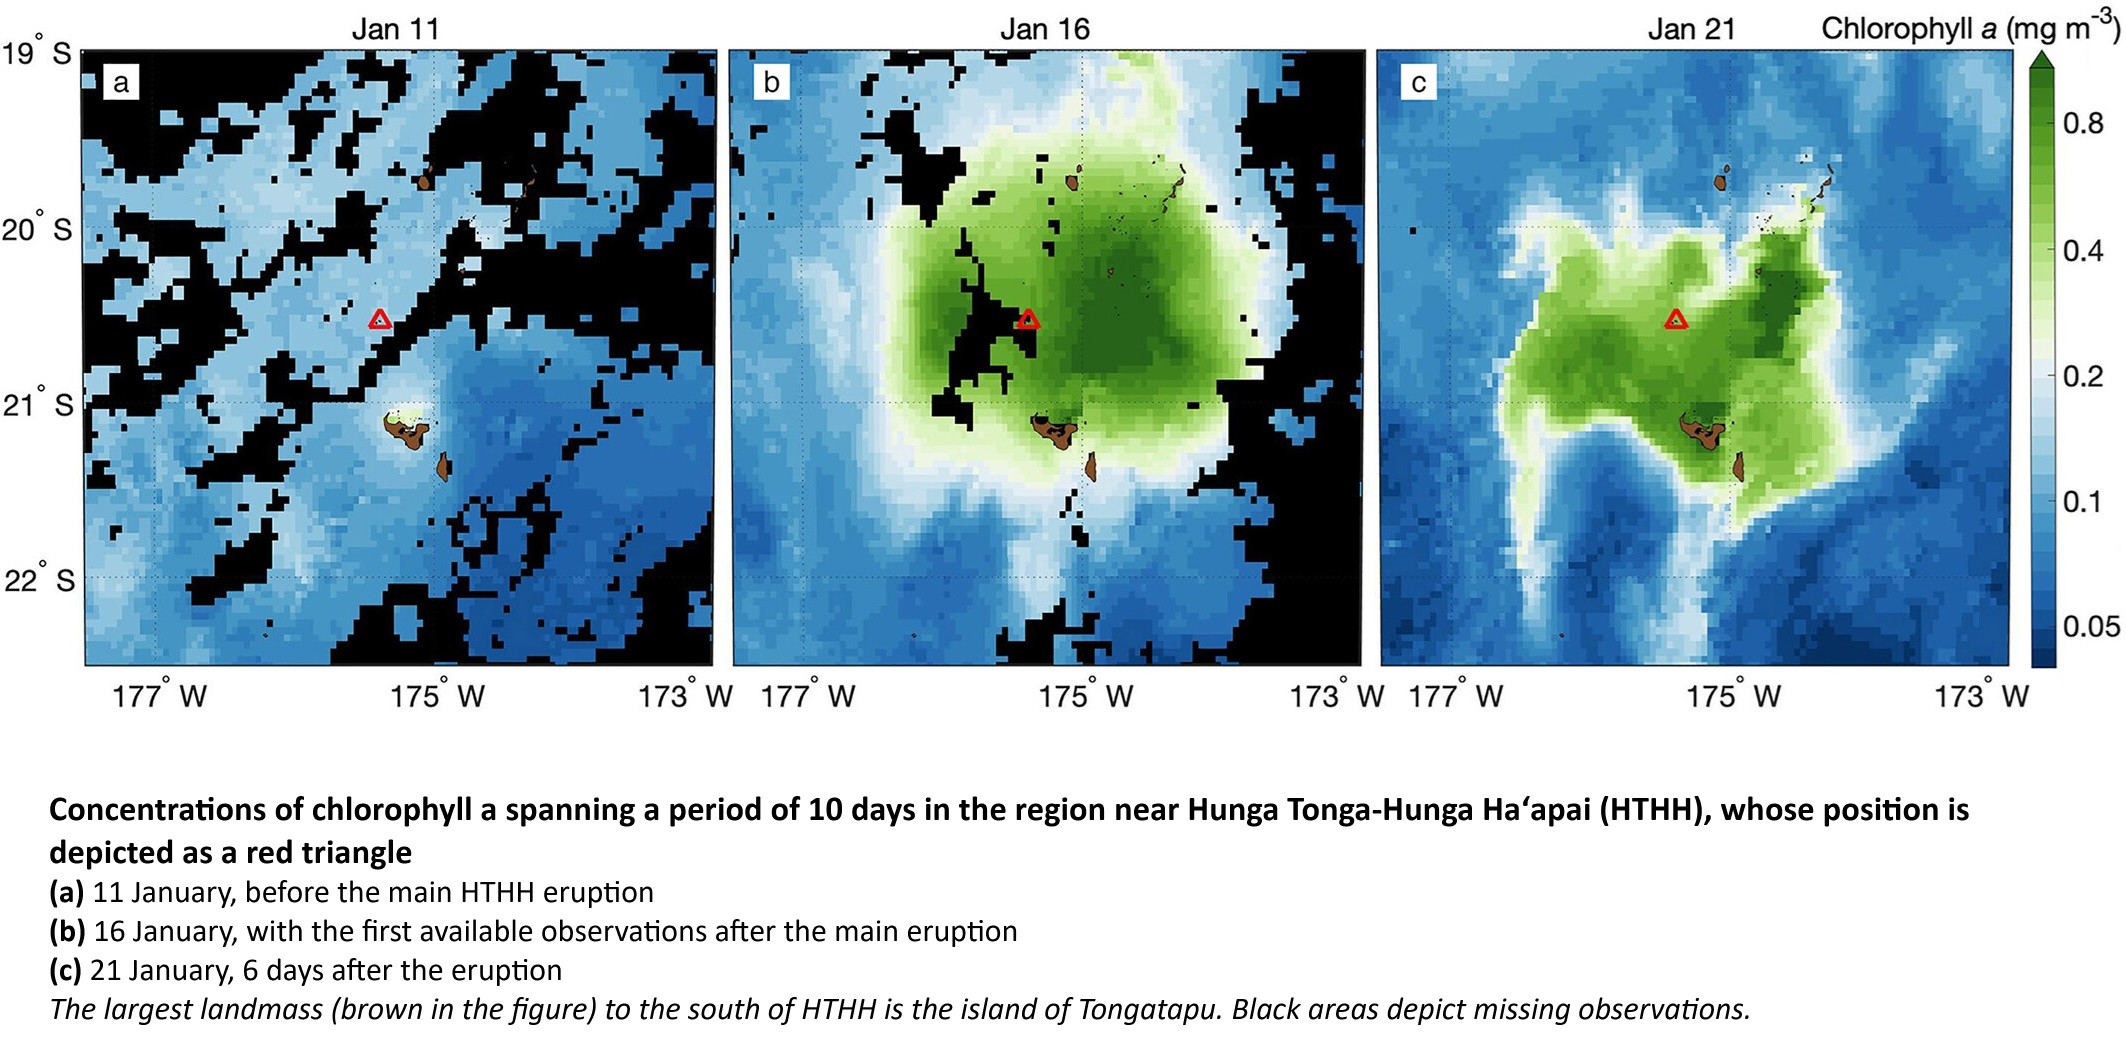
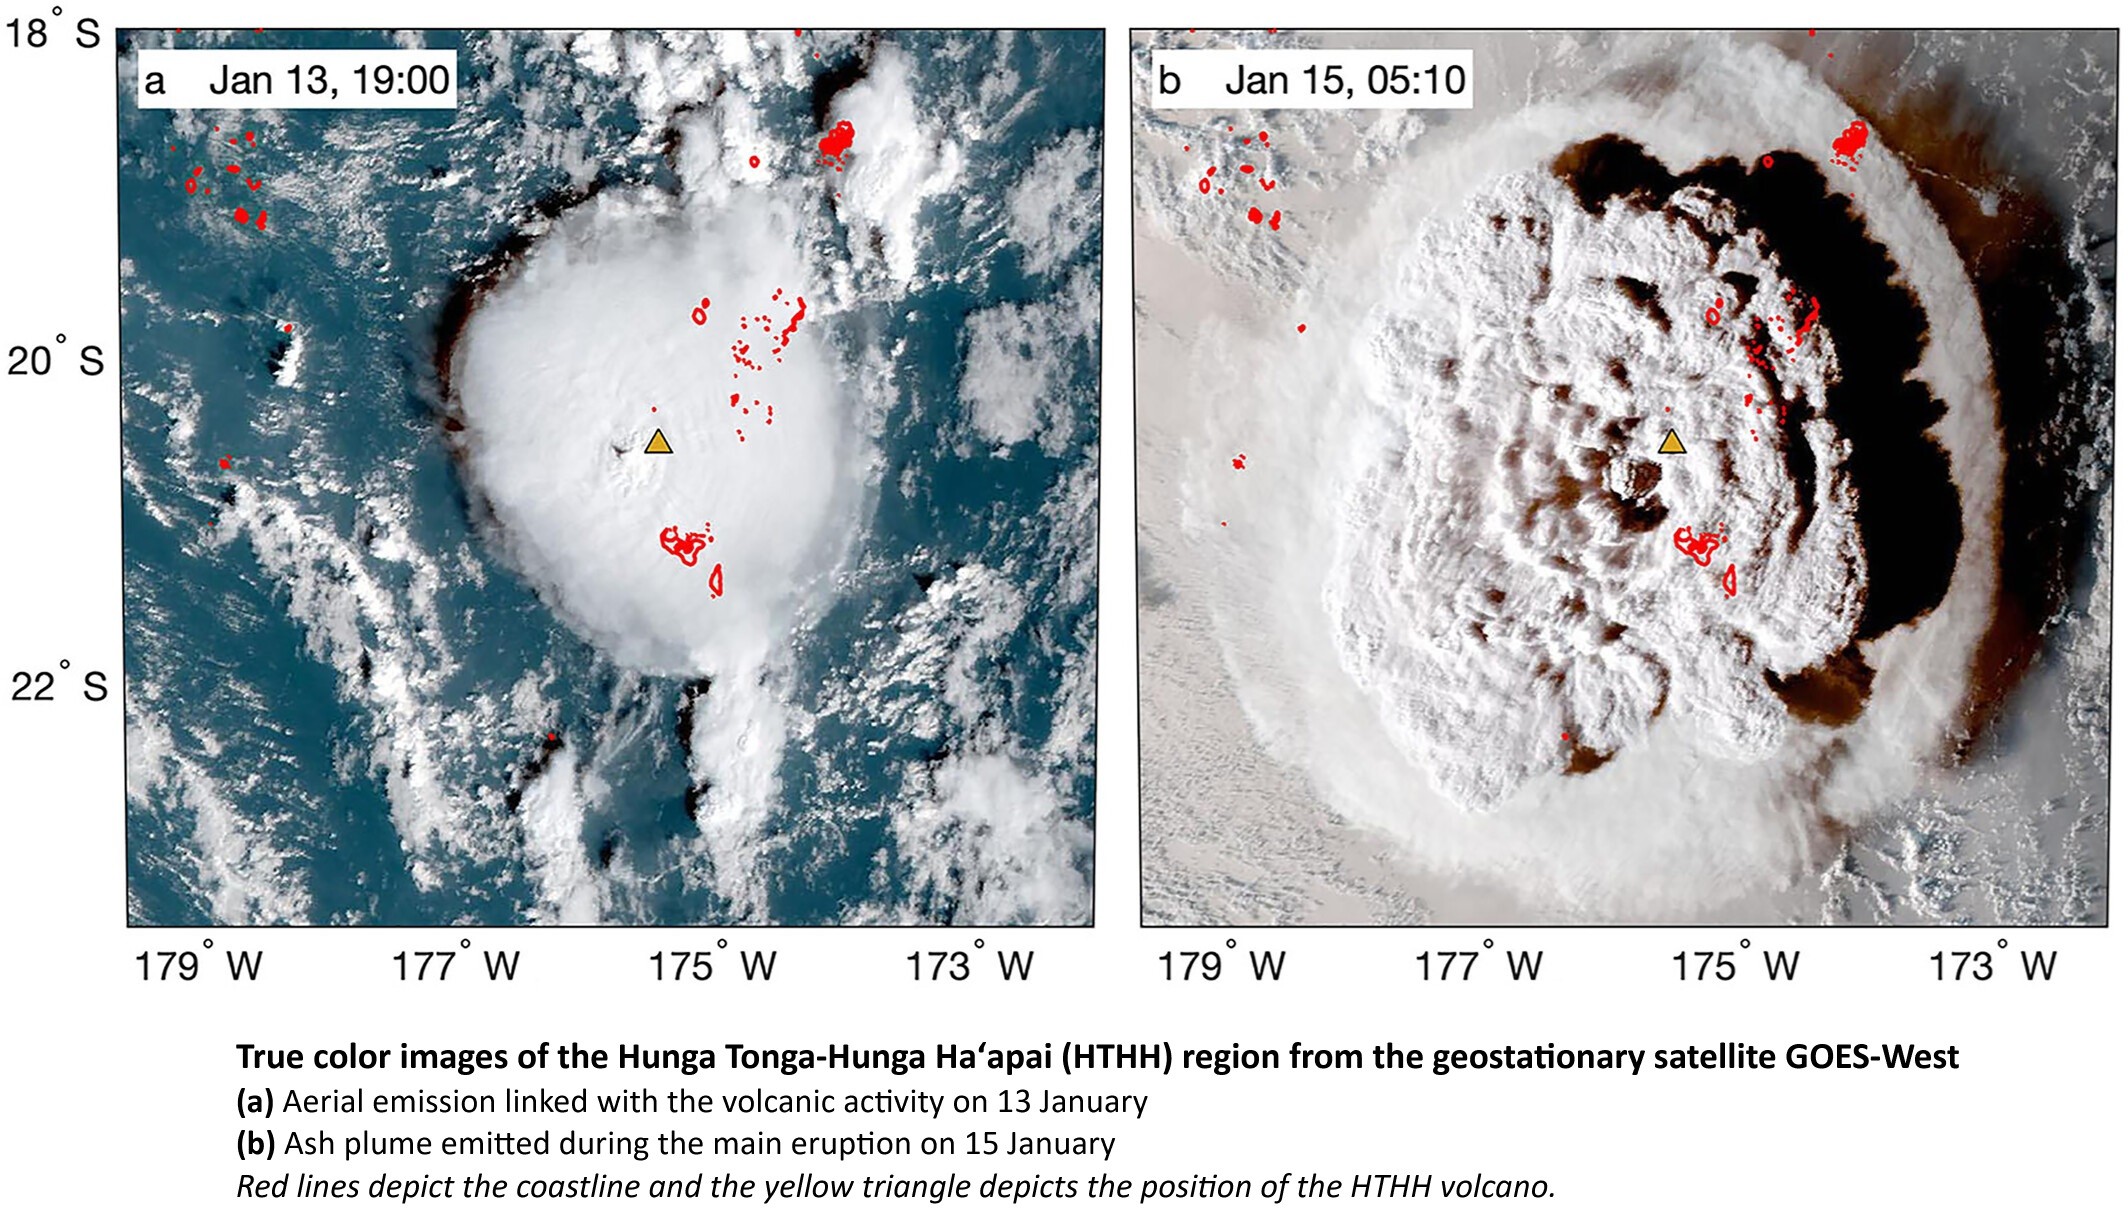
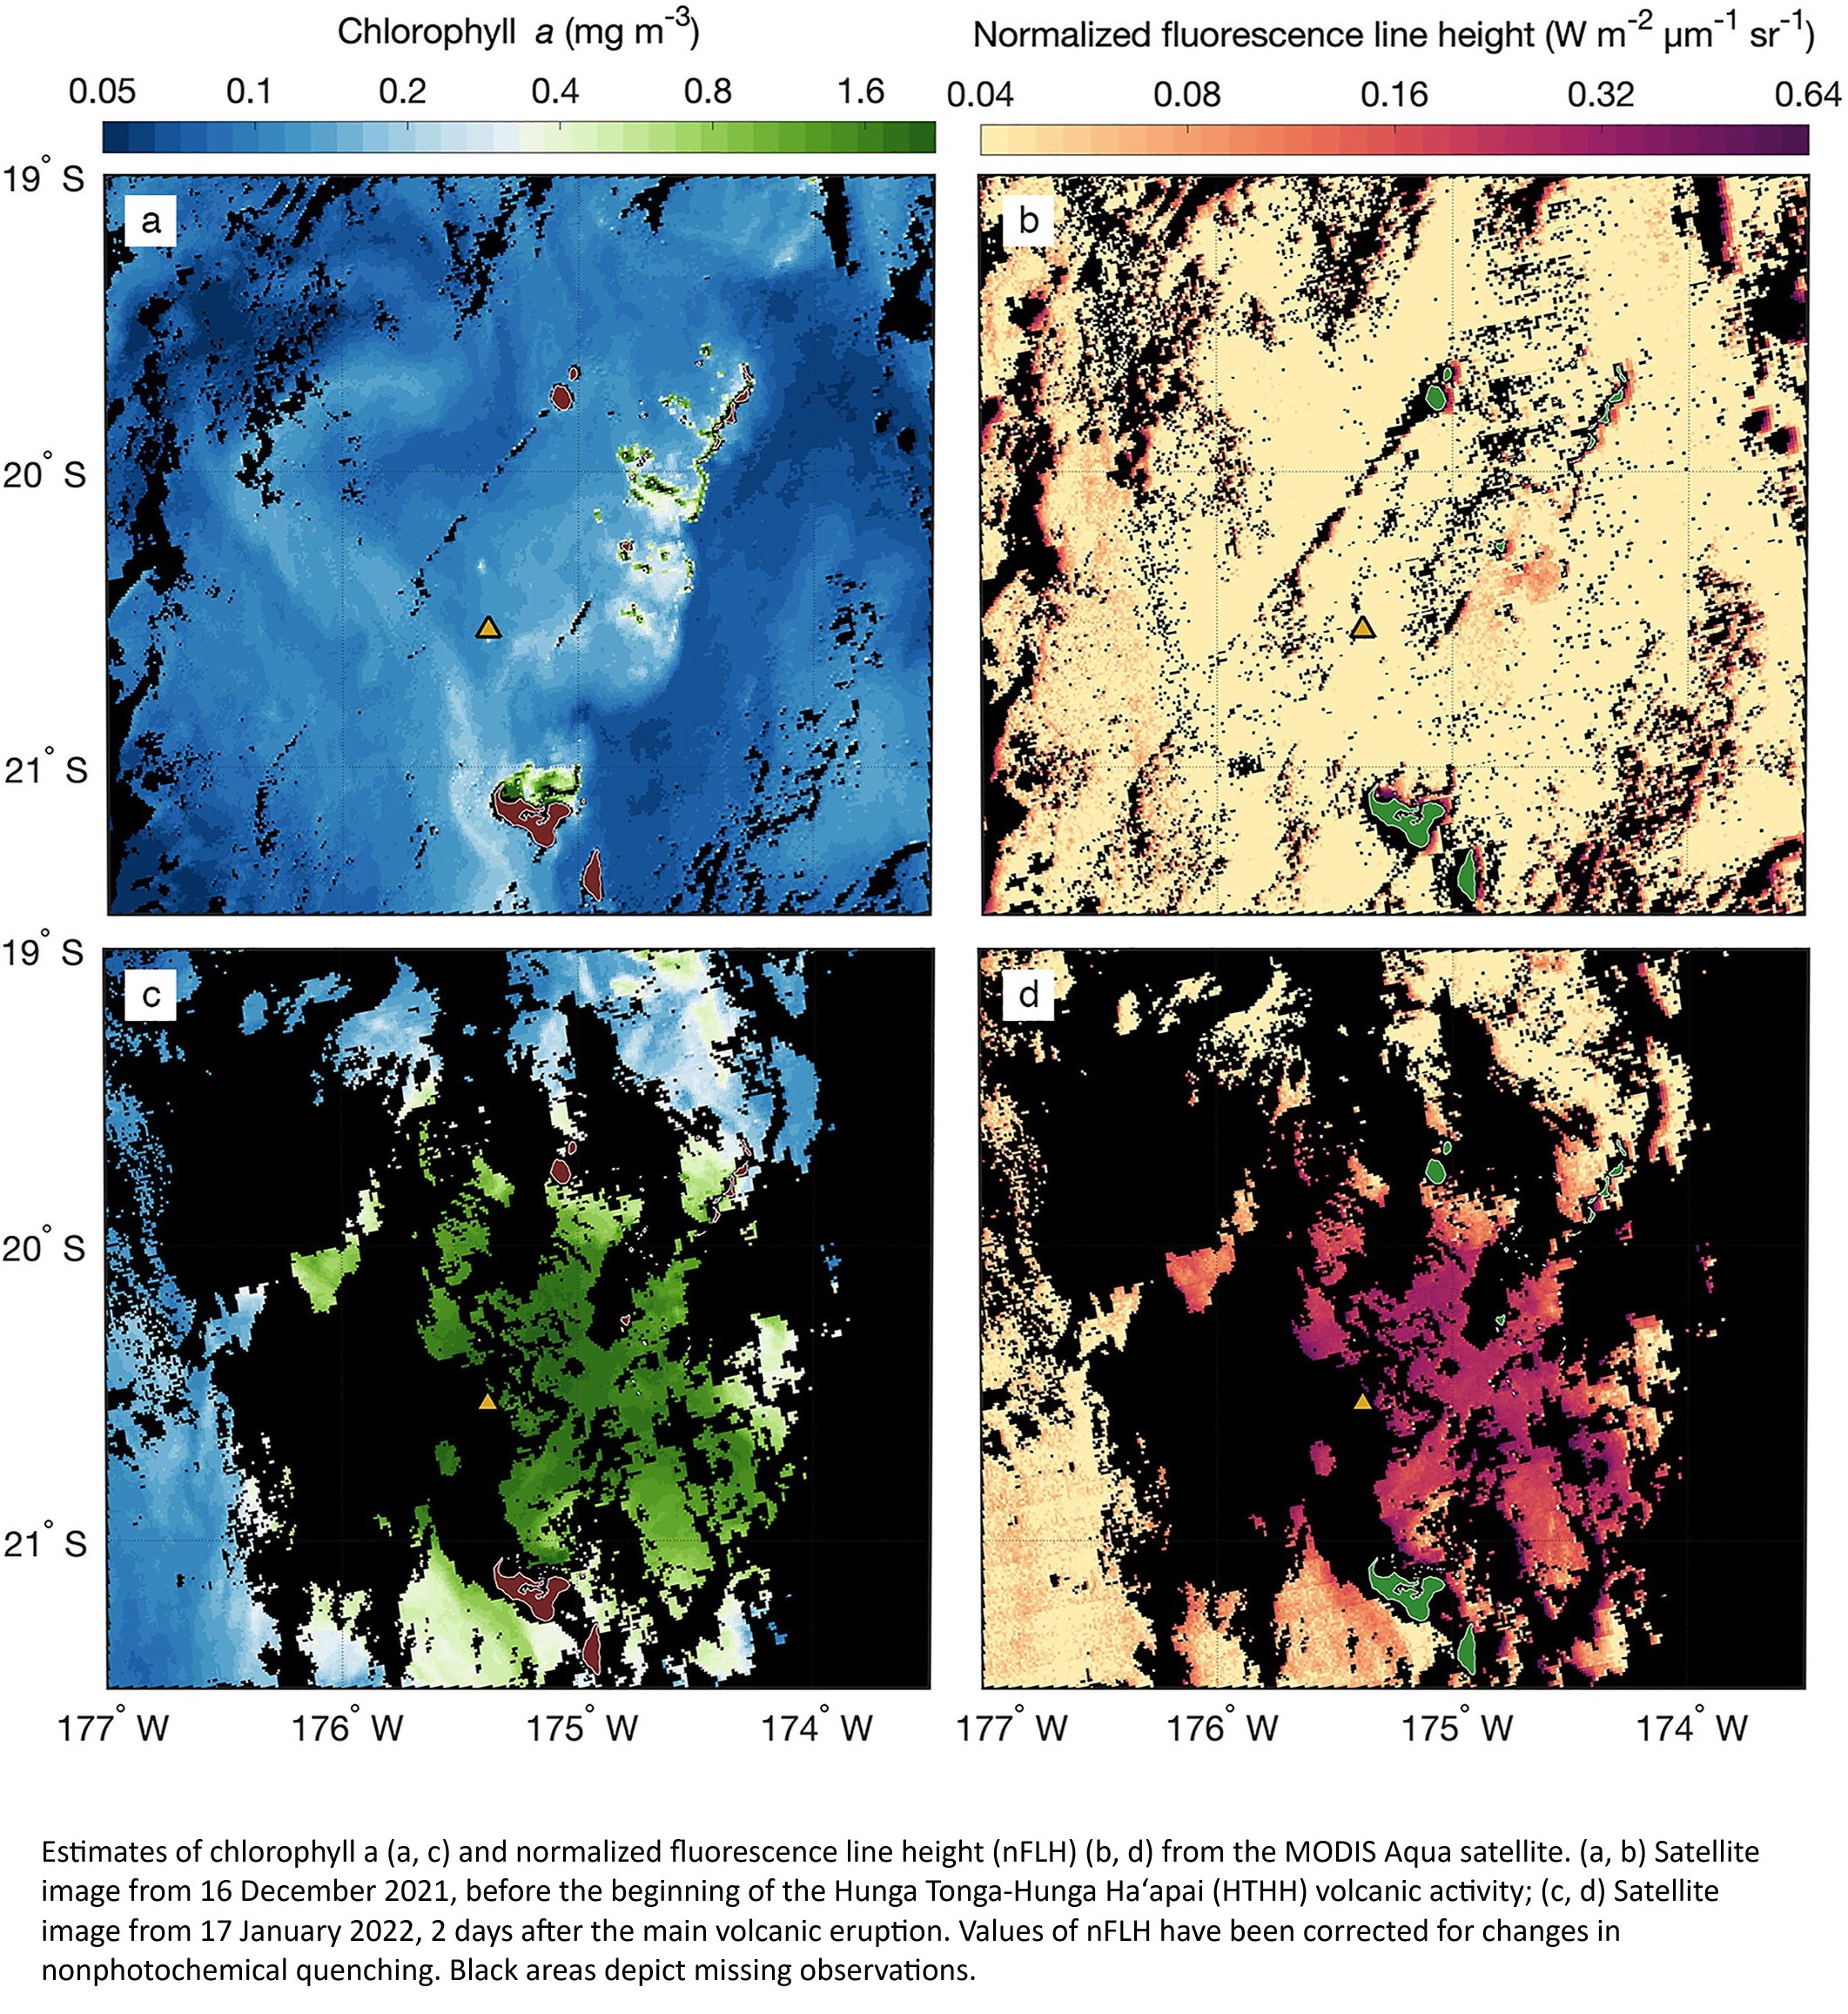
Esp. in light of the sad fact that the #volcano database lists the start date of the eruptions, not the date of an eventual explosion. Eg, HungaTonga in the database has a start date in December 2021 but the VEI-5 explosion occurred mid January 2022. volcano.si.edu/search_eruption Who knows when the explosions in 2015 actually occurred. (Sad!)

Browsing the longer periods of strong growth rates and looking at number of eruptions and VEI4-6 explosions, I see a pattern emerge: immediately after many eruptions or strong explosions, growth rate of SST in the North Atlantic, Center and East longitudes, is negative for a while. But approximately 12 to 18 months after the major volcanic activity, growth rate jumps up and stays high for a few months.

1995 was preceded by 2 VEI-5 explosions in 1991, #Pinatubo in June and another 2 months later. Or let's say what the database really states: 2 volcanos started erupting in April and August 1991 and eventually exploded in a VEI-5. When the explosions occurred I can only tell for Pinatubo: in June. The August eruption might have exploded in 1993 for all we know.
Anyway, so there also was a volcanic match for the strong 1995-1996 growth rate period. Tho, it was very long ago. But that was due to so much SO2 in the system that it cooled the planet for 2 years. And only in 1995, the heating resumed with force, strengthened by an El Nino.

So yeah. As far as I am concerned, the mystery of the gobsmacking bananas 2023 > in the North #Atlantic < is solved. The SO2 reduction from #shipping by the "voluntary regulation" from #IMO is not THE culprit, or the major shipping routes in my rectangle would have behaved differently 2022 - 2023 than other "normal freak occurrences".
I'd have to analyse North Pacific the same way to increase my certainty. But I'm just a layperson, no scientific stringency required. I'll leave it to others. or do it some other #FridaysForFuture day if I feel like it.

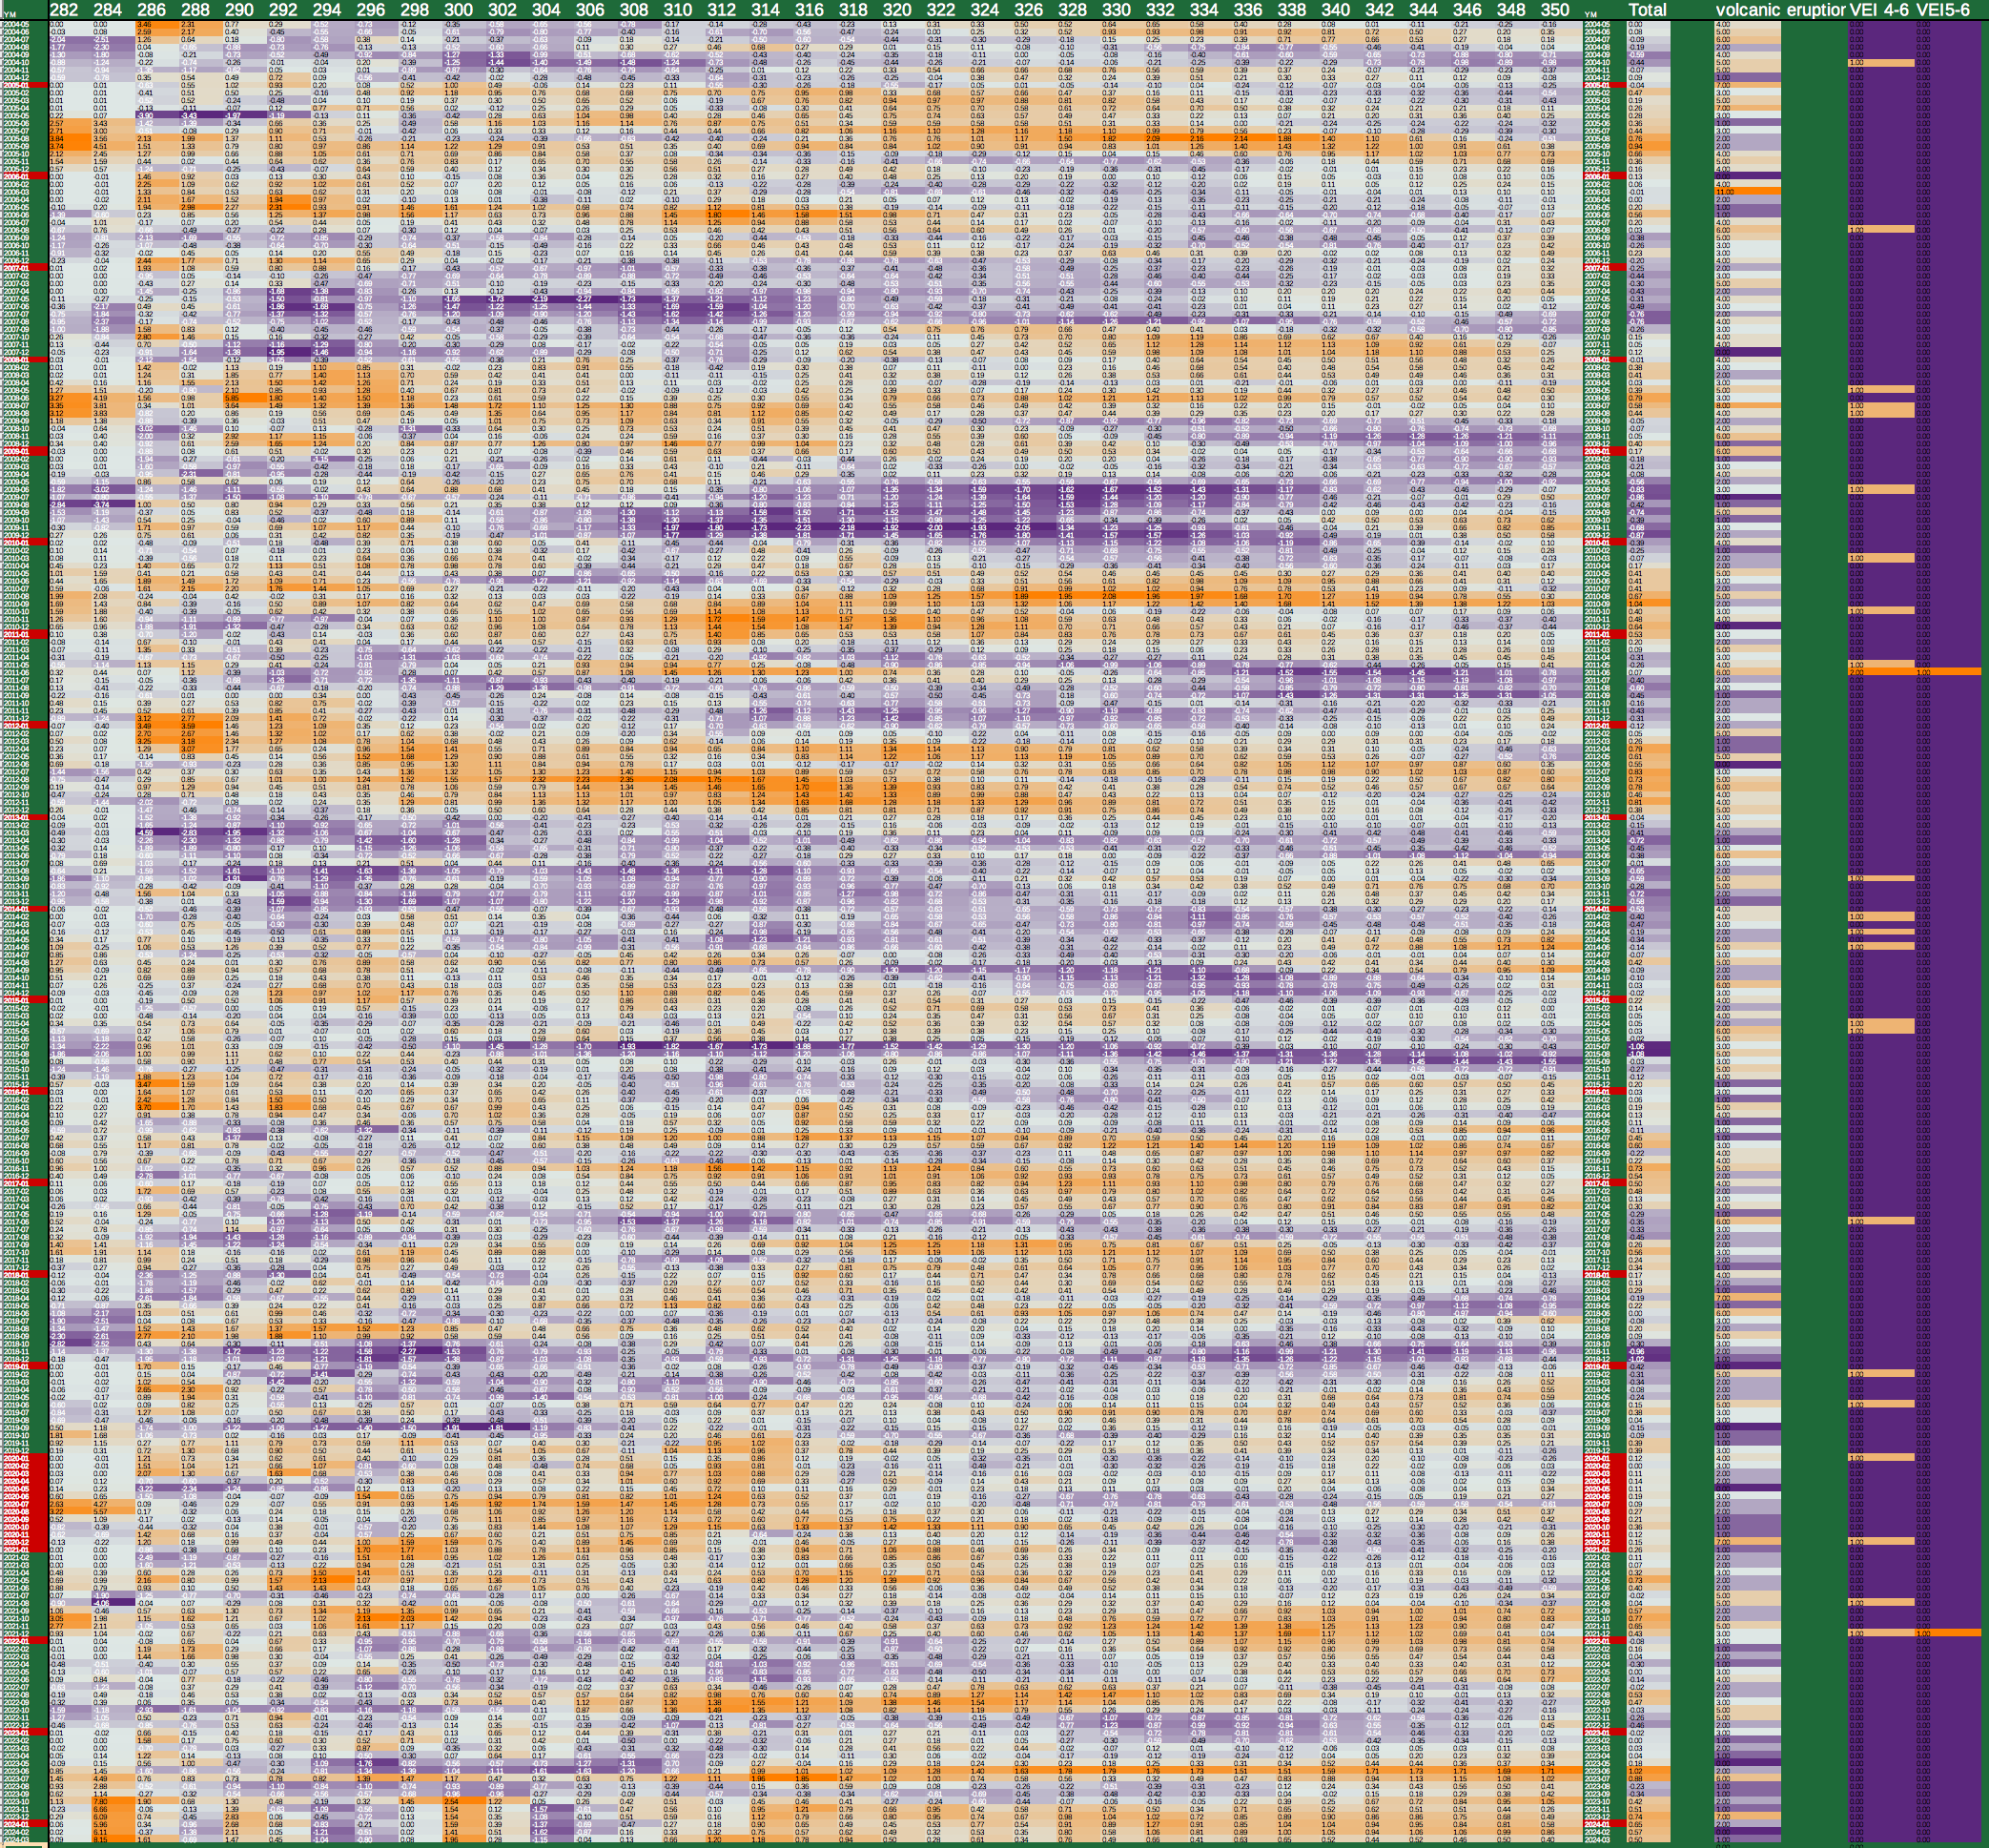
Attached are screenshots of the chronological time series from April 1986 to March 2006 and from April 2004 to 2024-March like described in the previous toot. Now with three new columns: "volcanic eruptions", "VEI4-6" and "VEI5-6".

1986-April to 2006-March2004-05 to 2024-03
HistoPol (#HP) 🏴 🇺🇸 🏴HistoPol
2024-04-10

@MichaelEMann @guardian

(3/3)

hits

...plausible causes of the anomaly – the effect, reductions in cooling sulphur dioxide particles due to controls, fallout from the January 2022 -Hunga Ha’apai volcanic eruption in , and the ramping up of solar activity in the run-up to a predicted solar maximum..."

//

@dderigo
Thank you for posting excerpts from Gavin Schmidt's article.

Isn't it a bit incoherent tho that he a) states that the weirdness set in several months before El Nino raised his head, and then b) expresses the hope that the weirdness might end with El Nino's end?

Also, I have a logic problem with Hunga-Tonga's alleged small global impact from stratospheric water vapour, and another problem regarding the voluntary SO2 reduction by the shipping industry. The latter is supposed to have come into "voluntary force" in 2020. Why would it have taken 24 months to have SUCH a sudden and noticeable effect on SST?
Hunga-Tonga's allegedly neglect-able, tiny impact on global weather is also odd. That water vapour is said to change wind strength in 300hPa (preprint Jucker et al 2023). Change in wind strength over flat ocean areas..., and with far-reaching effects. That East-Antarctic heatwave and atmospheric river in March 2022 for example originated in tropical storm activity (new paper from this year, forgot by whom) – activity which I say, maybe got triggered by #Hungatonga 's H2O injection. Greenland also had a heatwave at the very same time. Teleconnection?
The water vapour hadn't even reached either latitudes yet at that time. But the freshwater amount from both melt events is still in the system and doing its thing.
Ah well.
I don't like how that eruption is seen as neglect-able by minds which look at global averages and seem to have no feeling how seemingly regional changes echo through the whole system.

Client Info

Server: https://mastodon.social
Version: 2025.04
Repository: https://github.com/cyevgeniy/lmst