
Photo has no secrets that #Sentinel2 cannot reveal.
#sentinel2

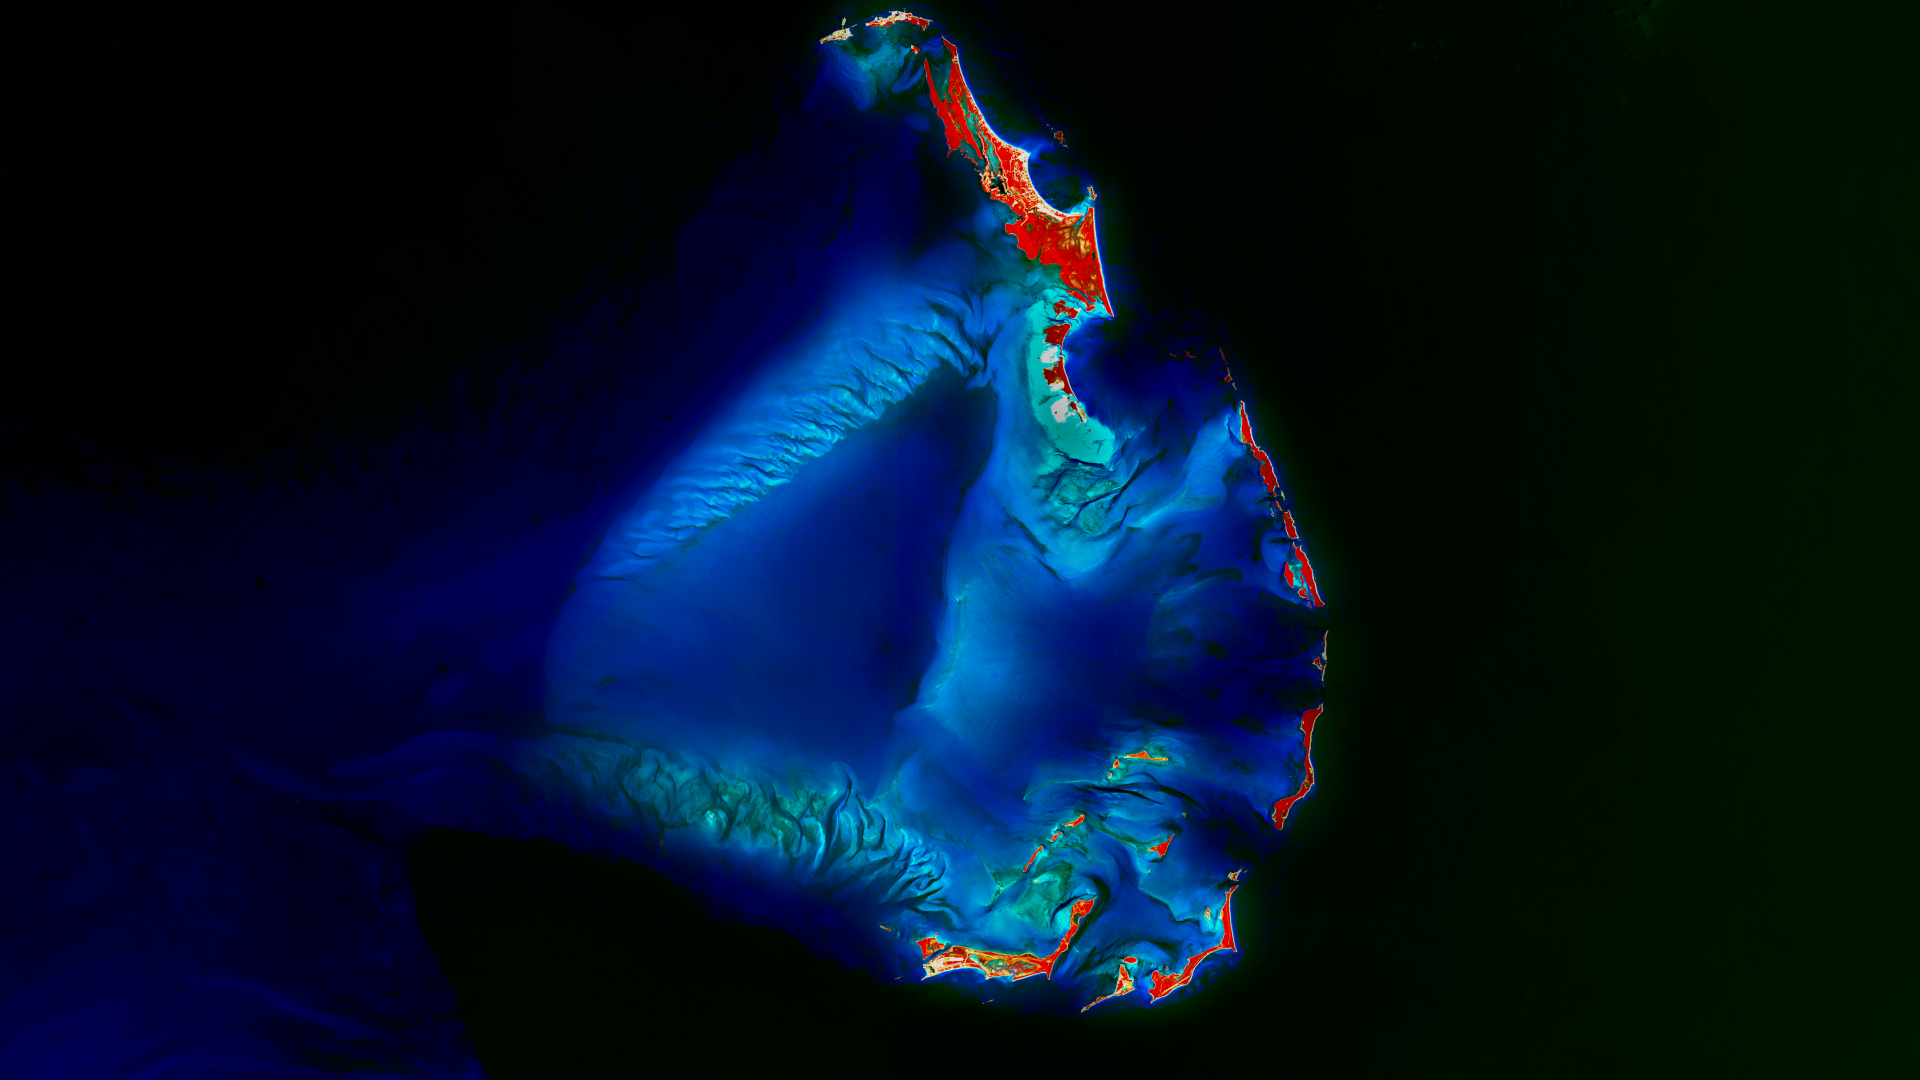
December’s Satellite Image of the Month features a stunning view of the Berry Islands (Bahamas). Learn more: https://www.mundialis.de/en/satellite-image-of-the-month-december-berry-islands-bahamas/
#OSGeo #OpenData #Sentinel2

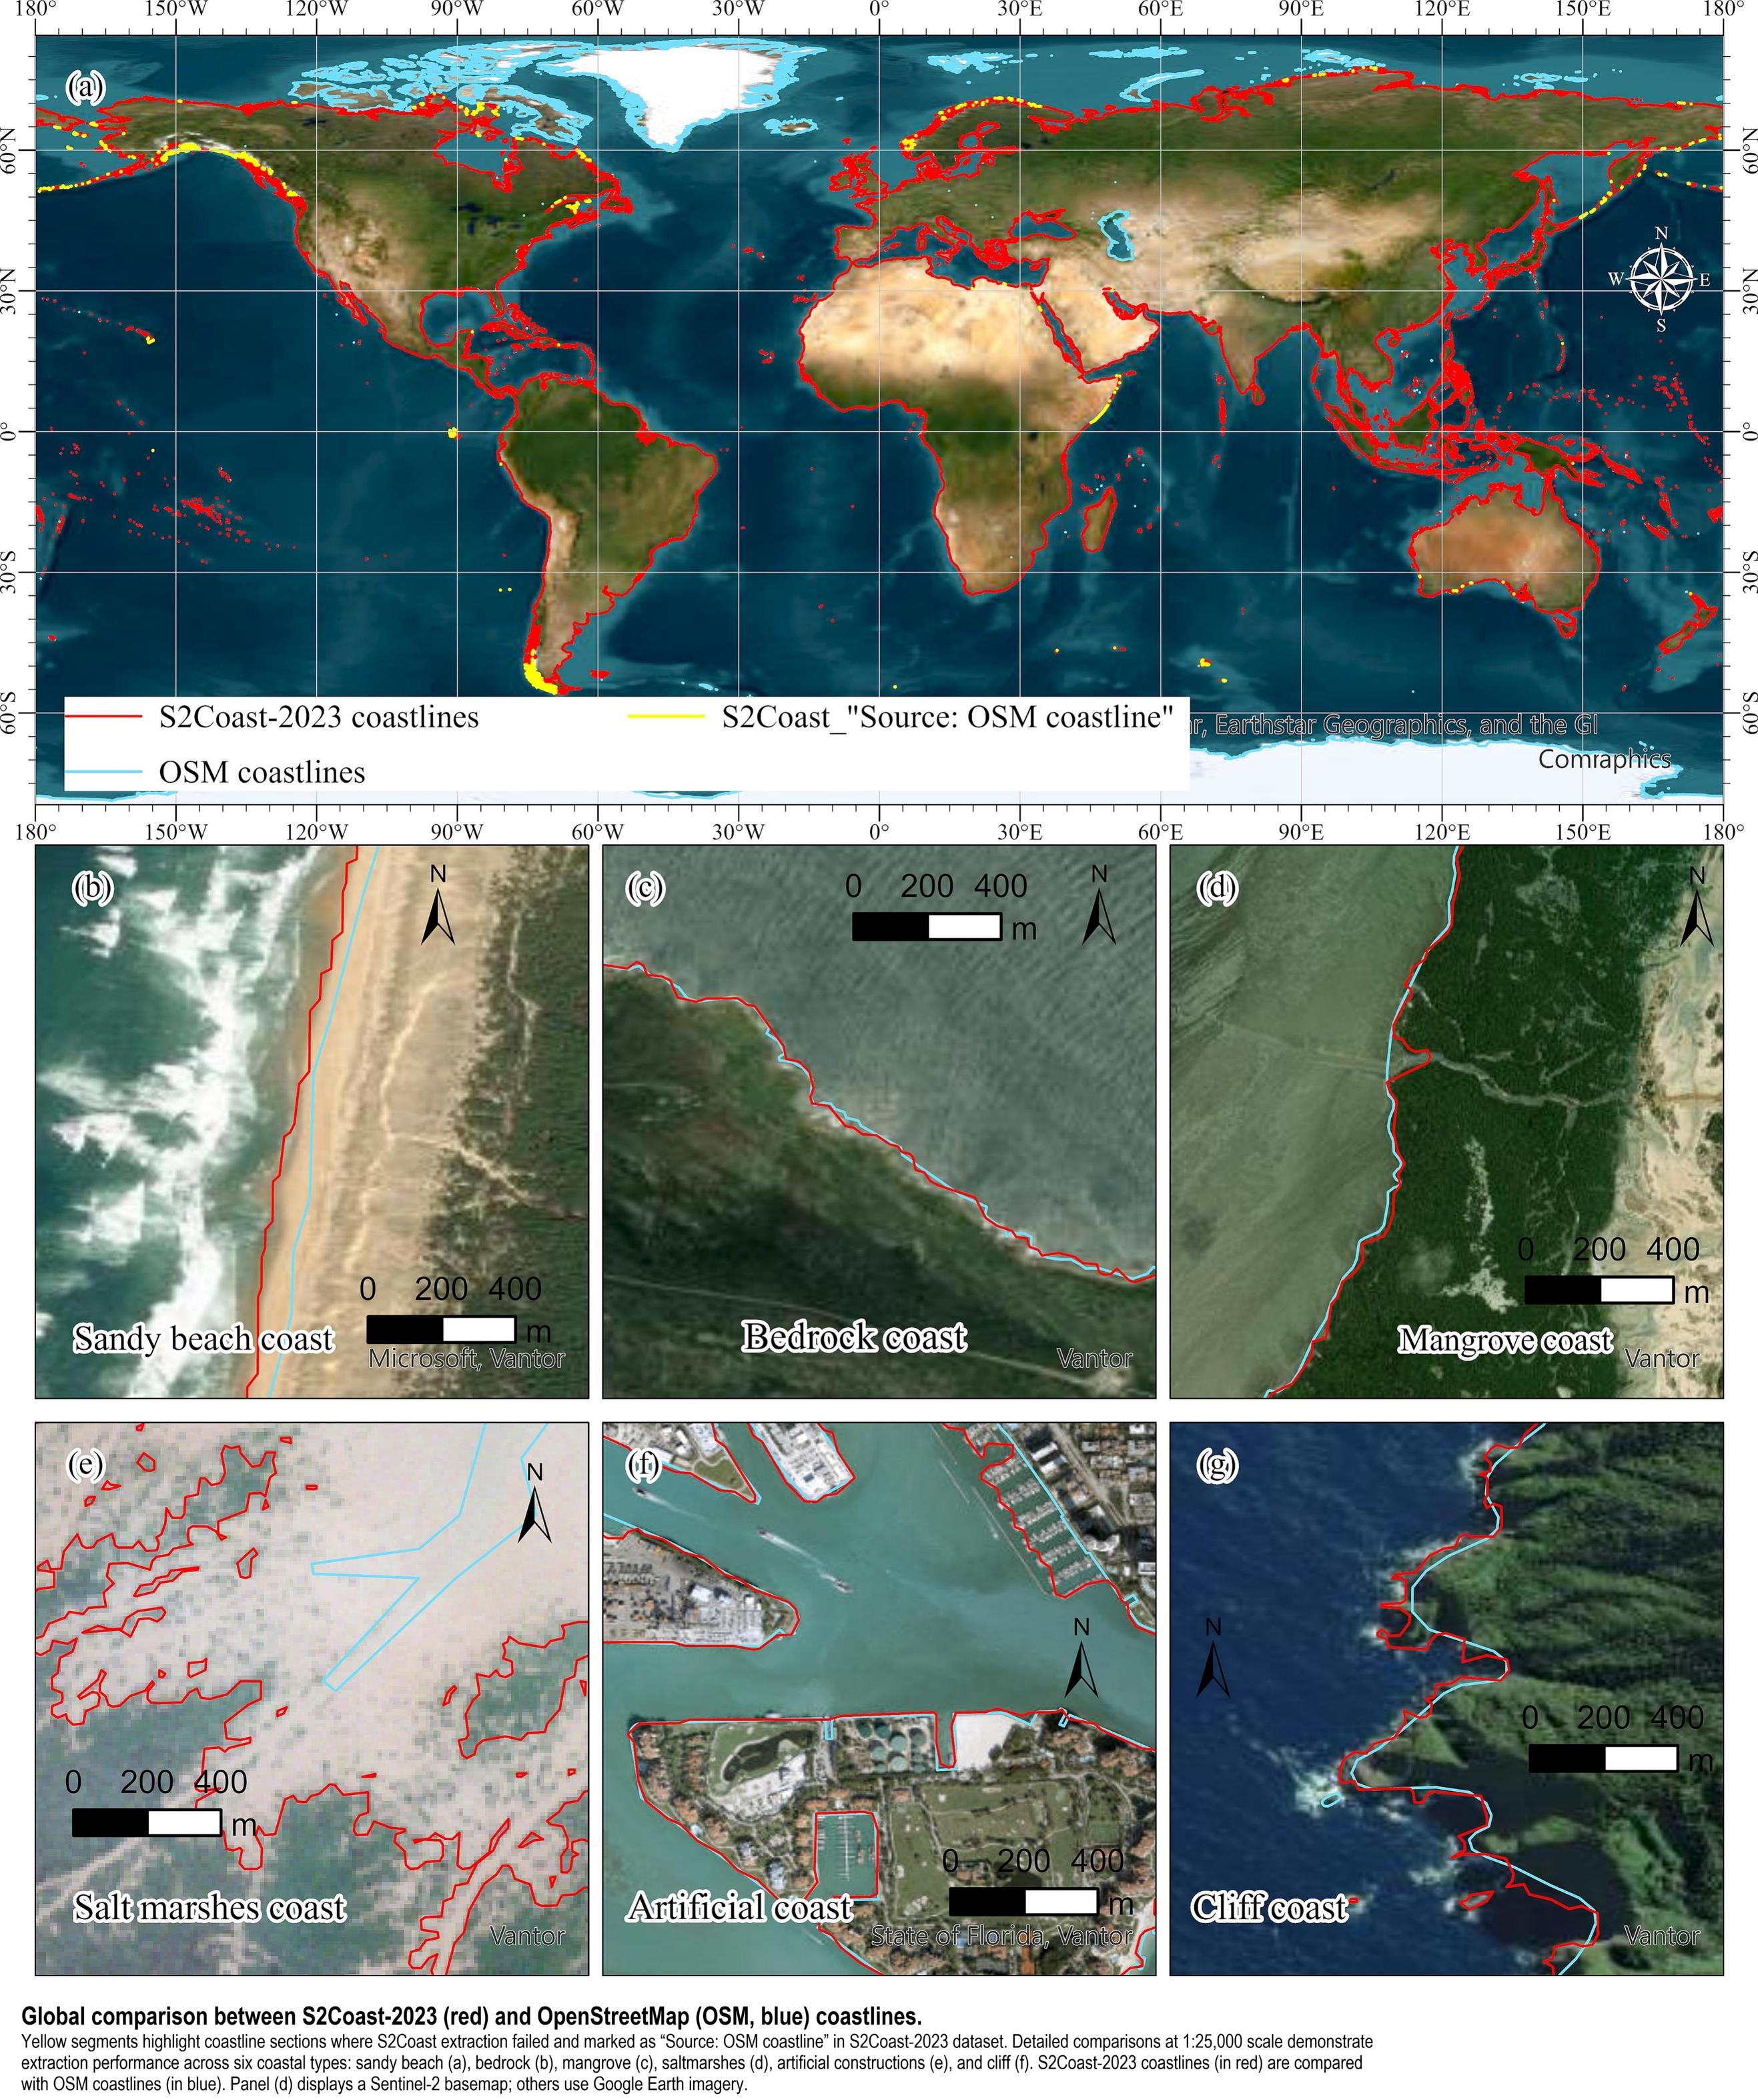
S2Coast-2023 - The First Global 10-Meter Resolution #Coastline Dataset Derived From Enhanced #Sentinel2 Composite #Imagery Using #GoogleEarthEngine
--
https://doi.org/10.1016/j.rse.2025.115186 <-- shared paper
--
https://zenodo.org/records/17092775 <-- shared data
--
“HIGHLIGHTS:
• Developed a GEE-based global coastline detection framework (S2Coast).
• HWLSentinel-2 serves as a unified and stable indicator for global coastline detection.
• The S2Coast-2023 coastline dataset is generated from annual Sentinel-2 imagery.
• Pixel-level accuracy compared with VHR-based OpenStreetMap coastlines..."
#GIS #spatial #mapping #RemoteSensing #CoastalResearch #ClimateChange #EarthObservation #Globalcoastlinemapping #Senitinel #googleearthengine #GEE #Compositing #coast #globe #global #model #modeling #detection #marine #terrestrial #ecosystems #knowledgebased #framework #spatialanalysis #spatiotemporal #QAQC


Nighttime lights from #Sentinel2

Sentinel 2 will be taking nighttime acquisitions TONIGHT, and the level 1B data will be available for TWO WEEKS ONLY following the acquisition: https://sentinels.copernicus.eu/web/sentinel/-/sentinel-2-nighttime-imaging-campaign
#RemoteSensing #NighttimeLights #NightLight #LightPollution #Sentinel2


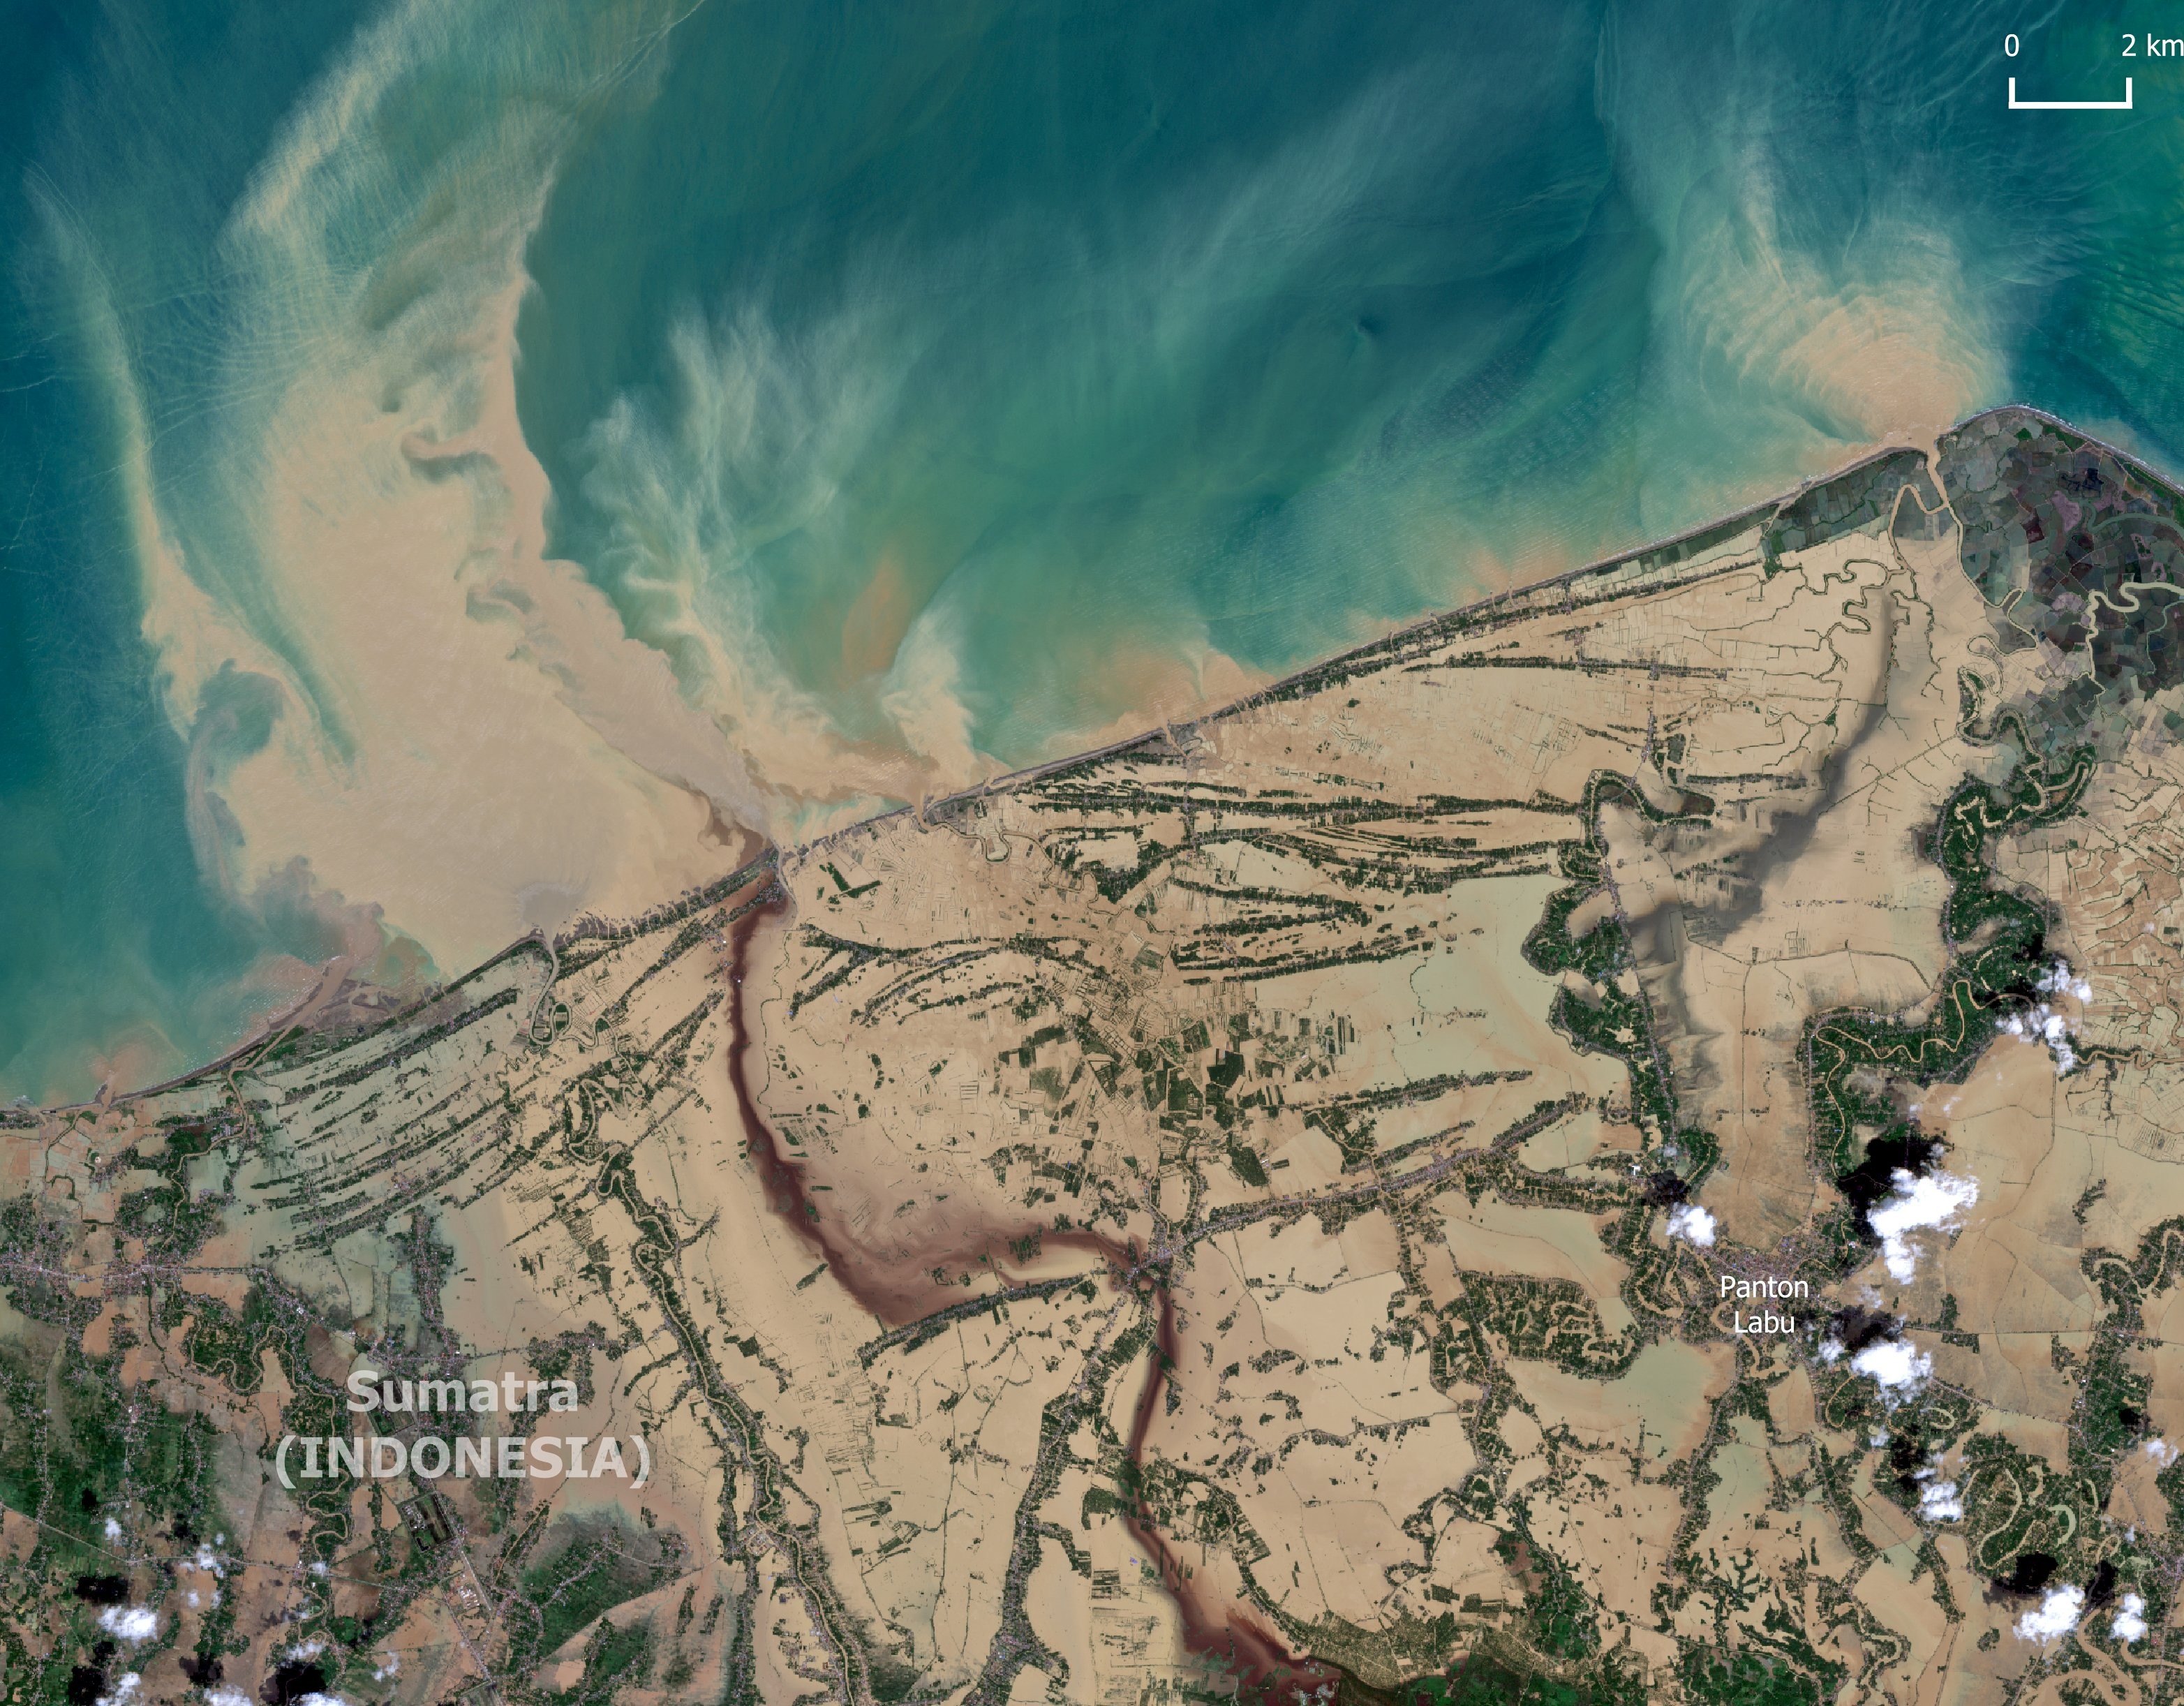
🌀 Le cyclone #Senyar est une tempête cyclonique meurtrière rare formée fin novembre dans le détroit de Malacca (2e cyclone tropical dans cette zone depuis 2001).
📷 Au Nord de l'Indonésie, des inondations dévastatrices couvrant 500 km² par #Sentinel2 le 29/11. Via @or_bit_eye

#GreennessOfCalgary
I’ve almost finished it!
I’ve uploaded all eight parts of “The Greenness of Calgary: A Community-Level Atlas (2025). Contrast Color Edition” to #Gumroad
Each part is a separate PDF using the “classic” high-contrast NDVI palette, optimized for visual interpretation of vegetation patterns. (The soft green palette will come later.)
I’ve created a dedicated landing page with descriptions of all releases and download links.
📎 Landing page is here: https://datastory.gumroad.com/l/qemrgul
💲 The materials are available under a “pay what you want” model — free or with optional support.
This is my first attempt at publishing geospatial analytical materials in this format. I apologise for some template-like descriptions. I hope this atlas series will be useful for researchers, enthusiasts, and anyone interested in Calgary’s urban ecology.
#Calgary #YYC #UrbanEcology #NDVI #RemoteSensing #GIS #OpenData #Geospatial #DataVisualization #Cartography #QGIS #FOSS #Canada #Alberta #RStats #Sentinel2
I like to verify my remote-sensing results directly in the field. Besides basic self-validation, field walks often generate new ideas and hypotheses.
For mobile field GIS, I use QField, loading both final map layers and custom templates for data collection.
Here’s an example from Nose Hill Park, where I checked several locations that showed a consistent NDVI increase in 2025 compared to 2024.
Field observations help confirm whether the spectral trends match real vegetation changes on the ground.
#RemoteSensing #EarthObservation #GIS #QGIS #QField #NDVI #VegetationMonitoring #Sentinel2 #FieldWork #GeoSpatial #OpenData #GeoDataScience #UrbanEcology #Calgary #NoseHillPark #Alberta #Canada #Copernicus #CopernicusSentinel #GreennessOfCalgary


Nose Hill Park, Calgary
Median composite of Sentinel-2 imagery (mid-May to mid-September 2025).
Band combination: 12-8-3, emphasizing substrate contrasts, vegetation structure, and moisture patterns.
#RemoteSensing #EarthObservation #Sentinel2 #OpenData #GIS #QGIS #GeoDataArt #GeoSpectralArt #Calgary #Alberta #UrbanEcology #GeospatialAnalysis #Canada #GreennessOfCalgary #Copernicus #CopernicusSentinel #NoseHillPark


Autumnal colours across Honshu Island, Japan.
#EU #Copernicus #Sentinel2 #Japan
https://www.copernicus.eu/en/media/image-day-gallery/autumn-colours-across-honshu-island-japan
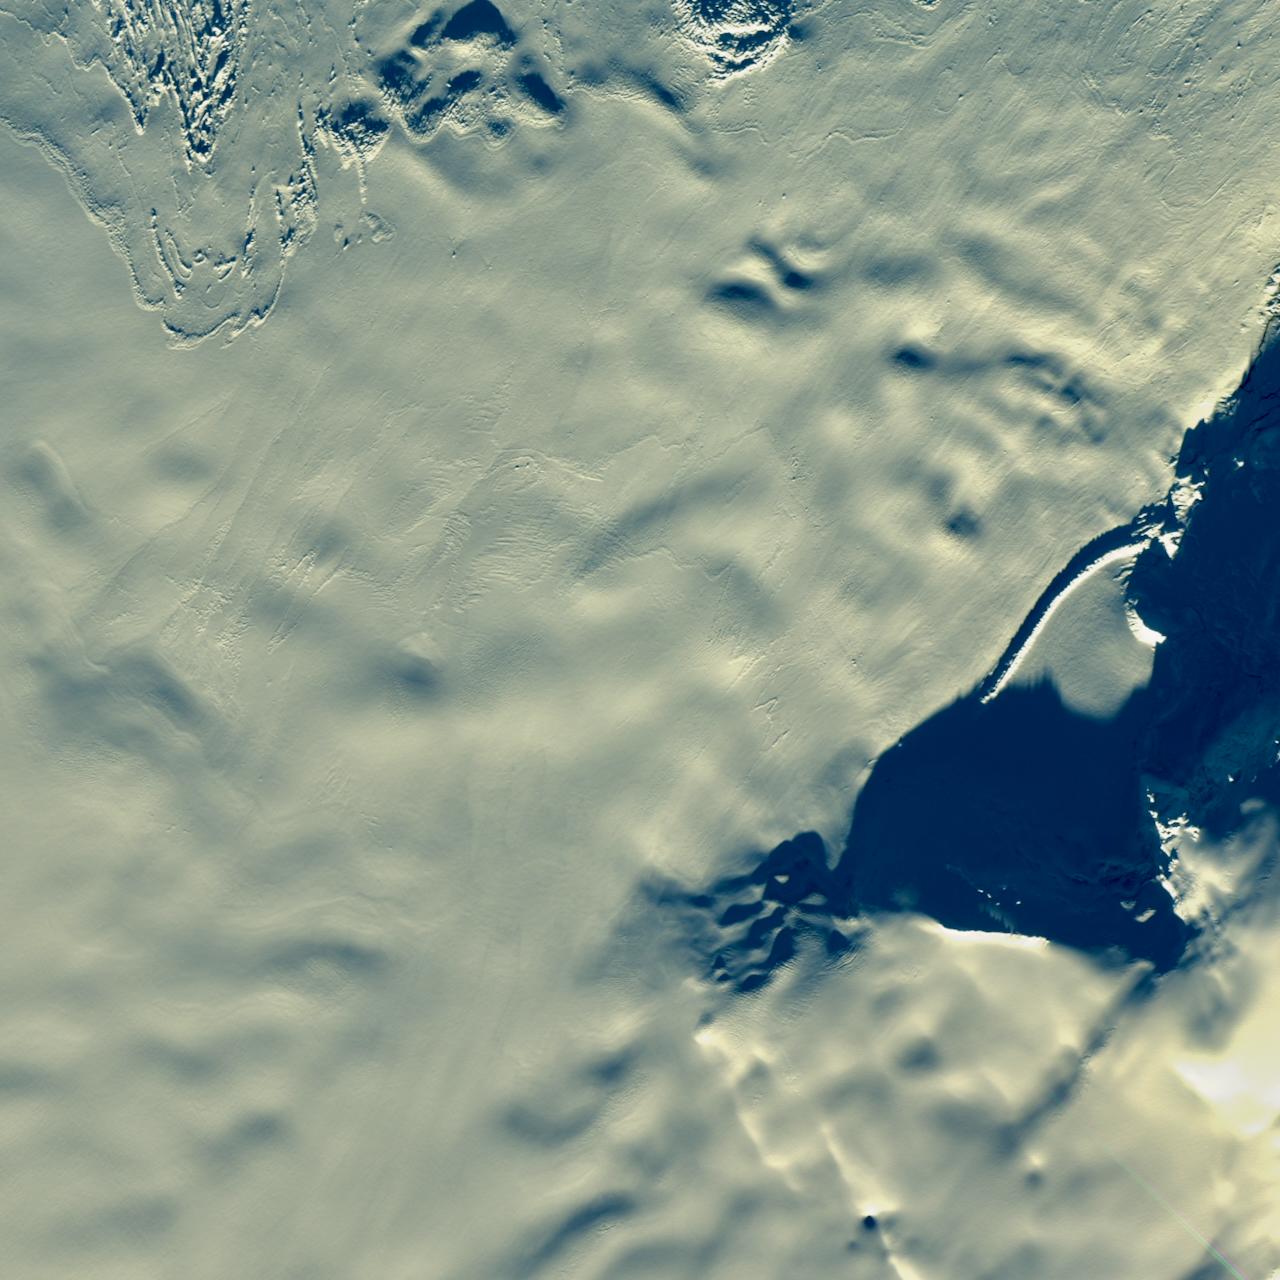
Eastern Greenland at the start of winter.
https://www.copernicus.eu/en/media/image-day-gallery/eastern-greenland-start-winter
Result of a Principal Component Analysis (PCA) created from combined median composites of Sentinel-1 and Sentinel-2 imagery — somewhere in the Sudanese desert.
This PCA composite brings out contrasts between lithologies, structural domains, drainage patterns, and surface materials, highlighting features that are nearly invisible in standard RGB representations.
And yes — it also happens to look stunning.
#RemoteSensing #EarthObservation #Geology #PCA #Sentinel1 #Sentinel2 #SAR #Radar #OpenData #GIS #QGIS #Geomorphology #Geoscience #SAGAGIS #RStats #Desert #Lithology #GeoDataArt #GeoSpectralArt #Sudan #Copernicus #CopernicusSentinel


#30DayMapChallenge Day 20: Water
Arrieta. #Sopela. Learning #bathymetry. After calculating the #Stumpf ratio using #Sentinel2 images, we compared it with the bathymetry layers (1 & 5 m) available at #GeoEuskadi.
A lot to process, a lot more to learn
#rstats #RemoteSensing #GIS #EarthObservation

Result of a Principal Component Analysis (PCA) based on combined median composites of Sentinel-1 and Sentinel-2 satellite imagery — somewhere in the desert of Sudan.
The PCA highlights contrasts between different lithologies, structural domains, and surface materials, revealing subtle geological features that are hard to distinguish in standard RGB composites.
And yes — it also looks simply beautiful.
#RemoteSensing #EarthObservation #Geology #PCA #Sentinel1 #Sentinel2 #Radar #OpenData #GIS #QGIS #Geomorphology #Geoscience #SAR #SAGAGIS #RStats #Desert #Lithology #GeoDataArt #GeoSpectralArt

Comparison of the median-seasoned NDVI for central Calgary: 2024 vs 2025
Here is a side-by-side look at how the vegetation conditions in central Calgary changed between two years, using median-seasoned NDVI maps derived from Sentinel-2 imagery.
You can clearly see the interannual differences in greenness — especially in parks, riparian zones, and residential areas with large tree cover.
The spatial patterns remain stable, but 2025 shows noticeably higher NDVI in many neighbourhoods due to more favourable moisture conditions.
This is part of my ongoing project on analyzing the vegetation dynamics of Calgary communities: #GreennessOfCalgary
#RemoteSensing #EarthObservation #NDVI #Sentinel2 #Calgary #UrbanEcology #GIS #RStats #DataAnalysis #EnvironmentalMonitoring #Copernicus #Alberta #Canada #YYC #UrbanHealth #QGIS #FOSS

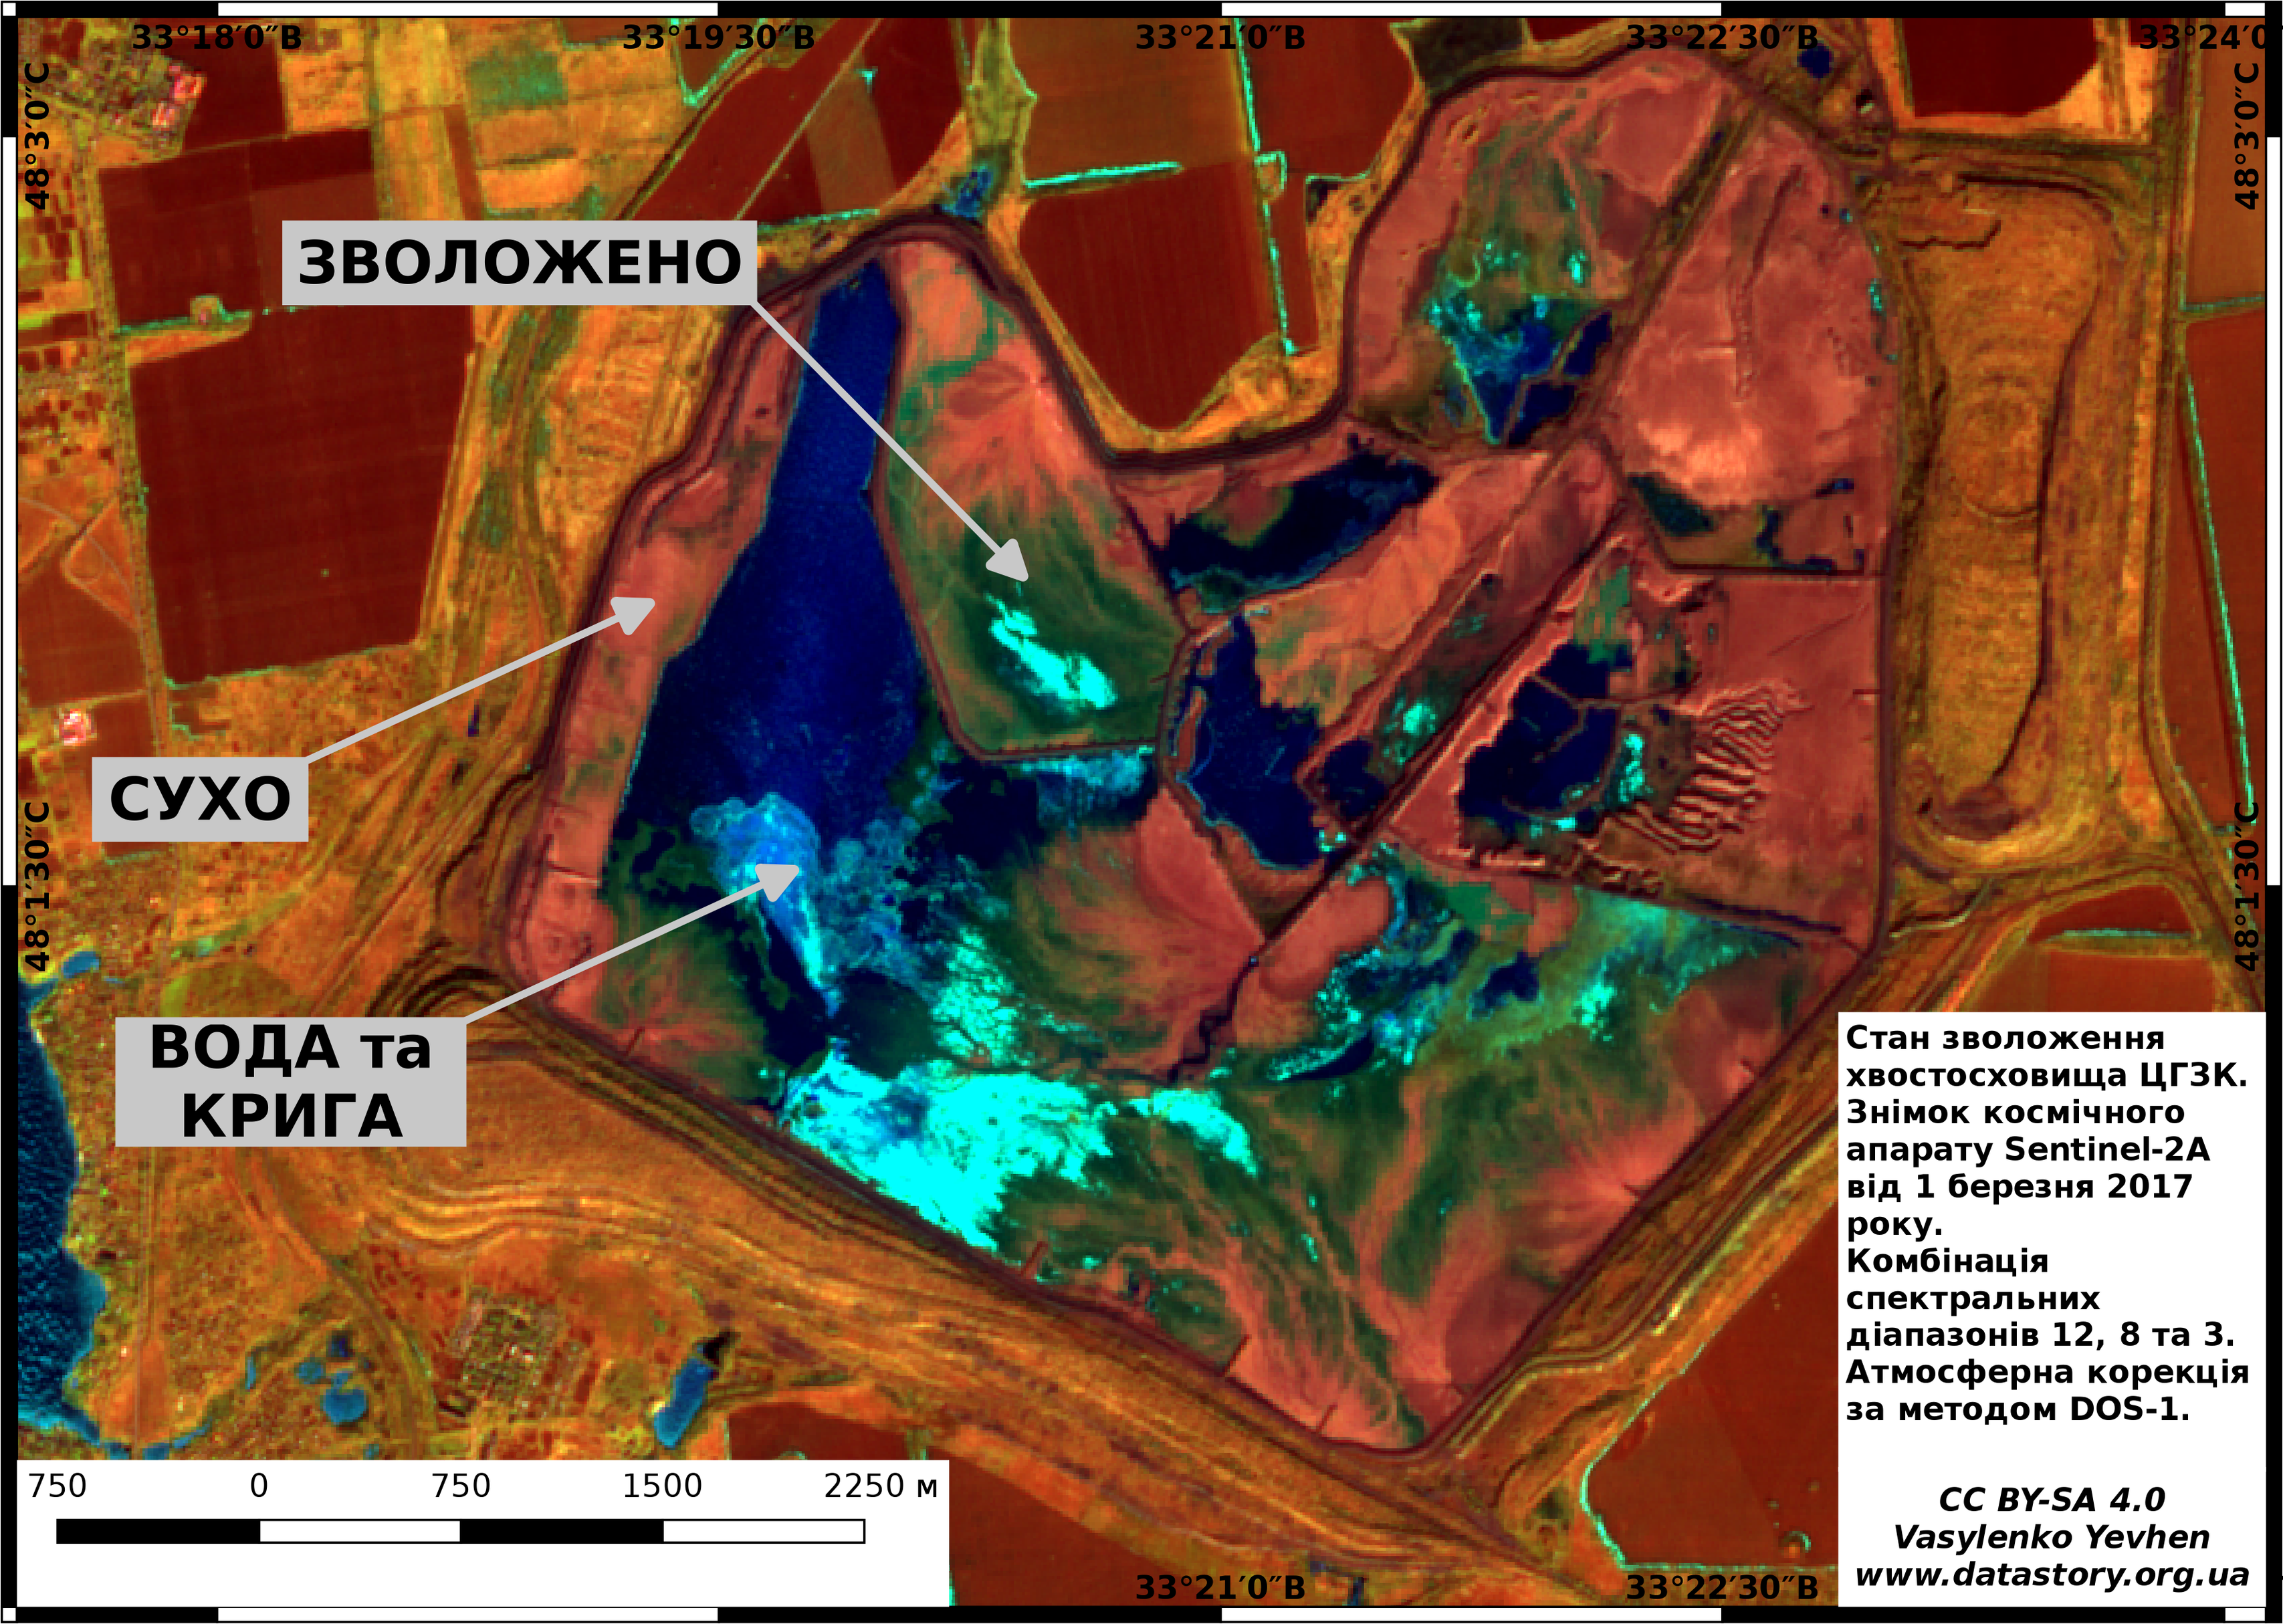
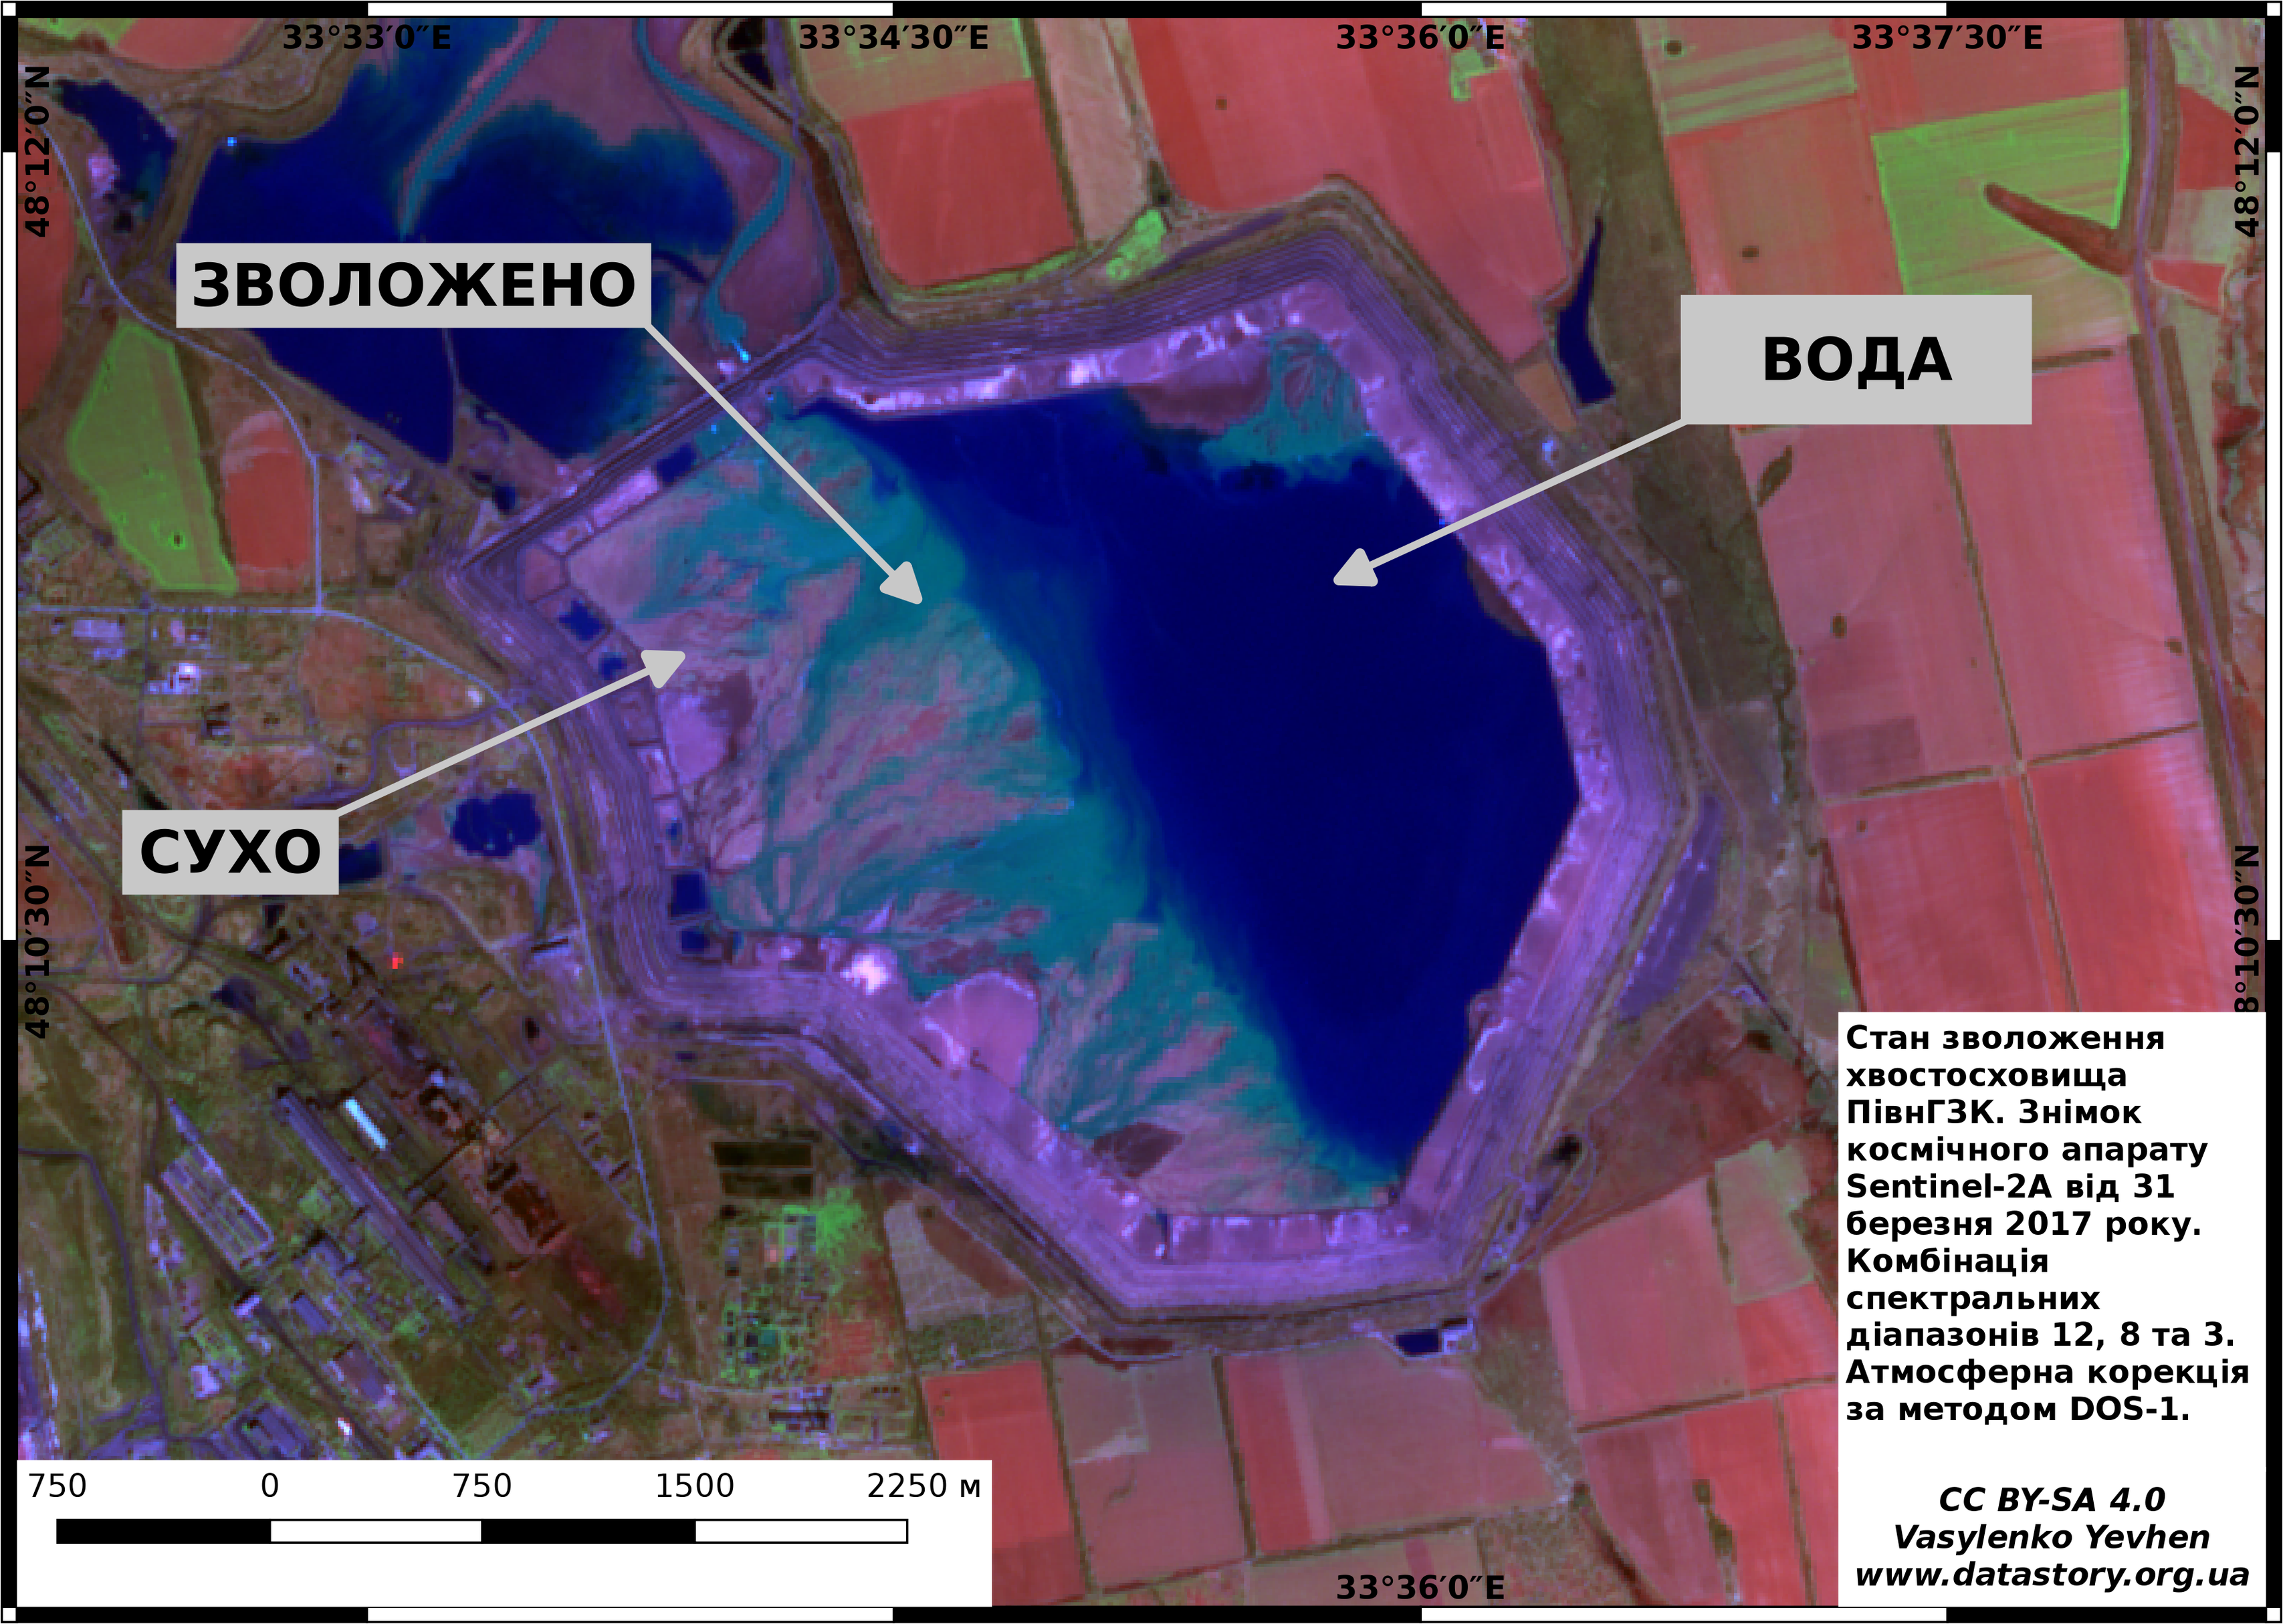
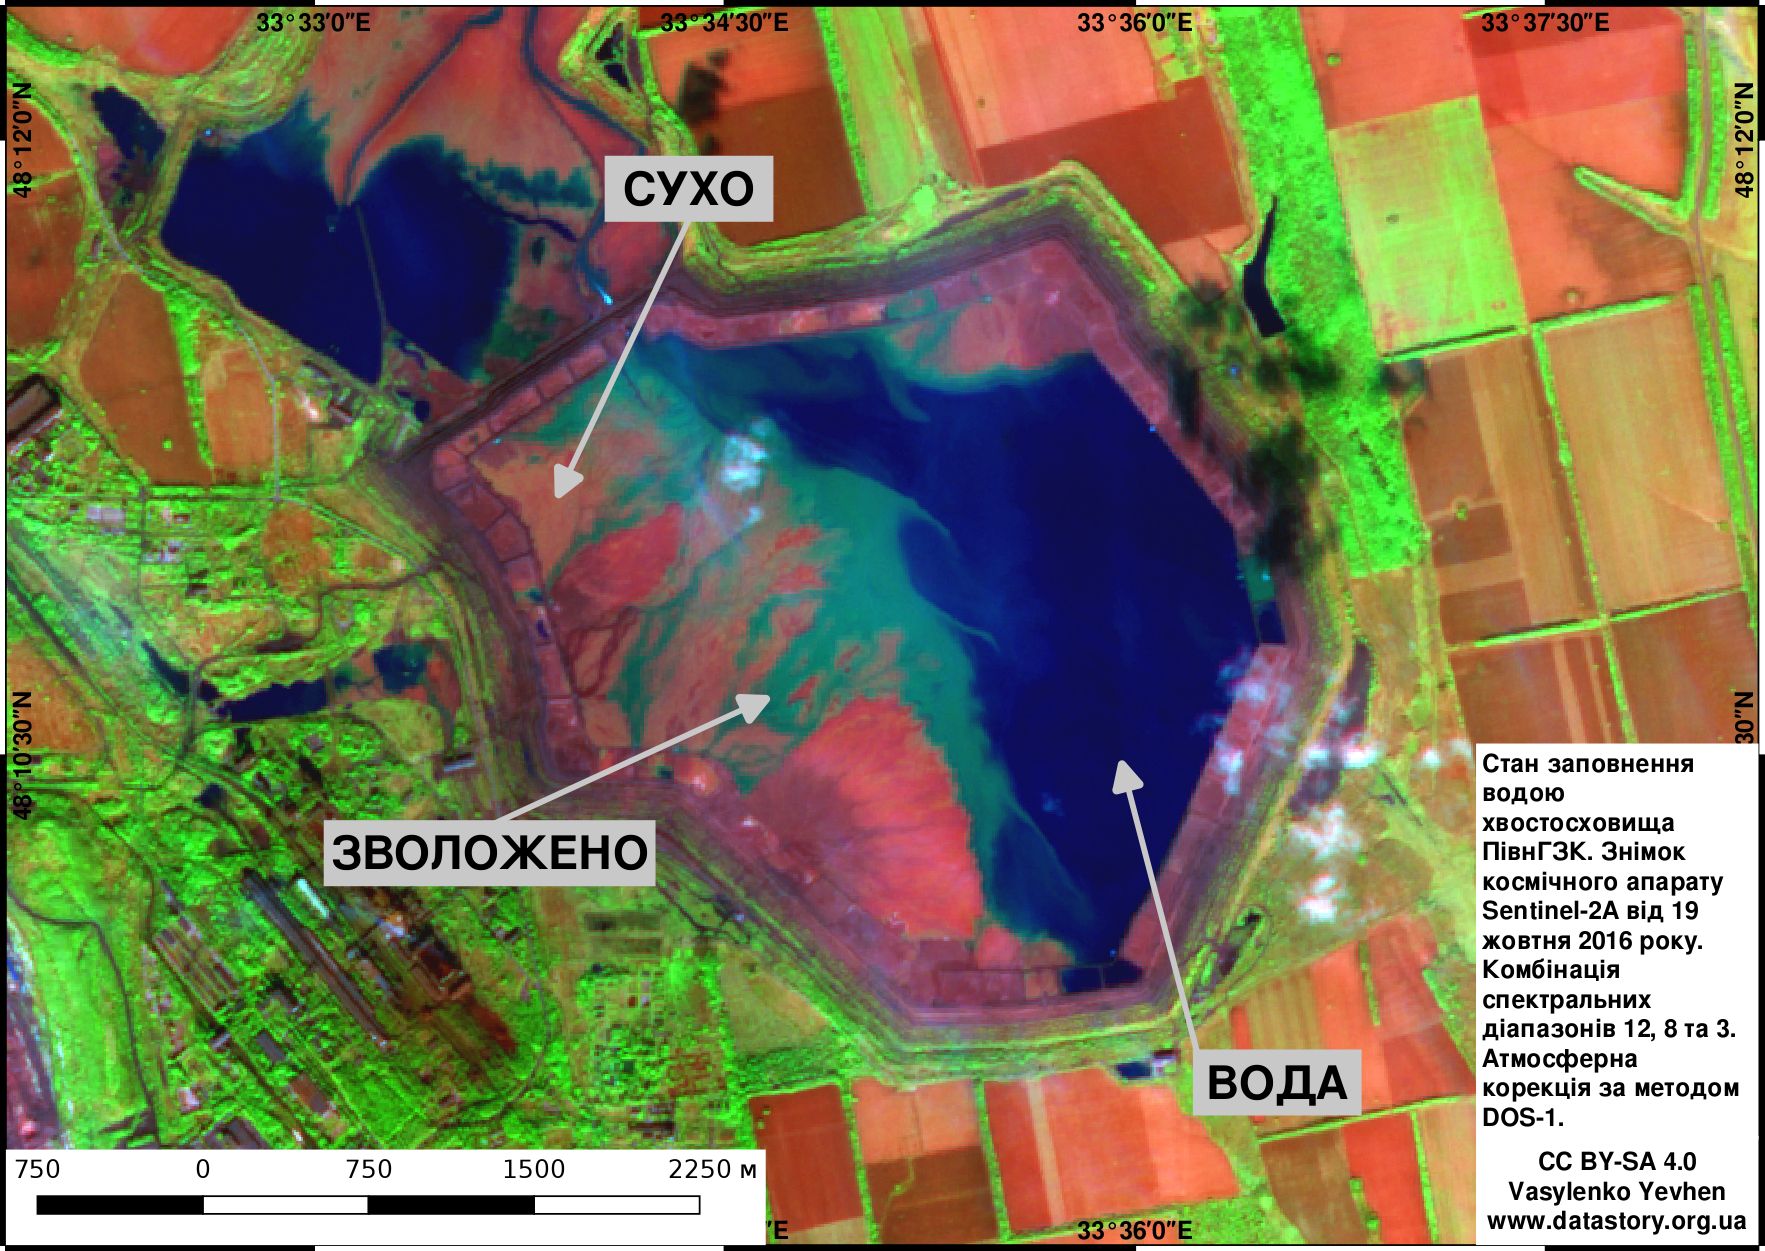
In the distant 2016, when I was a member of an environmental NGO in Kryvyi Rih (Ukraine), I started using satellite Earth Observation data to monitor the condition of large industrial tailings ponds.
At that time, environmental regulations required these storage facilities to be either flooded or at least kept moist to prevent dust storms.
Industrial operators often ignored these rules, leaving huge dry surfaces exposed — which created massive dust pollution affecting nearby communities.
Using Sentinel-2 and Landsat-8 imagery with false-color composites, I developed a simple but effective method to map dry, moist, and water-covered zones of tailings ponds.
Local residents and journalists were absolutely delighted! Industrial companies, on the other hand… reacted very differently 🤣
These maps are from 2016–2017 and show several tailings facilities around #KryvyiRih.
#RemoteSensing #EarthObservation #Sentinel2 #OpenData #EnvironmentalMonitoring
#Tailings #Mining #DustPollution #GIS #QGIS #Ukraine #Landsat
🌿 Greenness of Calgary Communities (Summer 2024)
📎 https://www.datastory.org.ua/greenness-of-calgary-communities-summer-2024/
Last year I published my first attempt to analyze the actual vegetation condition across Calgary and to build a data-driven ranking of its communities based on median summer NDVI. It was my very first experiment in assessing urban greenness at the neighbourhood scale — but the results turned out surprisingly insightful.
Some patterns were expected, while others revealed unexpectedly low vegetation density in places that looked green from the ground.
This exploration later grew into a much larger line of research on Calgary’s greenness, climate resilience, and spatial variability in vegetation health. You can find some results here with thematic hashtag #GreennessOfCalgary
If you're working on urban ecology, remote sensing, or land-cover analysis of Canadian cities — I’d be happy to exchange ideas.
#NDVI #RemoteSensing #Calgary #UrbanEcology #Sentinel2 #QGIS #RStats #Alberta #Canada #EnvironmentalMonitoring #GeospatialAnalysis

Here is the city-wide map of ΔNDVI for Calgary — the difference between the median summer NDVI (mid-May to mid-September) in 2024 vs 2025.
As in the previous post, the signal is quite clear:
2025 shows a systematic increase in vegetation index across almost the entire city, but some areas showing a decrease.
This pattern is consistent with what I see in the frequency distributions of median NDVI:
2025 has a broader, greener distribution — likely reflecting better moisture conditions and a more favourable growing season.
Working with ΔNDVI on a pixel-by-pixel scale (10 × 10 m) offers a much more detailed picture of how vegetation responds spatially, compared with community-level averages or city-wide summaries.
#NDVI #Sentinel2 #RemoteSensing #Calgary #GreennessOfCalgary #GIS #Rstats #DataAnalysis #ESA #UrbanEcology #Copernicus #CopernicusSentinel #SustainableDevelopment #SustainableUrbanDevelopment #Alberta #Canada #EnvironmentalMonitoring #GIS #Geospatial

🌿 A noticeable shift in the statistical distribution of median NDVI values for Calgary between 2024 and 2025.
🛰️ Both histograms are based on Sentinel-2 data with 10×10 m resolution, and each NDVI value represents the median for mid-May to mid-September.
The contrast is striking:
🔥 2024 shows a distribution shifted toward lower NDVI values → drier summer, weaker vegetation growth, more heat-stress periods.
🏡 2025 is clearly shifted to the right → stronger greenness, more moisture, and more stable summer conditions.
This kind of interannual comparison reveals how much the city’s ecosystems can vary from year to year — using nothing more than open satellite data and clean statistics.
#NDVI #Sentinel2 #RemoteSensing #Calgary #GreennessOfCalgary #GIS #Rstats #DataAnalysis #ESA #UrbanEcology #Copernicus #CopernicusSentinel #SustainableDevelopment #SustainableUrbanDevelopment #Alberta #Canada

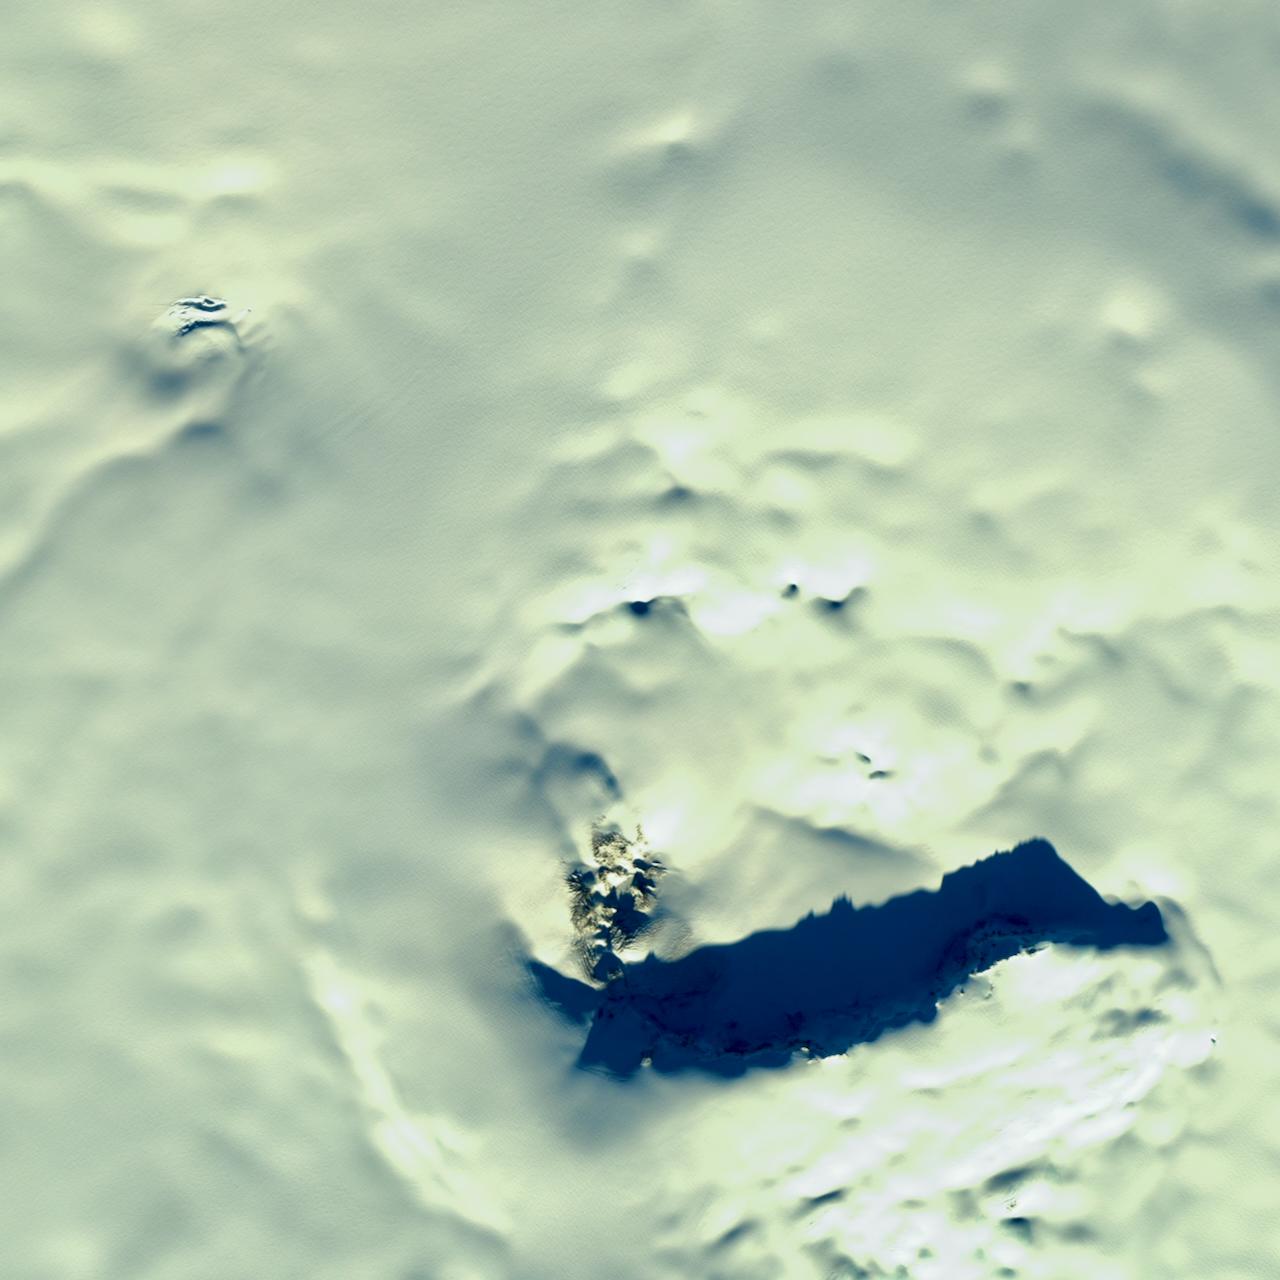
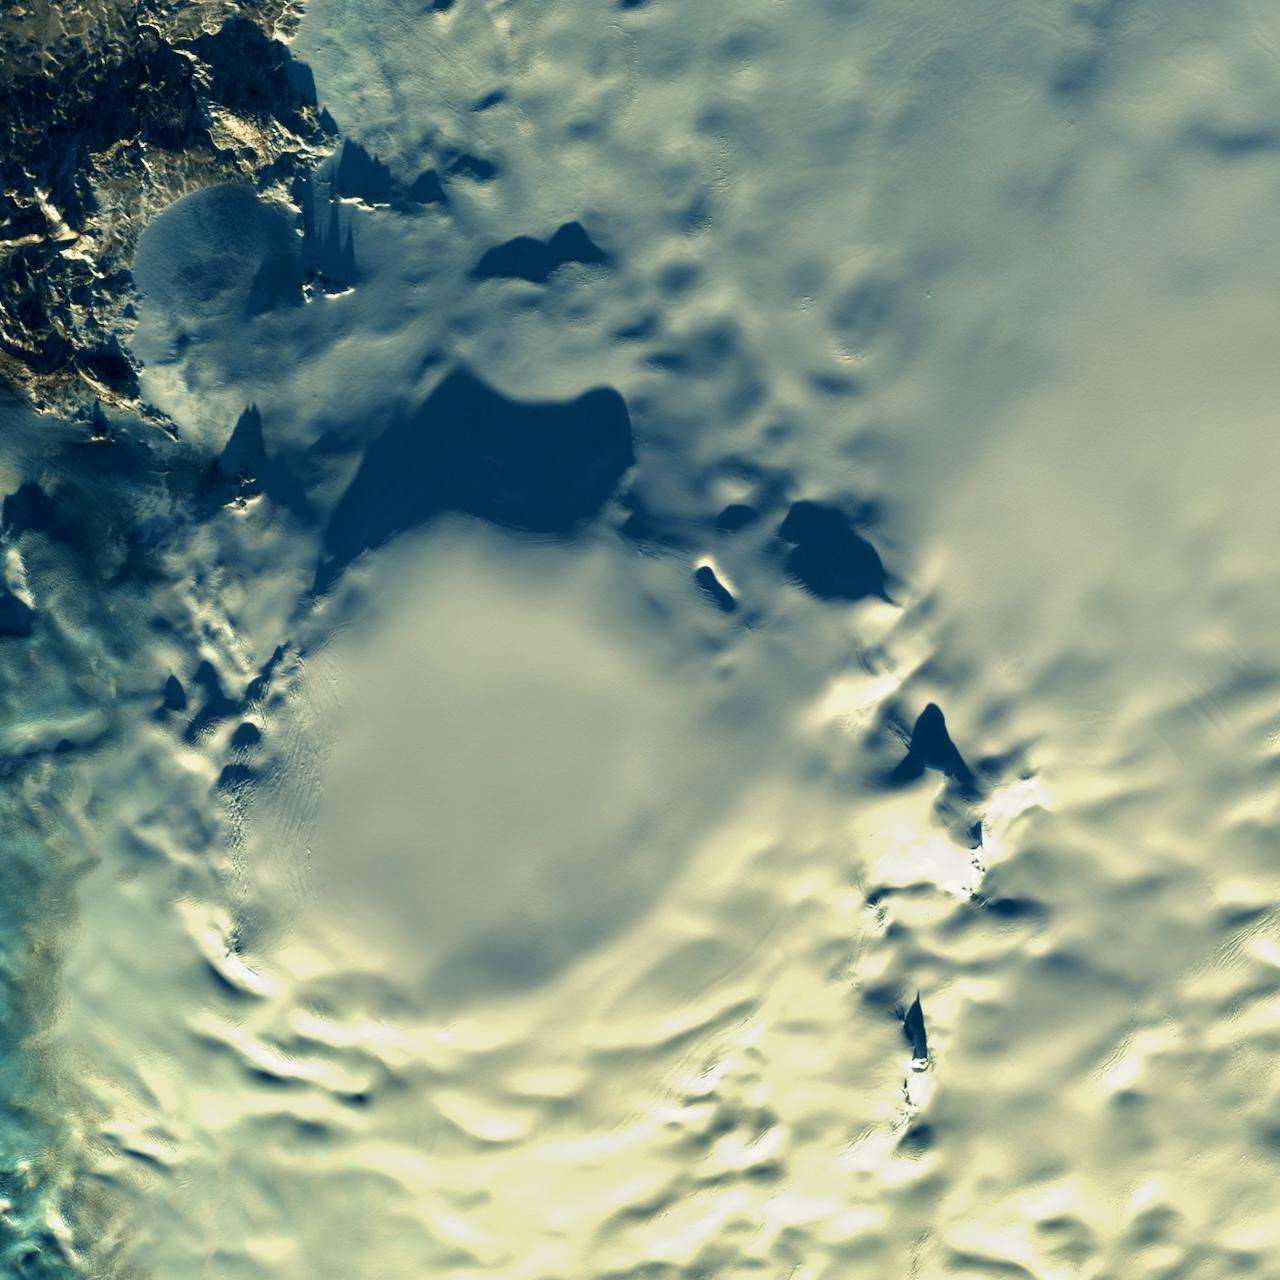
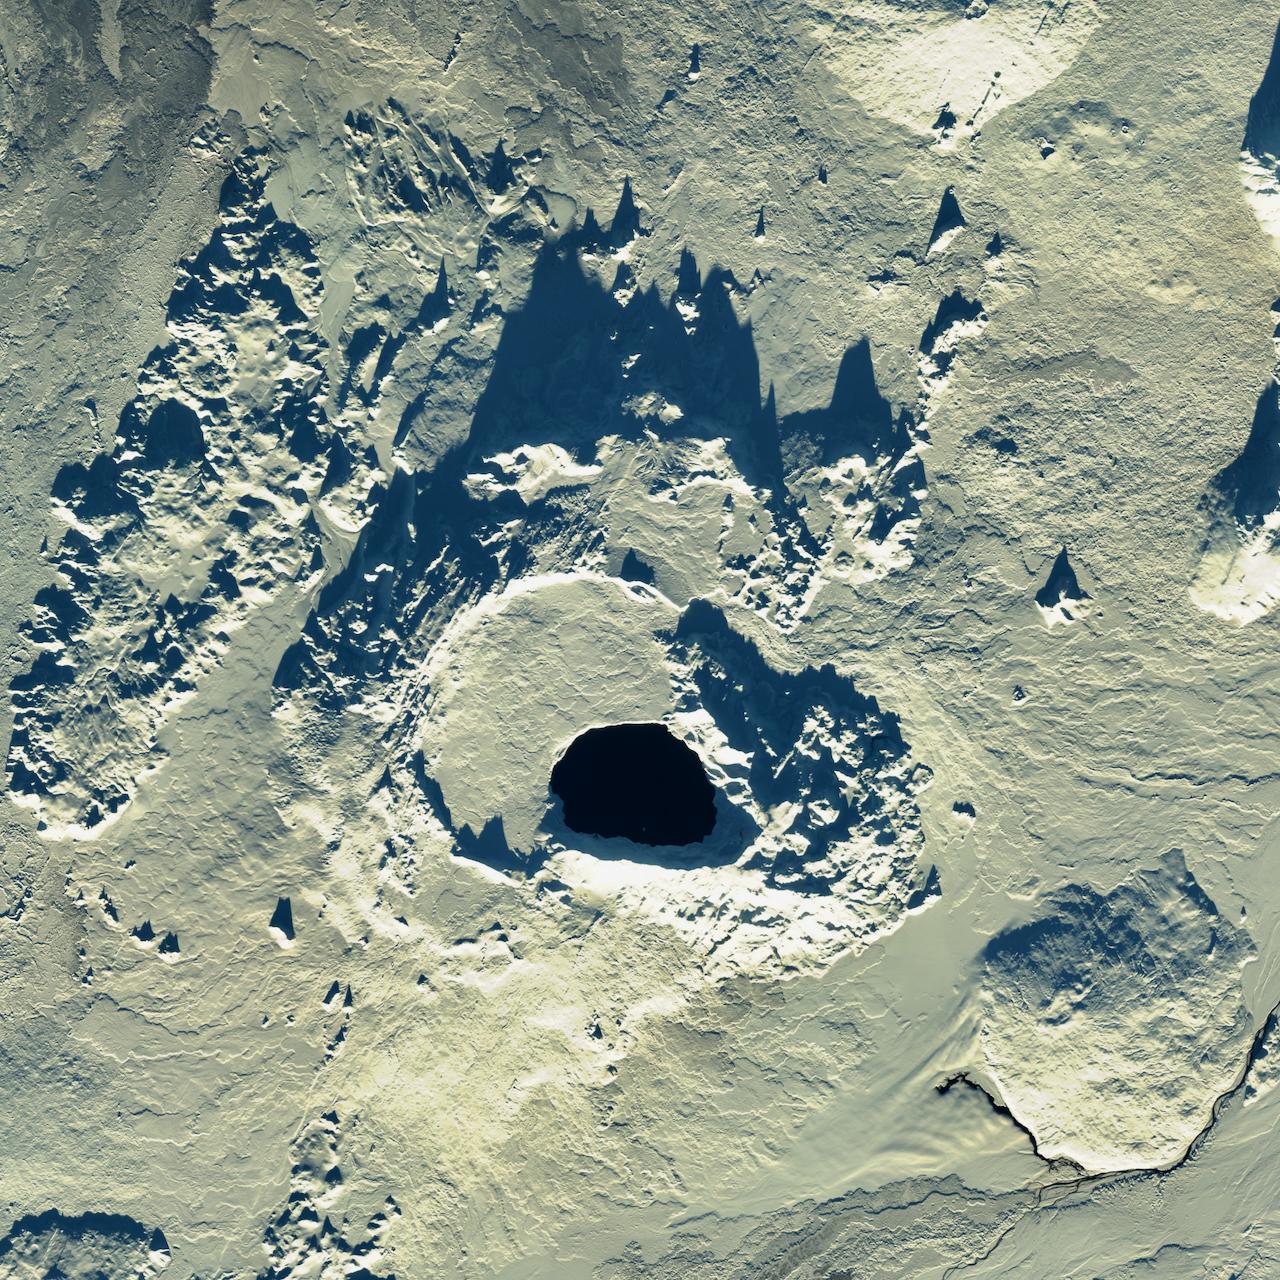
November is my favorite time to look at #Sentinel2 images of Iceland. All the long shadows draw out the landscape is we are just about to hit the dark months in the visual spectrum acquisitions.
Client Info
Server: https://mastodon.social
Version: 2025.07
Repository: https://github.com/cyevgeniy/lmst