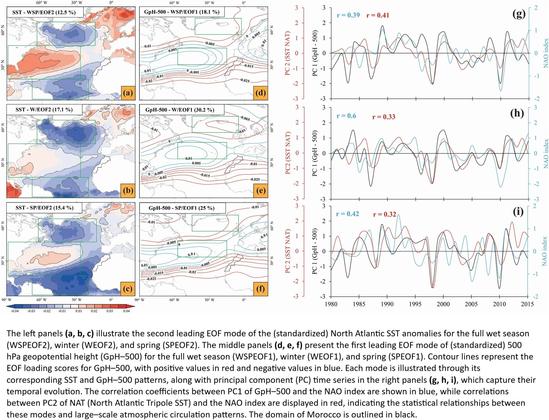
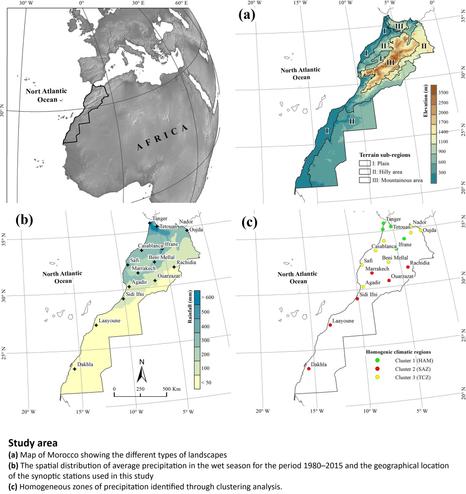
Influence Of Atmospheric And Oceanic Circulation Patterns On Precipitation Variability In North Africa With A Focus On Morocco
--
https://doi.org/10.1038/s41598-025-02718-0 <-- shared paper
--
[metrology, including regional, is not a subject I know a lot about, but this was an excellent paper to read]
#GIS #spatial #mapping #Morocco #NorthAfrica #meteorology #regional #model #modeling #weather #rainfall #precipitation #temperature #spatialanalysis #spatiotemporal #wetseason #patterns #statistics #geostatistics #climate #climatechange #indicators #teleconnections #seasonal #regression #wavelet #seasurfacetemperature #MediterraneanOscillation #NorthAtlanticOscillation #forecasting #atmosphere #ocean #marine #circulation
#seasurfacetemperature
Ocean warming is accelerating, not just gradually increasing!
The research indicates that global mean sea surface temperature (GMSST) is rising faster than previously thought. The rate of increase has risen from 0.06 Kelvin per decade (1985-1989) to 0.27 Kelvin per decade (2019-2023). EEA-based model fits the data much better than linear models. Therefore, linear extrapolations of GMSST are likely to underestimate future warming.
#Climate #NOA #SeaSurfaceTemperature
Looks like we are off to another race.
https://climatereanalyzer.org/clim/sst_daily/?dm_id=world2
Are past #ocean #temperature #reconstructions based on #geochemical indicators representative at the #local and #regional scales, as such reconstructions typically rely on a single #sediment core?
This new #scientific #publication—not co-authored by me—addresses this #question:
https://doi.org/10.1186/s40645-024-00664-5
#Science
#ScienceMastodon #AcademicMastodon
#PaleoClimate #SeaTemperature #SeaSurfaceTemperature #SST
#Geochemistry #Foraminifera #MgCa #Biomarkers #Alkenones #GDGTs #isoGDGTs
My co-authored #scientific #publication by De Jonge et al. (2024) G³ just got cited in this new #paper with a multi-#biomarker paleo-sequence:
https://doi.org/10.1016/j.gloplacha.2024.104620
Also featuring a novel (OH-)isoGDGT-based #paleotemperature #ClimateProxy!
Disclaimer: I am not a co-author and I was not a reviewer either.
#Science
#ScienceMastodon #AcademicMastodon
#PaleoClimate #SeaTemperature #SeaSurfaceTemperature #SST
#Biomarkers #Alkenones #Diols #LongChainDiols #GDGTs #isoGDGTs
https://mastodon.world/@nina_davtian/113364845688520878
#Halloween is soon and so is the beginning of a new #chapter of my #academic #career!
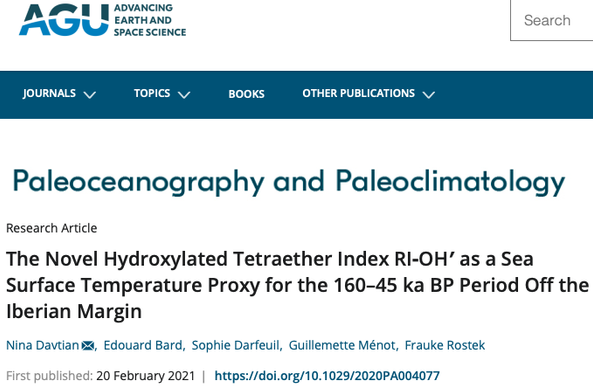
For this reason, I reintroduce one of my most significant first-authored #research articles (Davtian et al., 2021 #Paleoceanography and #Paleoclimatology):
https://doi.org/10.1029/2020PA004077
More details in the #thread below: (1/15)
#Science
#ScienceMastodon #AcademicMastodon
#Paper #Scientific #Publication
#PaleoClimate #ClimateChange
#ClimateProxies #SeaSurfaceTemperature
#NorthAtlantic #AtlanticOcean #Atlantic #Ocean
Good to see the CR graphs of Sea Surface Temperature are back. The data is still WELL about the mean and the trend is still horrifying, but the numbers are back.
#ClimateCrisis
#ClimateEmergency
#SeaSurfaceTemperature
Ocean weather drives land weather. How it is.
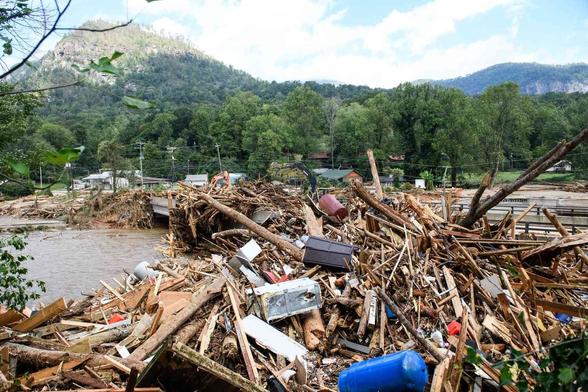
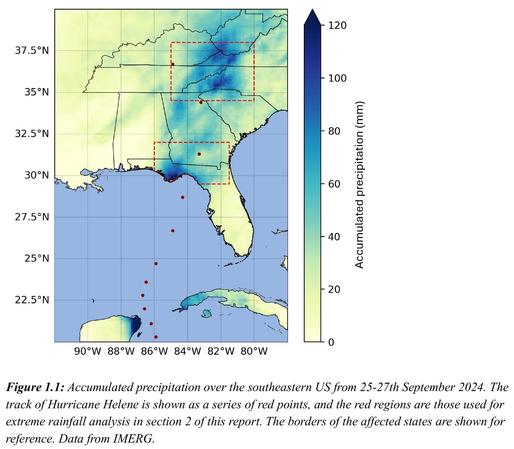
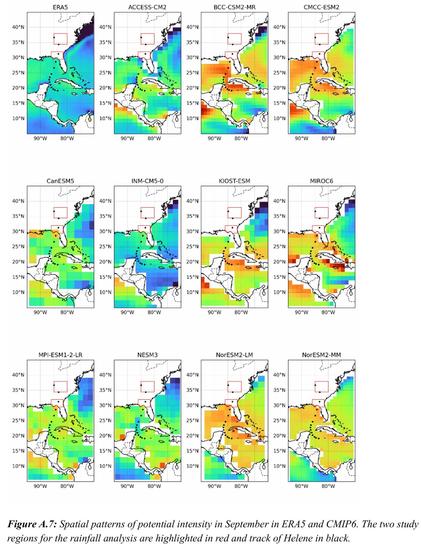
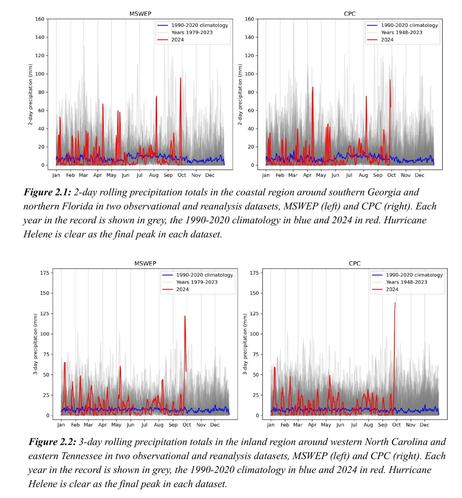
Climate Change Key Driver Of Catastrophic Impacts Of Hurricane Helene That Devastated Both Coastal And Inland Communities [technical report]
--
http://alturl.com/5n38k <-- shared technical report
--
#GIS #spatial #mapping #spatialanalysis #hurricane #hurricanehelene #spatiotemporal #risk #hazard #naturaldisaster #impact #climatechange #precipitation #seasurfacetemperature #Appalachia #damage #loss #infrastructure #deaths #rainfall #precipitation #flood #flooding #engineeringgeology #erosion #massmovement #mudslides #landslides #debrisflows #disastermanagement #prediction #mitigation #climatemodels #model #modeling #spatiotemporal #IRIS #winds #extremeweather #weather #storm #humanimpacts #costs #economy #SST #warning #weatherprediction #dams #reservoirs #loss #lossoflife
Ocean Heat for Hurricane Helene [mapped]
--
https://earthobservatory.nasa.gov/images/153376/ocean-heat-for-hurricane-helene <-- shared technical post
--
https://cmr.earthdata.nasa.gov/virtual-directory/collections/C1996881146-POCLOUD <-- example of sea surface temperature data
--
#GIS #spatial #mapping #spatialanalysis #spatiotemporal #Hurricane #HurricaneHelene #HurricaneHelene2024 #climatechange #extremeweather #risk #hazard #naturaldisaster #Florida #USSouthEast #seasurfacetemperature #oceanheat #remotesensing #model #modeling #opendata #warmwater #marine #temperature #LoopCurrent #storm #stormsurge #GulfOfMexico #MURSST
@NOAA @nasa @ESA
FYI
via Scott Duncan
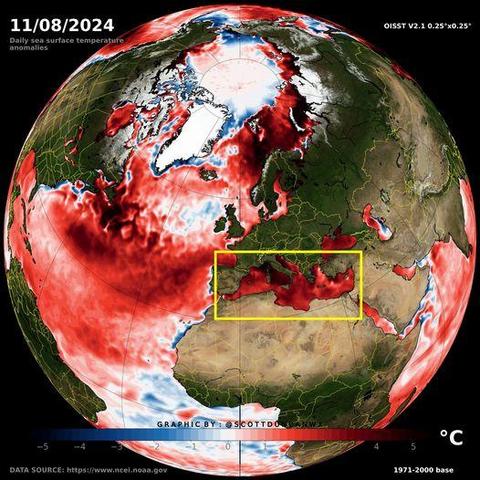
"It is official.
The Mediterranean sea surface temperature has just set a new heat record. The average sea surface temperature for the Mediterranean just hit a staggering +28.15°C. Eighteen out of the top twenty hottest days for the Mediterranean sea surface have been observed in the last thirteen months alone."
#climate #ClimateScience #ClimateEmergency #ClimateCrisis #ClimateBreakdown #ExtremeWeather #ScottDuncan #FYI #SeaSurfaceTemperature
"Record #SeaSurfaceTemperature (SST) detected by @CDIPBuoys
: CDIP 256 located in the Gulf of Mexico clocked a temperature of 35 degrees Celsius, or 95 degrees Fahrenheit — the warmest detected #SST in the history of CDIP. View the data here:
https://cdip.ucsd.edu/m/products/?stn=256p1
- Scripps Oceanography
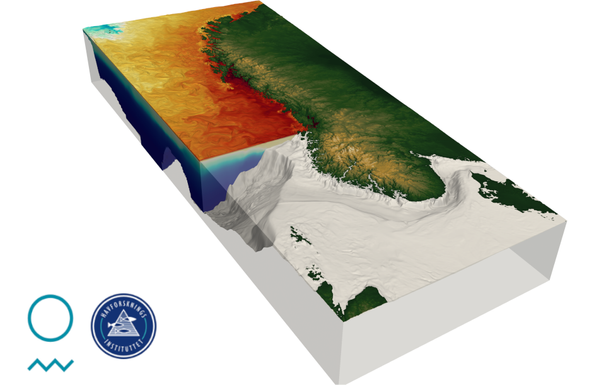
To provide forecasts on #SeaSurfaceTemperature and #OceanCurrent, the Norwegian Meteorological Institute and the Norwegian Institute of Marine Research developed a model called #Norkyst.
The model assimilate OSI SAF's #Metop-B and #Metop-C Sea Surface Temperature products. 🌡 🌊 🛰
More in this story on our website :
Let's meet people working to provide the best #Ocean satellite observation possible 🛰 🌍. Today, Steinar Eastwood from the Norwegian Meteorological Institute presents how he's been working for OSI SAF #SeaIce and #SeaSurfaceTemperature from our team in #Oslo... Whach this video to learn more !
https://youtu.be/BbDulkeHPDU?si=JWxGYINVqzZbSzNC
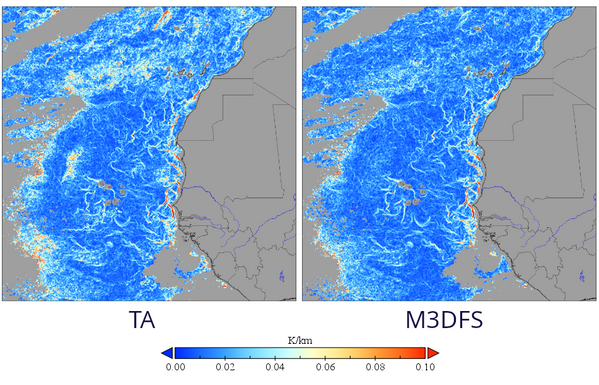
Marouan Bouali from Orbty worked with our #SeaSurfaceTemperature research team in @meteofrance #Lannion to improve the data reprocessing for future #Climate Data Records 🌡 🌊 🛰 .
Additionally to validate the temporal stability of #MSG 🛰 , he managed to produced improved climatologies of SST and got promising results in level SST retrieval using the multidimensional Dynamics Data Fusion System 💻
read more on our website : https://osi-saf.eumetsat.int/community/stories/towards-improved-sea-surface-temperature-climate-data-record-meteosat-second
Let's meet people working to provide the best #Ocean and #SeaIce satellite observation possible 🛰 🌍. Today, Thibault Guinaldo from @meteofrance presents his researchs on #SeaSurfaceTemperature and #OceanColor in our team in #Lannion... Whach this video to learn more !
https://youtu.be/YKnUNwfwSNo
The interaction between the oceans and the atmosphere plays a vital role in shaping the Earth's climate. Changing sea surface temperatures can heat or cool the atmosphere, and changes in the atmosphere can do the same to the ocean surface...
#oceans #climate #atmosphere #jetstream #oceanatmosphere #SeaSurfaceTemperature #climatechange #EarthScience #environment #marinescience #geography https://phys.org/news/2024-03-extratropical-ocean-atmosphere-interactions-contribute.html
5/
Updated visualisation of the daily #SeaSurfaceTemperature (SST):
https://climatereanalyzer.org/clim/sst_daily/
(2023-2024 trends highlighted on the diagram exported from the URL above, see "License and Citation" section: "Climate Reanalyzer content is licensed under a #CreativeCommons Attribution 4.0 International License" https://creativecommons.org/licenses/by/4.0/ )
Data from #NOAA Optimum Interpolation SST (#OISST: https://www.ncei.noaa.gov/products/optimum-interpolation-sst ) - from latitude 60°S to 60°N, global scale.
See also @ZLabe
https://fediscience.org/@ZLabe/112123321294788366
I'm no authority, to say the least, but from reading and following this subject for a number of years it seems that for decades the oceans have been predictably "heroic" in absorbing atmospheric heat which has been disbursed in their waters so uniformly that it's been virtually unmeasurable. Those days are now over and the seas have reached their limit and can absorb no more without their temperatures rising.
#SST #SeaSurfaceTemperature
“We don’t really know what’s going on,” Gavin Schmidt, the director of NASA’s Goddard Institute for Space Studies, told me. “And we haven’t really known what’s going on since about March of last year.” He called the situation “disquieting.”
#SST #SeaSurfaceTemperature
https://www.newyorker.com/news/daily-comment/why-is-the-sea-so-hot
#February2024 was warmest on record globally, making it the ninth month in a row with record temperatures for the time of year, say scientists.
Global #seasurfacetemperature (#SST) are at highest ever recorded, data from EU’s #Copernicus #ClimateChange Service show
Global average temperature for past 12mo highest on record at 1.56C above pre-industrial levels. Above the 1.5C threshold beyond which, over the long term, the worst impacts of #climatecrisis are expected.
https://www.theguardian.com/environment/2024/mar/07/february-warmest-on-record-globally-copernicus-climate-change-service

