
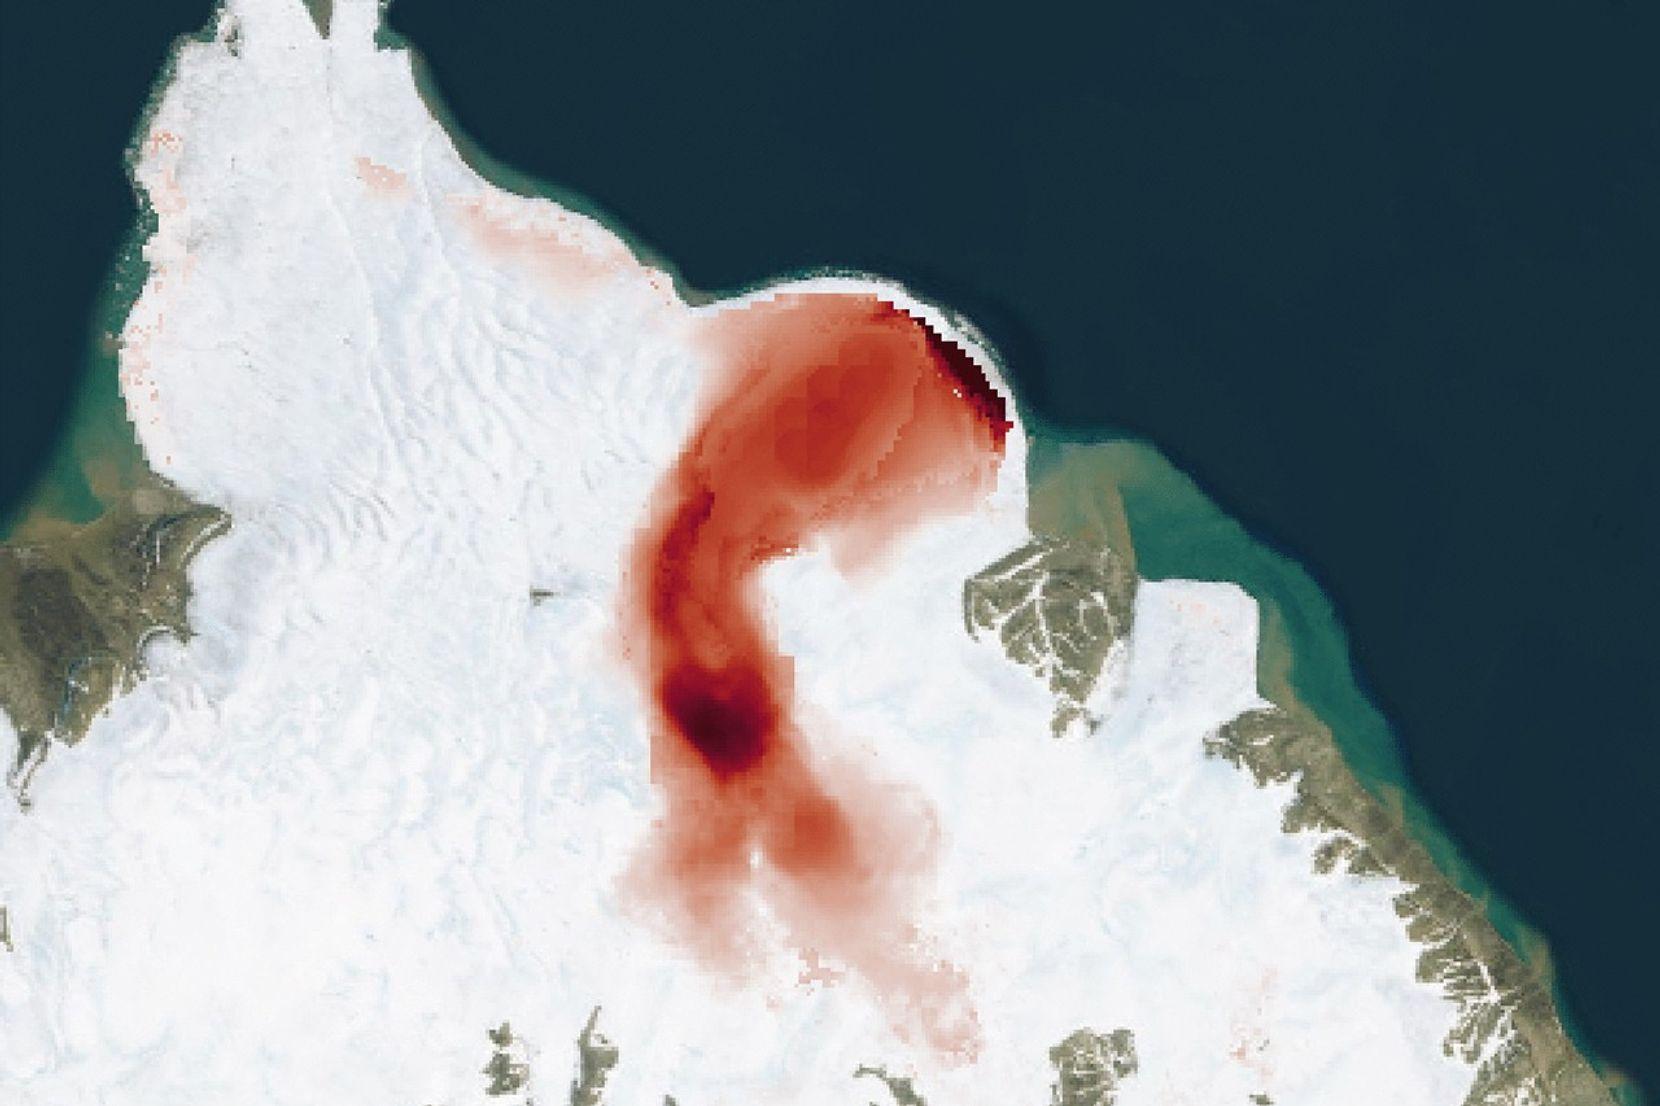
Stonebreen’s Beating Heart https://science.nasa.gov/earth/earth-observatory/stonebreens-beating-heart/ #NASA #Cryosphere #EarthObservatory #EarthVisualizationMapping #IceGlaciers #JetPropulsionLaboratory
#Cryosphere

Glacier Surging And Surge-Related Hazards In A Changing Climate
--
https://doi.org/10.1038/s43017-025-00757-9 <-- shared paper | https://rdcu.be/e3BIH
--
#GIS #spatial #mapping #remotesensing #cryosphere #glacier #glacial #melting #climatechange #iceflow #glaciersurges #surges #movement #spatialanalysis #spatiotemporal #climate #GLOF #risk #hazard #damage #infrastructure #basal #mechanics #processes #model #modeling #glaciologists


Stonebreen’s Beating Heart http://dlvr.it/TQx0N9 #Cryosphere #EarthObservatory #IceGlaciers #JetPropulsionLaboratory
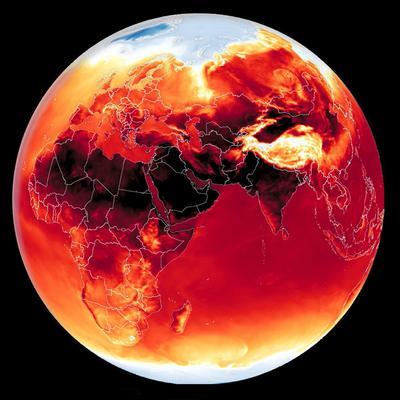
The risk of a hothouse Earth trajectory: massive, sometimes abrupt, and undoubtedly disruptive. A much less habitable state of the climate for us.
"The world is closer than thought to a “point of no return” after which runaway global heating cannot be stopped, scientists have said."
"The public and politicians were largely unaware of the risk of passing the point of no return, the researchers said. The group said they were issuing their warning because while rapid and immediate cuts to fossil fuel burning were challenging, reversing course was likely to be impossible once on the path to a hothouse Earth, even if emissions were eventually slashed."
“We know we are running profound risks on the current climate trajectory, which we can’t rule out could turn into a trajectory towards a much less habitable state of the climate for us. " >>
https://www.theguardian.com/environment/2026/feb/11/point-of-no-return-hothouse-earth-global-heating-climate-tipping-points
#FossilFuels #climate #HothouseEarth #AMOC #cryosphere #SeaLevels #habitability
Stratigraphic Evidence For Modern-Like Glacier Extents In South-Central Alaska Within The Last Glacial Period (MIS 3)
--
https://doi.org/10.1111/bor.70043 <-- shared paper
--
https://www.nps.gov/articles/000/ancient-glacier-change.htm <-- shared @NPS technical article
--
#glacier #Wisconsinan #glaciations #alaska #iceage #sediments #moraines #geology #stratigraphy #model #cryosphere #ice #snow #sedimentary #Chitina #CopperRiver #proglacial #water #hydrology #fluvial #glaciofluvial #glaciolacustrine #fans #Holocene #geomorphology #geomorphometry #landform #hydrogeomorphology #sedimentology #stratigraphic #sampling
@NPS


Chilled New York City http://dlvr.it/TQlJvv #Cryosphere #EarthObservatory #ExtremeTemperatures

For this World Wetlands Day, protecting wetlands without protecting ice is only half the story. The fate of wetlands is written upstream.
#Glacierwatch #WorldWetlandsDay #Wetlands #Cryosphere #ClimateSystems
I was at the Scarborough Bluffs beach today. The entire 1-km-long 100-meter-wide beach is covered with cabbage-sized frozen snowballs. Must have happened during the snowstorm. Does any one know the science behind how this happened? #meteorology #cryosphere #TorontoWeather #greatlakes #lakeontario #hydrology


G. Macelloni et al., "Wideband Radiometry From P to S Band for Monitoring Polar Regions," in Proceedings of the IEEE, doi: 10.1109/JPROC.2026.3653571.
#Microwave #Ocean #Antarctica #Cryosphere
https://ieeexplore.ieee.org/document/11363039
Accelerated Glacier Area Loss and Extinction of Small Glaciers in the Bhutanese Himalaya over the Past Five Decades
--
https://doi.org/10.3390/rs18020323 <-- shared paper
--
#Bhutan #Himalayas #glacierinventory #debriscover #laketerminating #cryosphere #glacier #inventory #change #GIS #spatial #mapping #spatialanalysis #spatiotemporal #glacierloss #extinction #spatialanalysis #spatiotemporal #remotesensing #earthobservation #GLOF #flood #flooding #atmospheric #warming #waterresources #naturalhazard #risk #hazard #mountain #highmountain #model #modeling #climatechange #glacierretreat #ecosystems #humanimpacts #Tibet


Absence of sea ice in Svalbard, Norway
▶️ 1 new picture from Copernicus https://commons.wikimedia.org/wiki/File:Absence_of_sea_ice_in_Svalbard%2C_Norway_%28Copernicus_2026-01-20%29.png

Oulu, Finland, a 2026 European Capital of Culture
▶️ 1 new picture from Copernicus https://commons.wikimedia.org/wiki/File:Oulu%2C_Finland%2C_a_2026_European_Capital_of_Culture_%28Copernicus_2026-01-16%29.png

Fire on Ice: The Arctic’s Changing Fire Regime https://science.nasa.gov/earth/earth-observatory/fire-on-ice-the-arctics-changing-fire-regime/ #NASA #CarbonCycle #Cryosphere #EarthObservatory #IceGlaciers #LandCover #Wildfires
Sentinel-1's decade of essential data over shifting ice sheets
Ice velocity is a key parameter in measuring the effects of #ClimateChange. The speed at which #glaciers and #IceSheets move tells us the rate at which they discharge ice and water into the sea, feeding into estimations on future #SeaLevelRise. Data on ice velocity also help to keep track of the break-up of ice sheets, such as calving events or damage to the ice sheets.
Since its first satellite was launched in 2014, the #Copernicus #Sentinel1 mission has provided a step change in the capabilities of polar satellite Earth observation. Its 12-m-long advanced #SAR instrument works in C-band. This makes it a reliable tool for acquiring high-resolution imagery for continuous monitoring and emergency response efforts. It is able to capture data through cloud cover, smoke and during lack of sunlight.
https://phys.org/news/2026-01-sentinel-decade-essential-shifting-ice.html
#ClimateScience
#RemoteSensing
#Cryosphere
#ClimateCatastrophe


Greenland
Camp Century The Untold Story of America's Secret Arctic Military Base Under the Greenland Ice, Kristian H. Nielsen and Henry Nielsen, Columbia University Press >>
https://cup.columbia.edu/book/camp-century/9780231201773/
Camp Century in a Changing Arctic, By Kristian H. Nielsen and Henry Nielsen >>
https://cupblog.org/2021/06/17/camp-century-in-a-changing-arctic-by-kristian-h-nielsen-and-henry-nielsen/
Marco Rubio says he will meet Danish officials to discuss Greenland next week>>
https://www.theguardian.com/world/2026/jan/07/france-and-allies-discuss-possible-response-to-donald-trump-us-invasion-of-greenland
#Greenland #cryosphere #ClimateDisruption #Arctic #nuclear #radioactive #waste #bases #missiles #EU
Snowfall leads to disruptions in the Netherlands
#Arctic #Cities #ColdWaves #Cryosphere #HumanActivities #Land
⏩ 2 new pictures from Copernicus https://commons.wikimedia.org/wiki/Special:ListFiles?limit=2&user=OptimusPrimeBot&ilshowall=1&offset=20260106120600


Tracking Weather Extremes: May 2025 Tornadoes and Flooding Across the Continental United States 🌎🛰️
#ArcticSeaice #ClimateVariabilityandChange #Cryosphere #Earth #EarthInformationCenter #GMAO #Hyperwall #Ice
⏩ 4 new pictures and 4 new videos from NASA (SVS) https://commons.wikimedia.org/wiki/Special:ListFiles?limit=25&user=OptimusPrimeBot&ilshowall=1&offset=20251230130252


The arctic wetlands of the Teshekpuk Lake, Alaska, USA
#Arctic #Cryosphere #Lakes #Land #Landcover
▶️ 1 new picture from Copernicus https://commons.wikimedia.org/wiki/File:The_arctic_wetlands_of_the_Teshekpuk_Lake%2C_Alaska%2C_USA_%28Copernicus_2025-12-29%29.png

Client Info
Server: https://mastodon.social
Version: 2025.07
Repository: https://github.com/cyevgeniy/lmst