
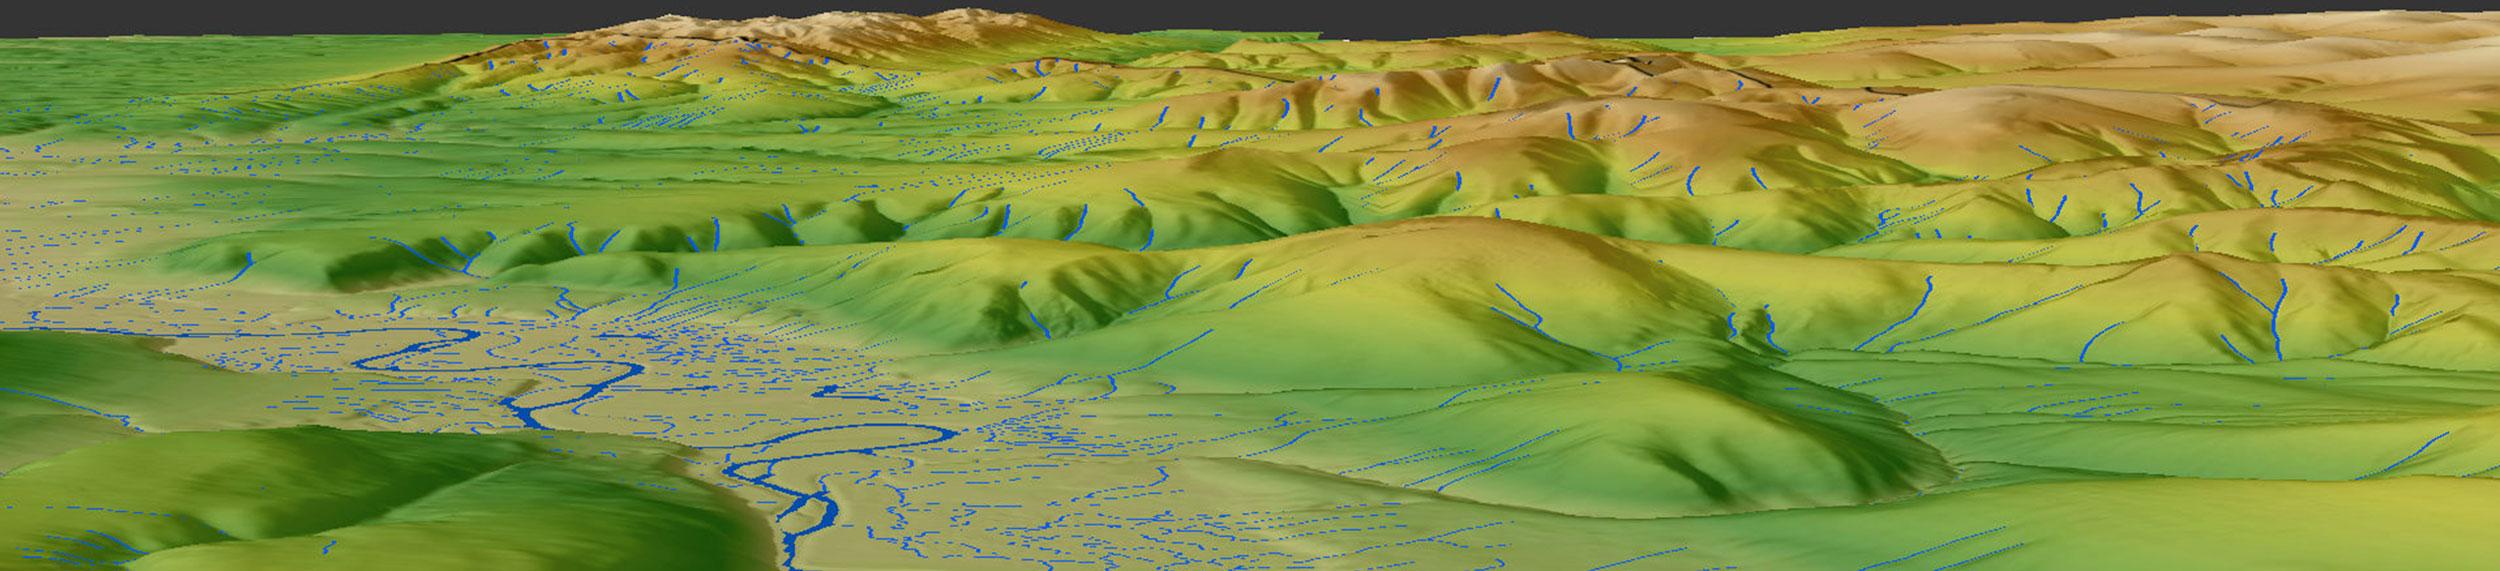
Large Drainage Systems Produced Half Of Mars’ Ancient River Sediment
--
https://doi.org/10.1073/pnas.2514527122 <-- shared paper
--
https://www.thebrighterside.news/post/scientists-discover-16-giant-river-networks-on-ancient-mars-where-life-could-have-thrived/ <-- shared technical media article
--
#water ##hydrology #dynamic #planet #Mars #extraterrestrial #ecosystems #drainage #landform
#drainageways #drainagesystems #Martian #terrain #geomorphology #geomorphometry #catchments #fluvia #pluvial #river #sediment #solarsystem #sedimentarybasins #life #habitable #sedimenttransport #topography #erosion #impact #crater #GIS #spatial #mapping #remotesensing #spacecraft #MRO #marsobservation #exploration #martian #MarsAttack
#geomorphometry


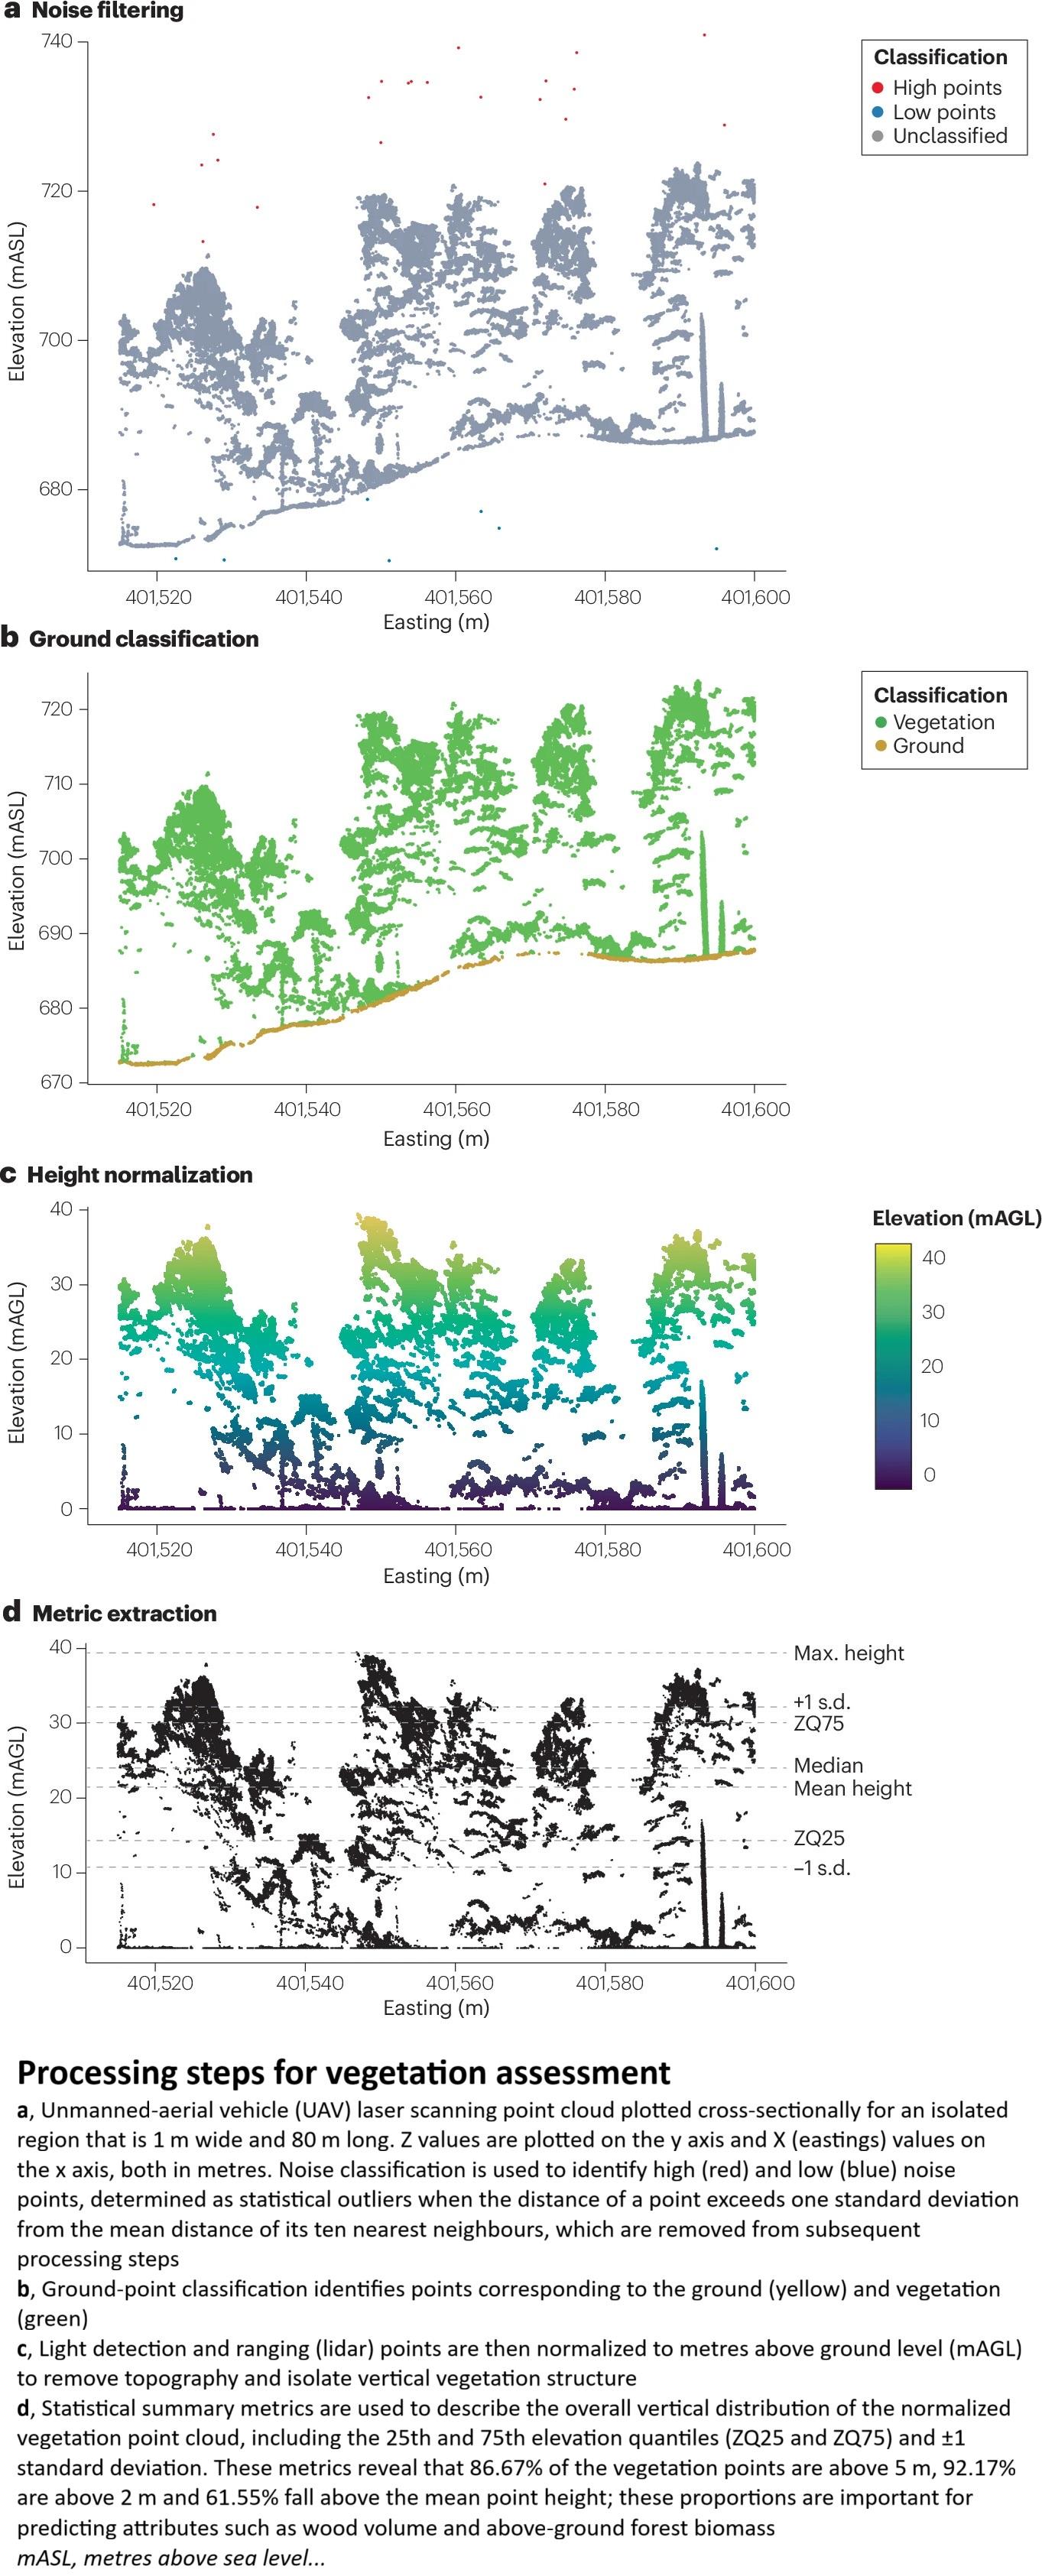
Light Detection And Ranging Of Natural Systems
--
https://doi.org/10.1038/s43586-025-00446-3 <-- shared paper
--
['primer'/'tutorial'/overview]
#GIS #spatial #mapping #remotesensing #explanation #tutorial #overview #primer #LiDAR #laserscanning #survey #pointcloud #spatialanalysis #airborne #satellite #usecase #vegetation #forest #forestry #resource #wildfire #fuel #elevation #topography #bathymetry #glaciology #glacier #workflow #naturalsystems #applications #algorithms #sensors #geomorphometry #geomorphology #drone #UAV #water #hydrology #groundbased #instrumentation #spatiotemporal #landsurface #landcover


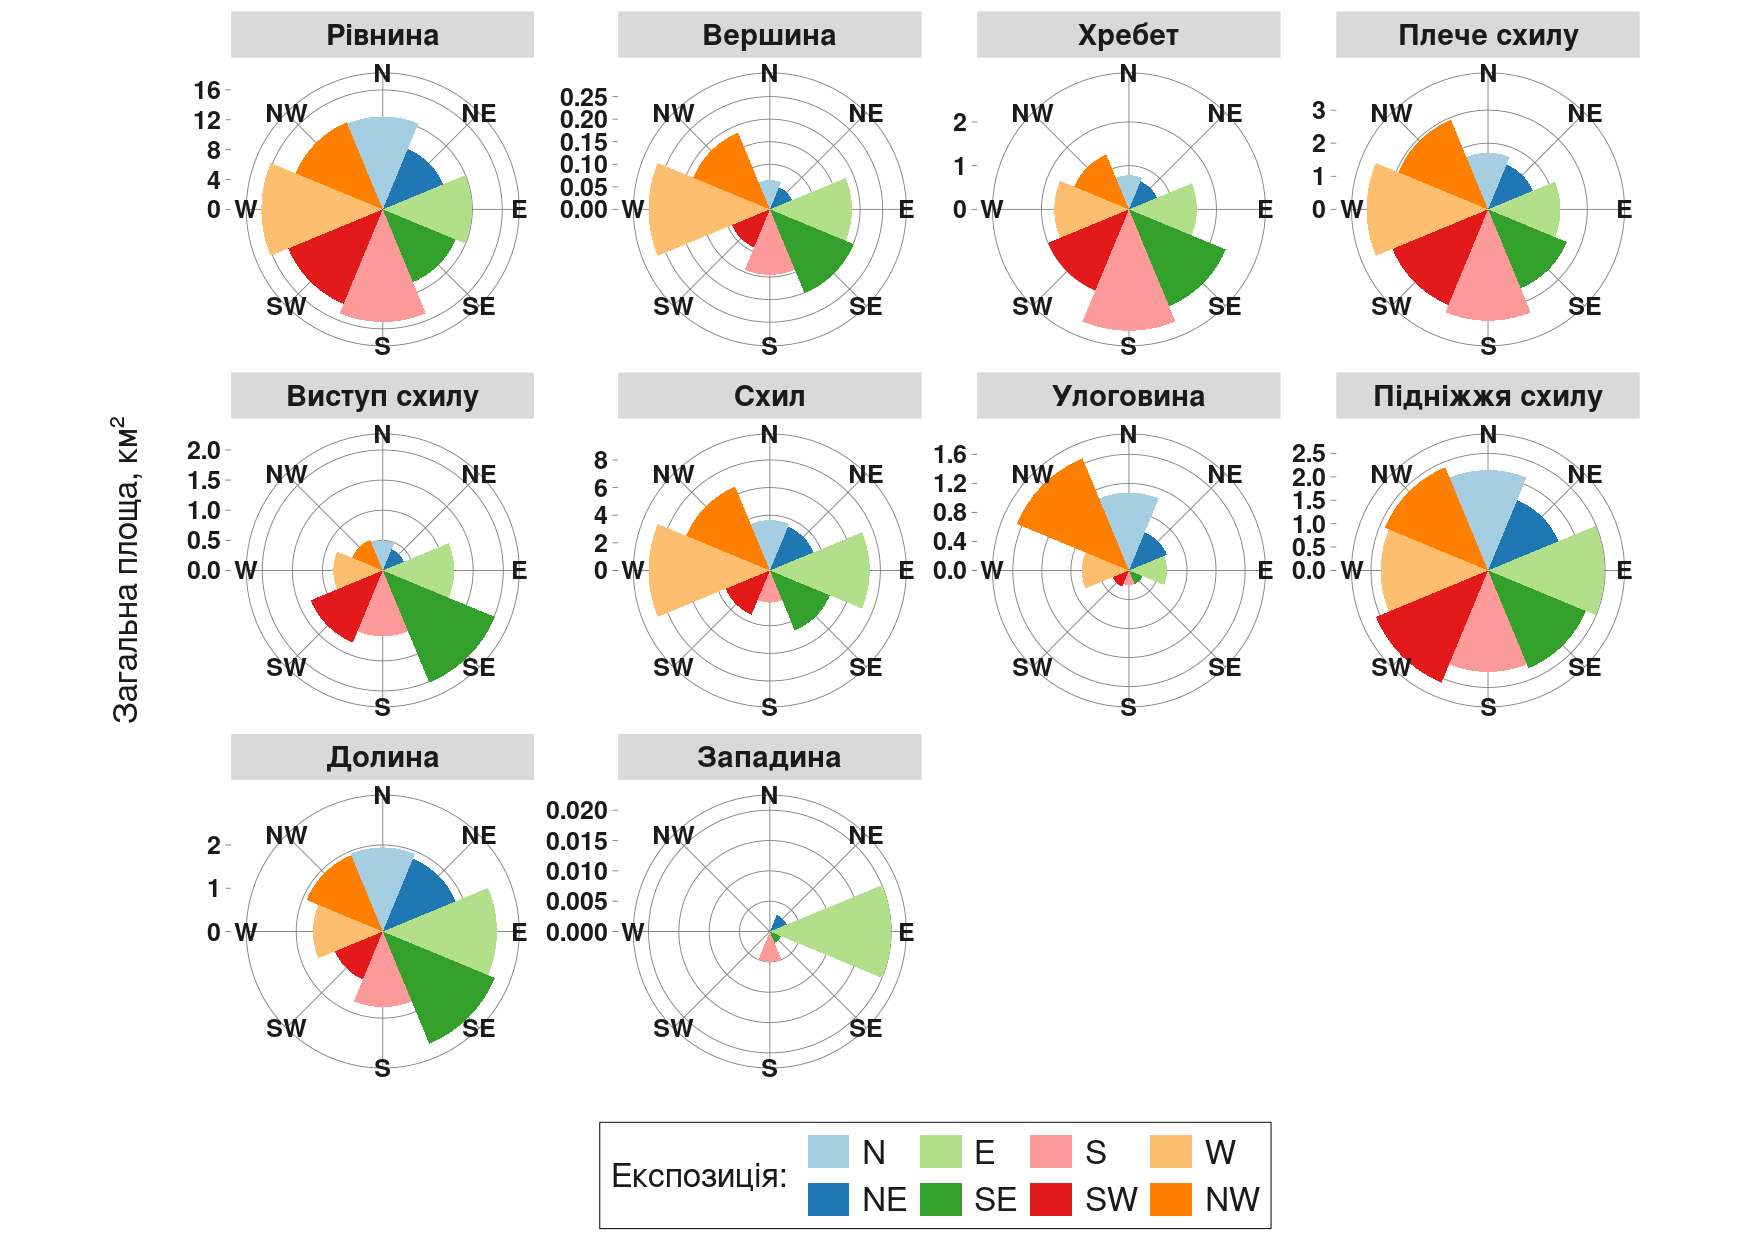
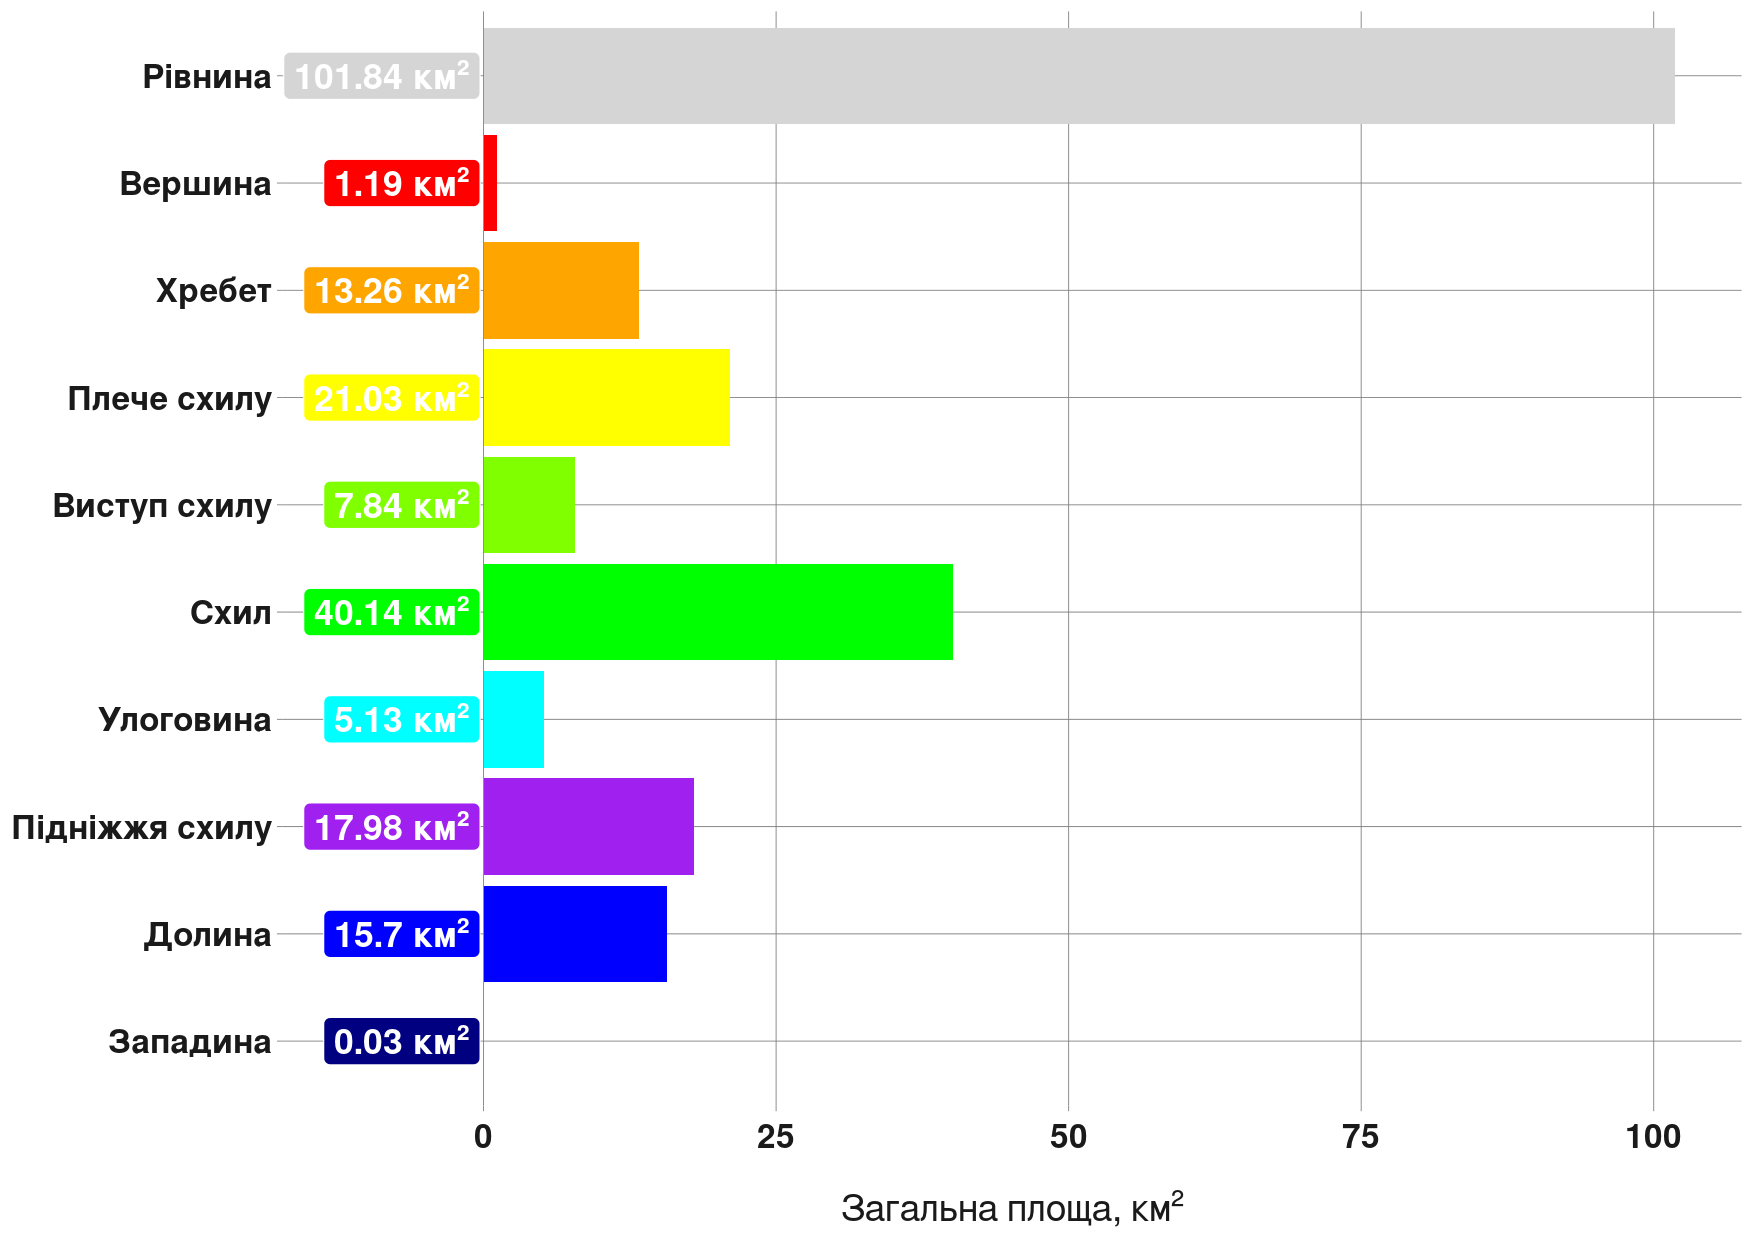
There are many ways to represent the spatial anisotropy of terrain forms.
In this case, I focused on a comparative approach: the real surface area of different geomorphon classes plotted against slope aspect.
All calculations were performed within the polygon of the effective catchment area of the Inhulets River.
This visualization highlights how specific landform types tend to “align” with certain aspect directions, revealing structural asymmetries within the catchment.
#Geospatial #Geomorphometry #TerrainAnalysis #RStats #DataViz #Hydrology #SAGA #EnvironmentalScience #GIS #RemoteSensing #InhuletsRiver #ggplot2 #Copernicus #CopernicusDEM #Geomorphology
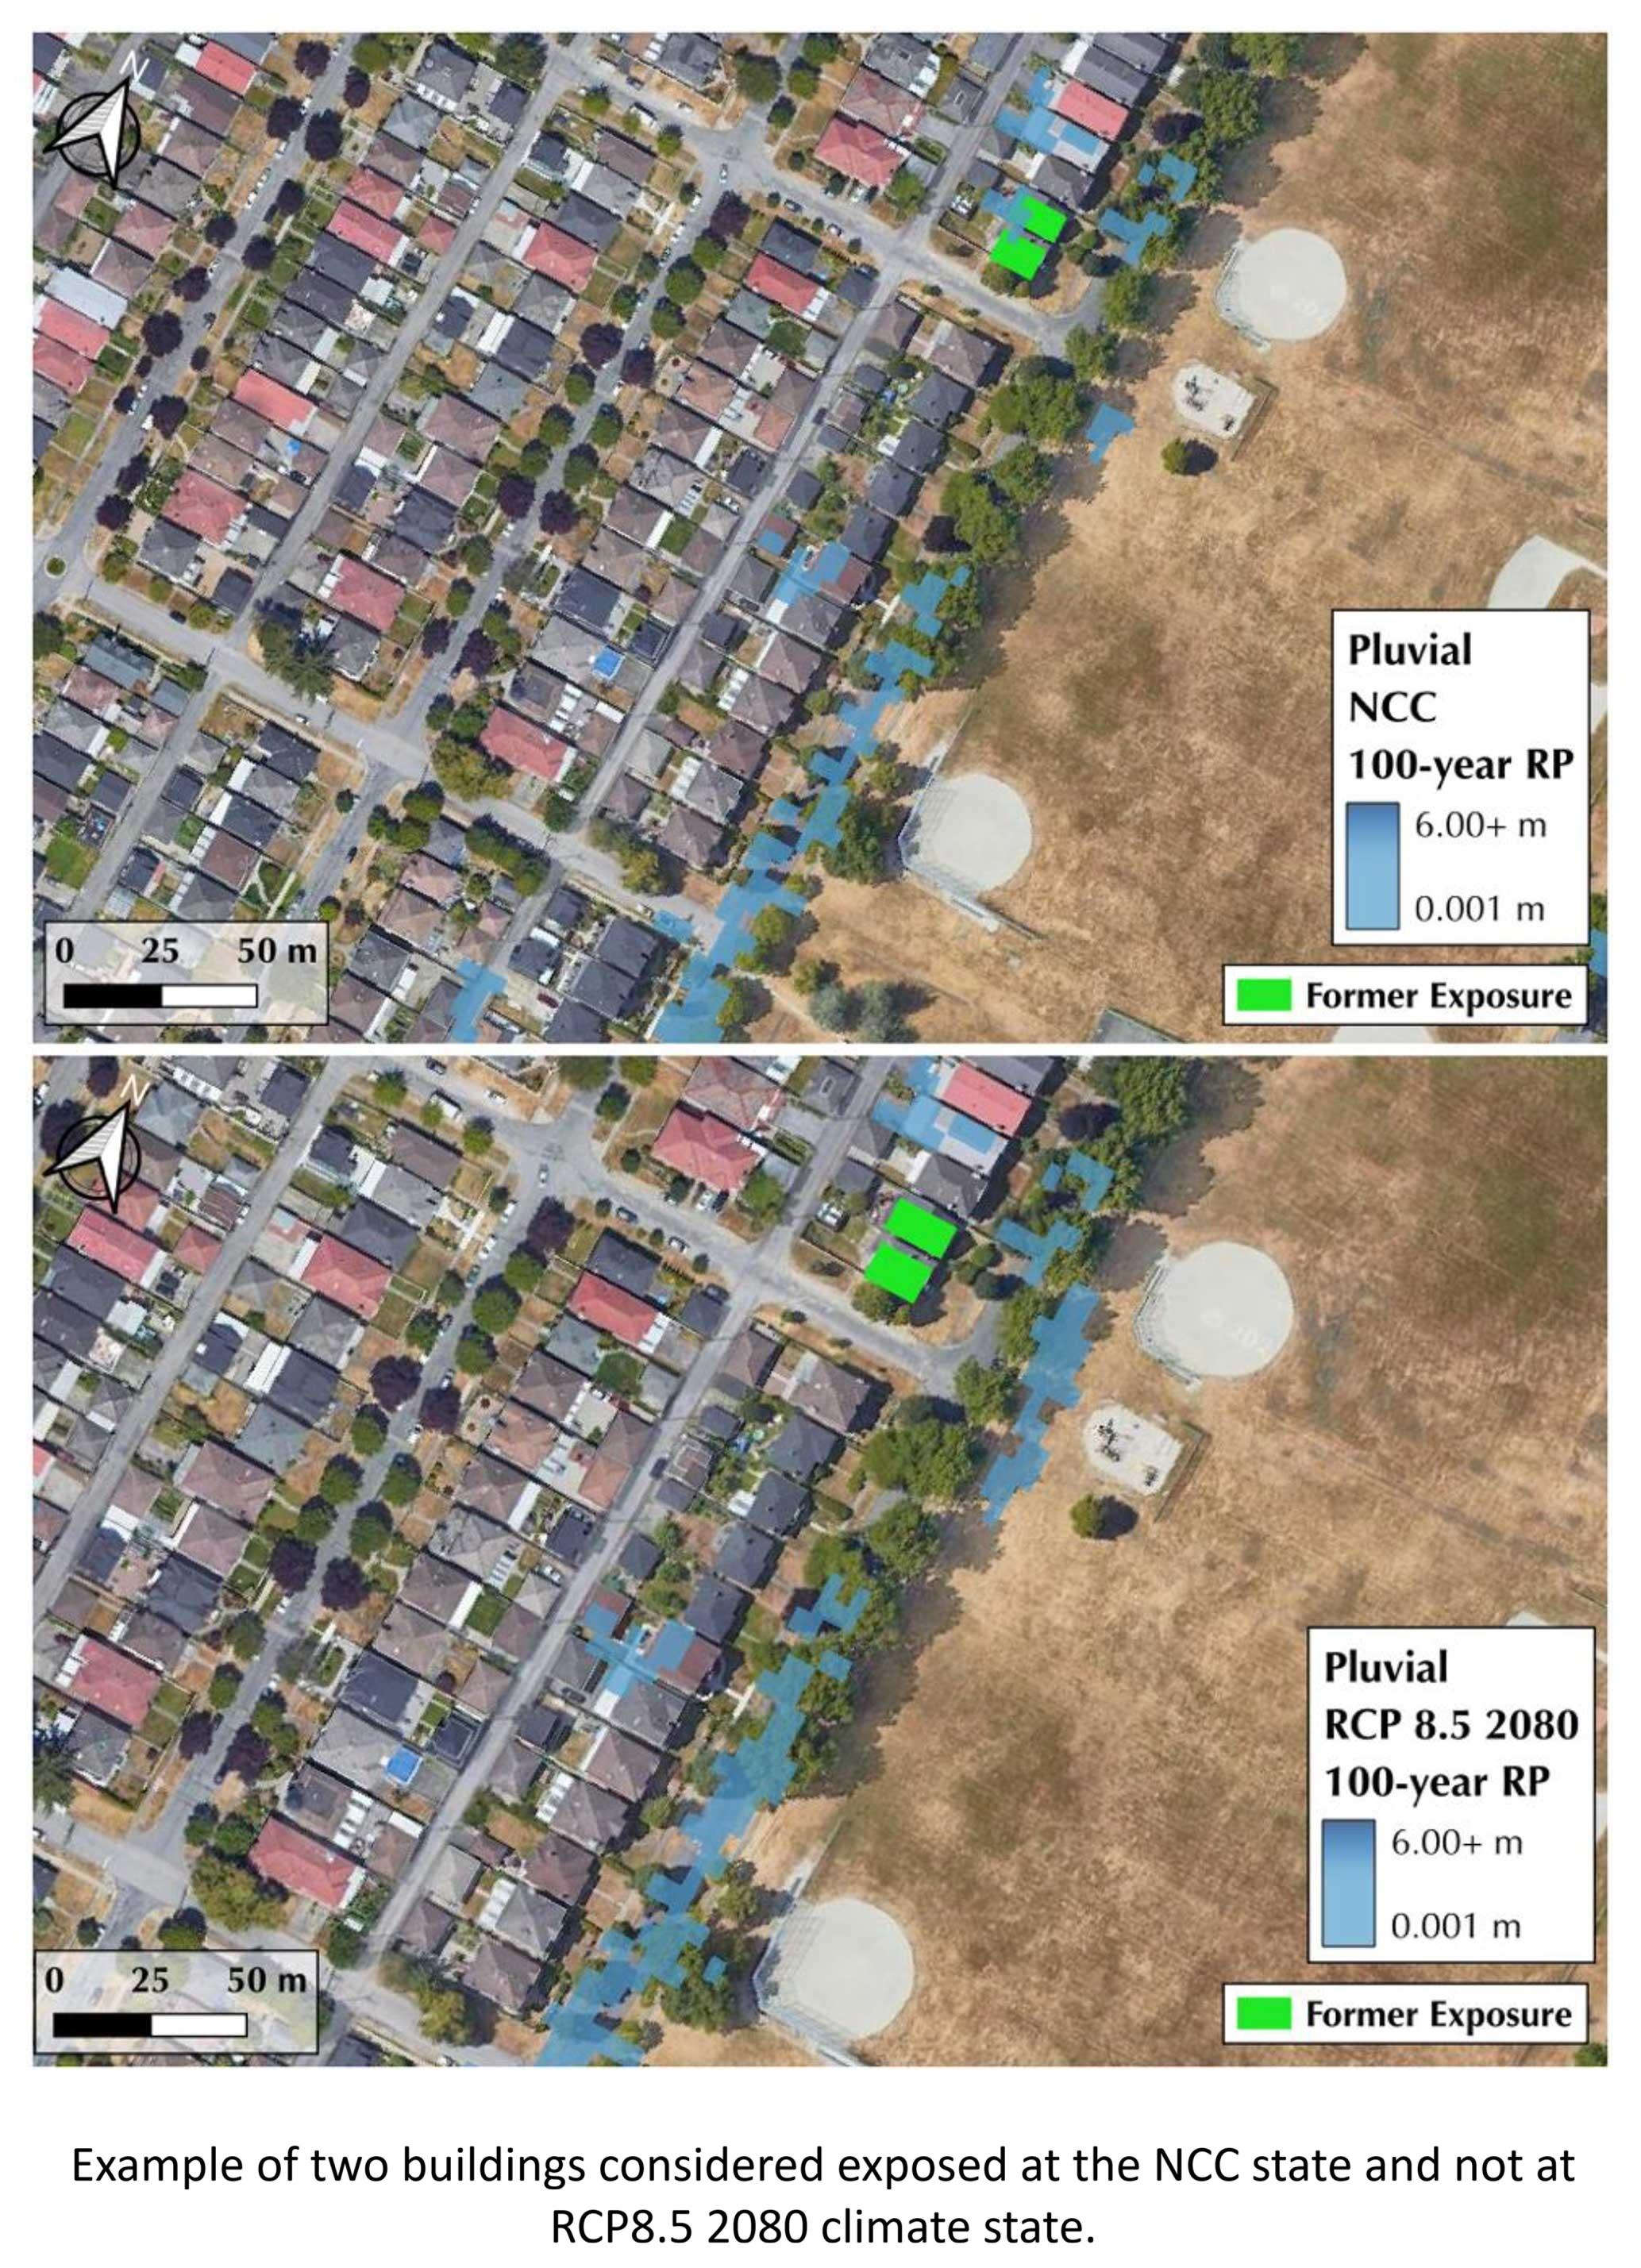
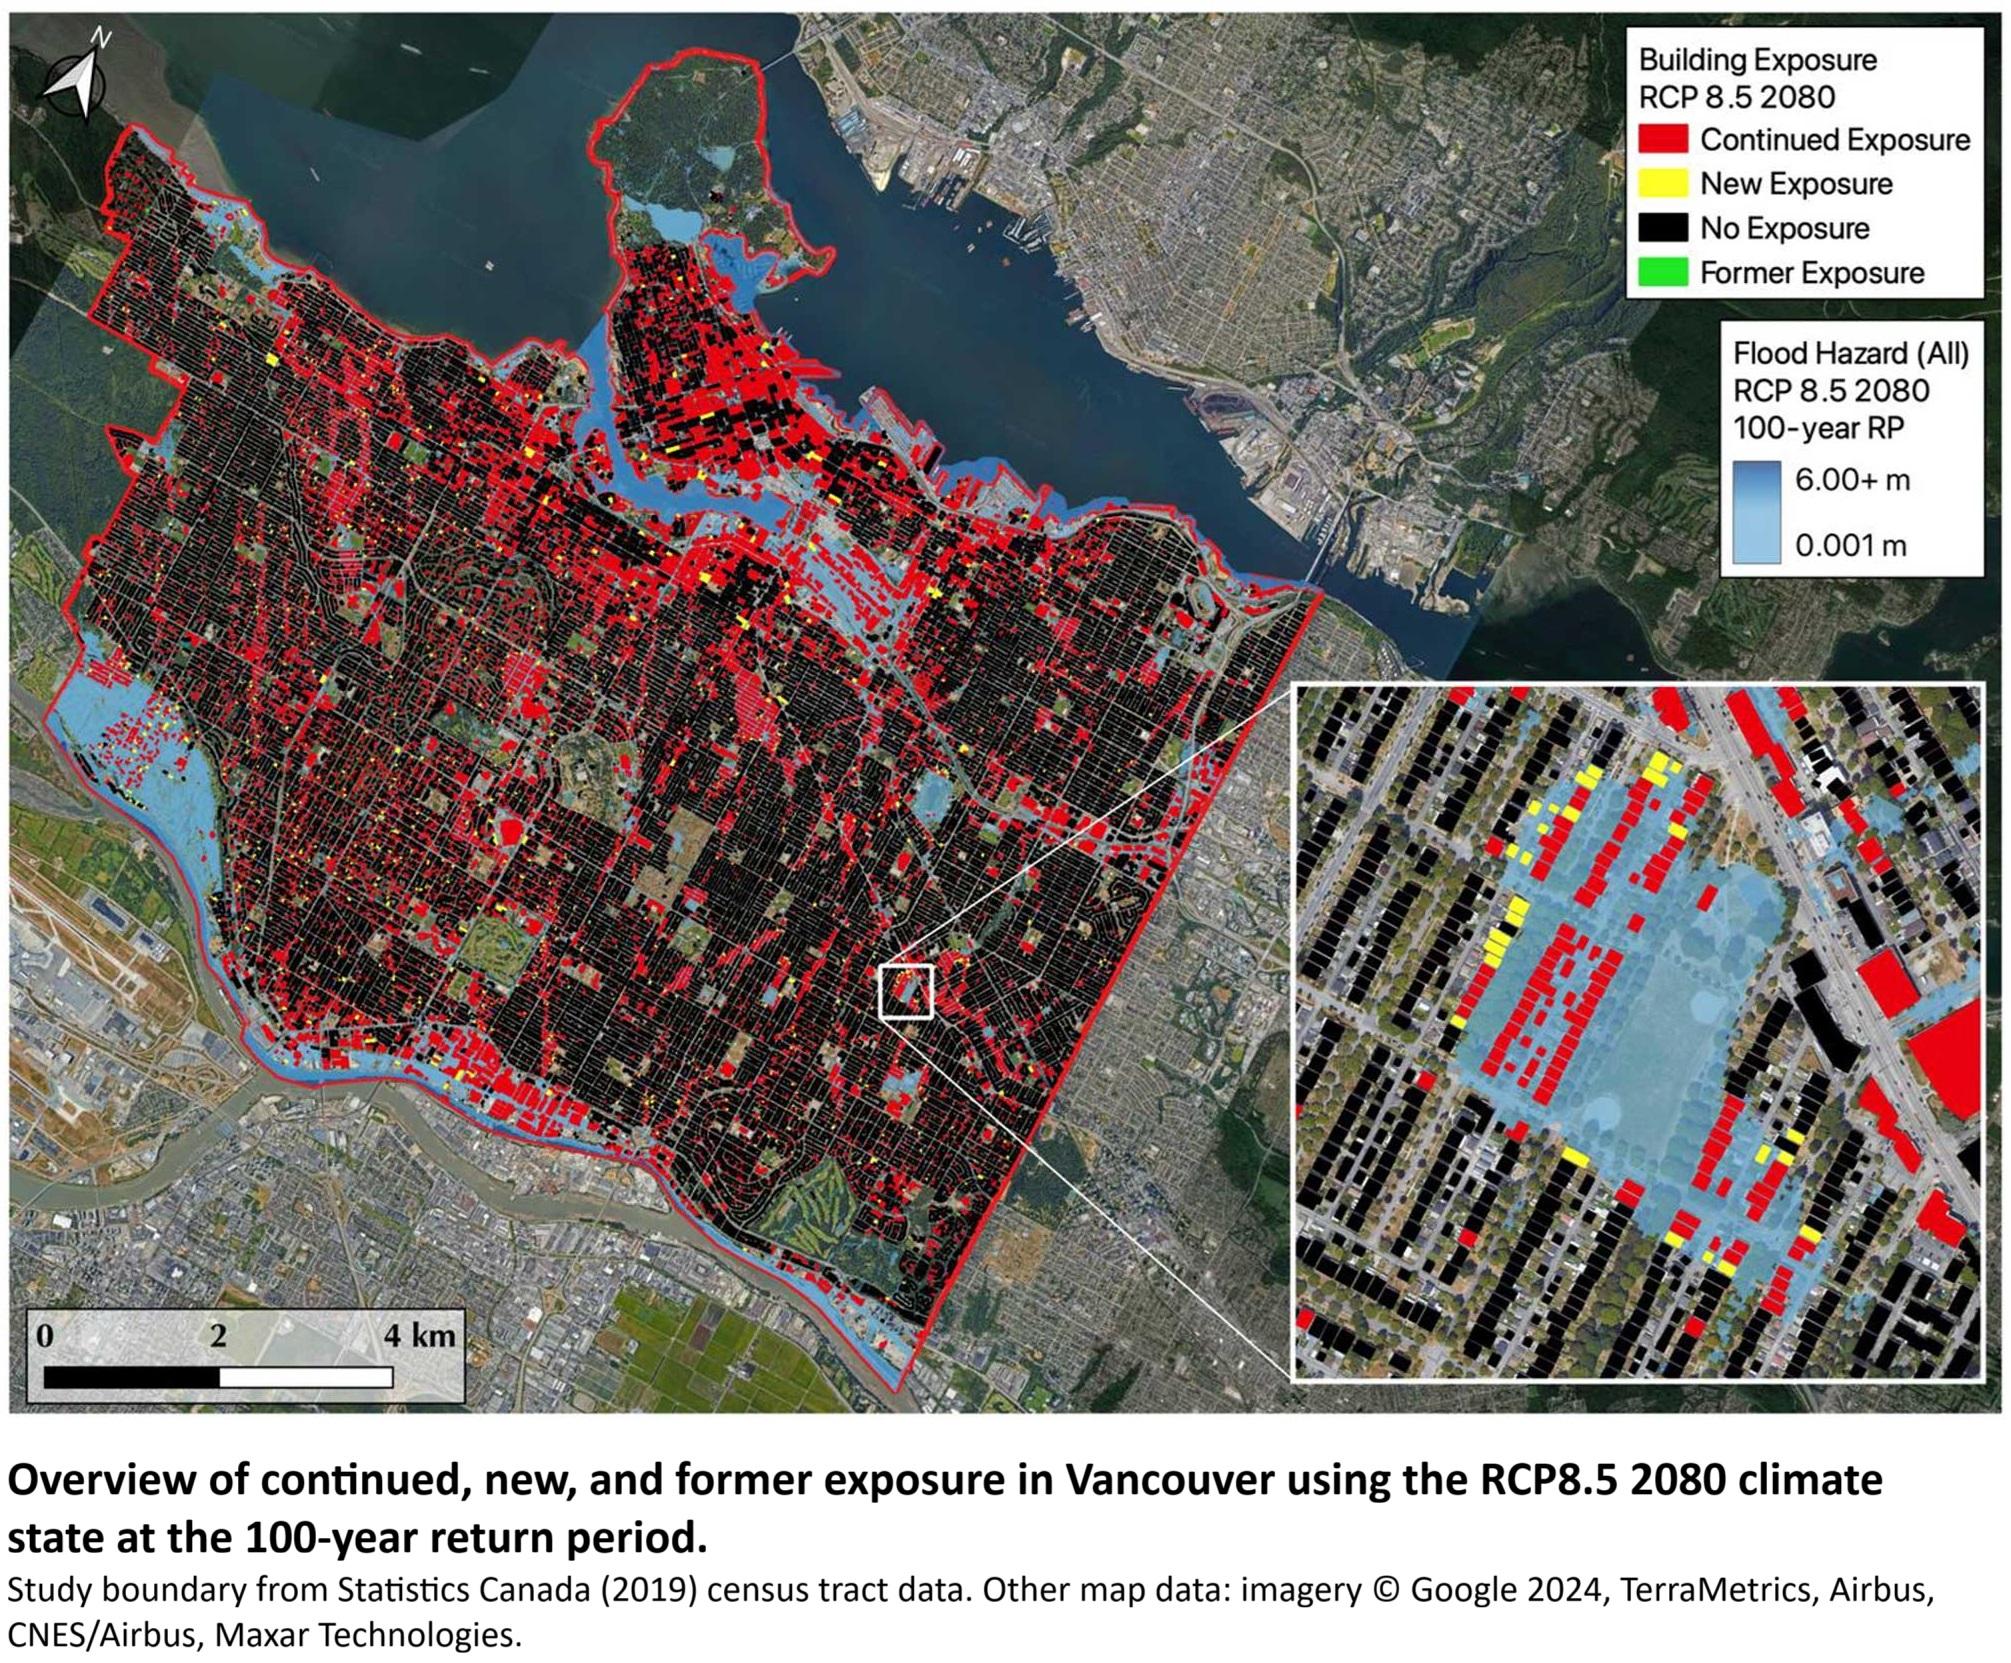
Mapping Current And Future Flood Exposure Using A 5 Metre Flood Model And Climate Change Projections [Vancouver, Canada]
--
https://nhess.copernicus.org/articles/24/699/2024/ <-- shared technical article
--
https://www.theguardian.com/environment/2021/nov/17/pacific-north-west-flooding-british-columbia-washington-state-canada <-- shared 2021 technical media article, PNW flooding
--
[this post should not be considered an endorsement of a specific vendor, etc]
#water #hydrology #flood #flooding #risk #hazard #Vancouver #BritishColumbia #Canada #climatechange #extremeweather #localfloods #GIS #spatial #mapping #riskassessment #spatialanalysis #floodexposure #riskmapping #model #modeling #floodriskmanagement #riskmanagement #naturaldisaster #rainfall #precipitation #stormsurge #hazardmapping #floodmapping #floodrisk #infrastructure #cost #economics #fluvial #pluvial #geomorphology #elevation #geomorphometry #regulatory #regulations #spatiotemporal

I try to keep my results accessible even for readers who aren’t familiar with digital mapping or GIS.
One simple technique is to complement classification maps with clear charts and tables showing how much area each class occupies.
Here’s an example: the total surface area of geomorphon classes within the study region.
There’s also a small but important detail that often gets overlooked: the order of classes in the chart should match the order used in tables and map legends.
This tiny consistency makes it much easier for readers to orient themselves and follow the logic of the analysis.
#GIS #Geomorphometry #DataViz #OpenScience #RStats #terra #QGIS #InhuletsRiver #ggplot2 #SAGA #FOSS
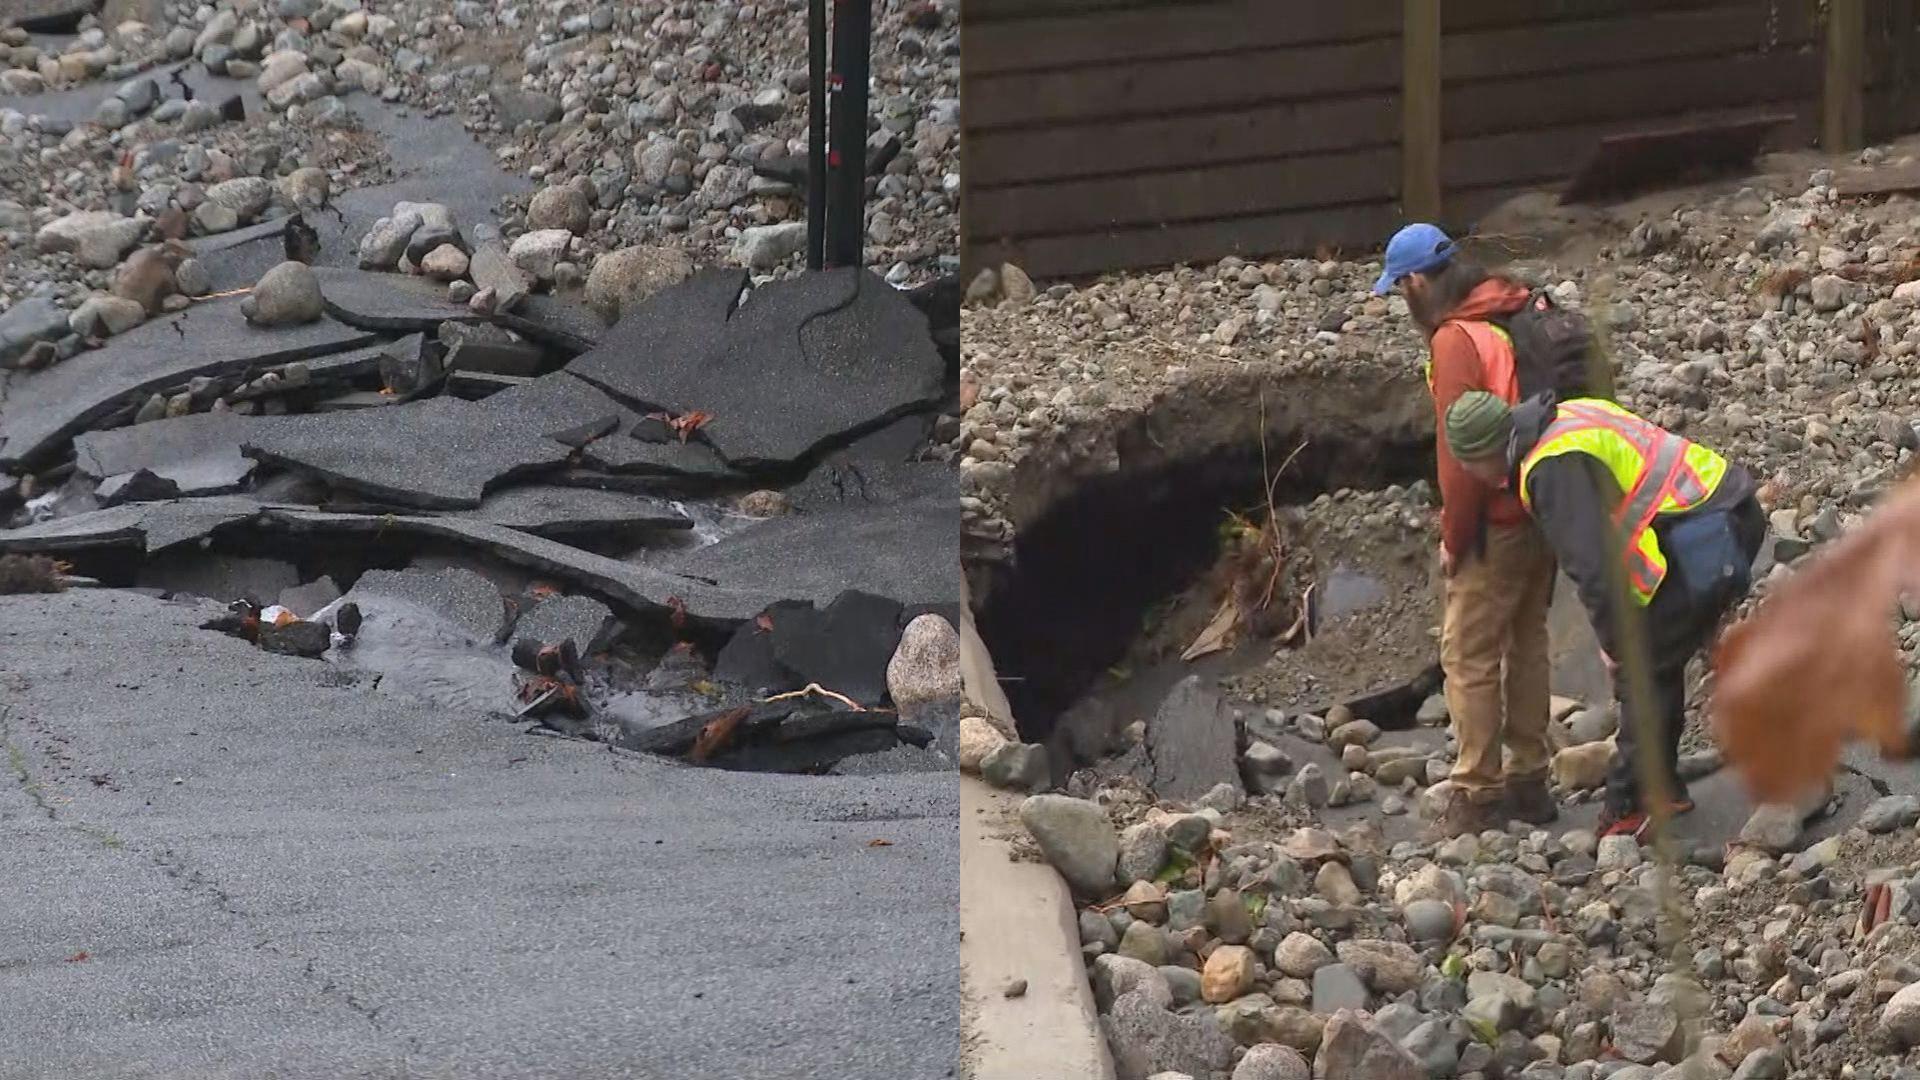
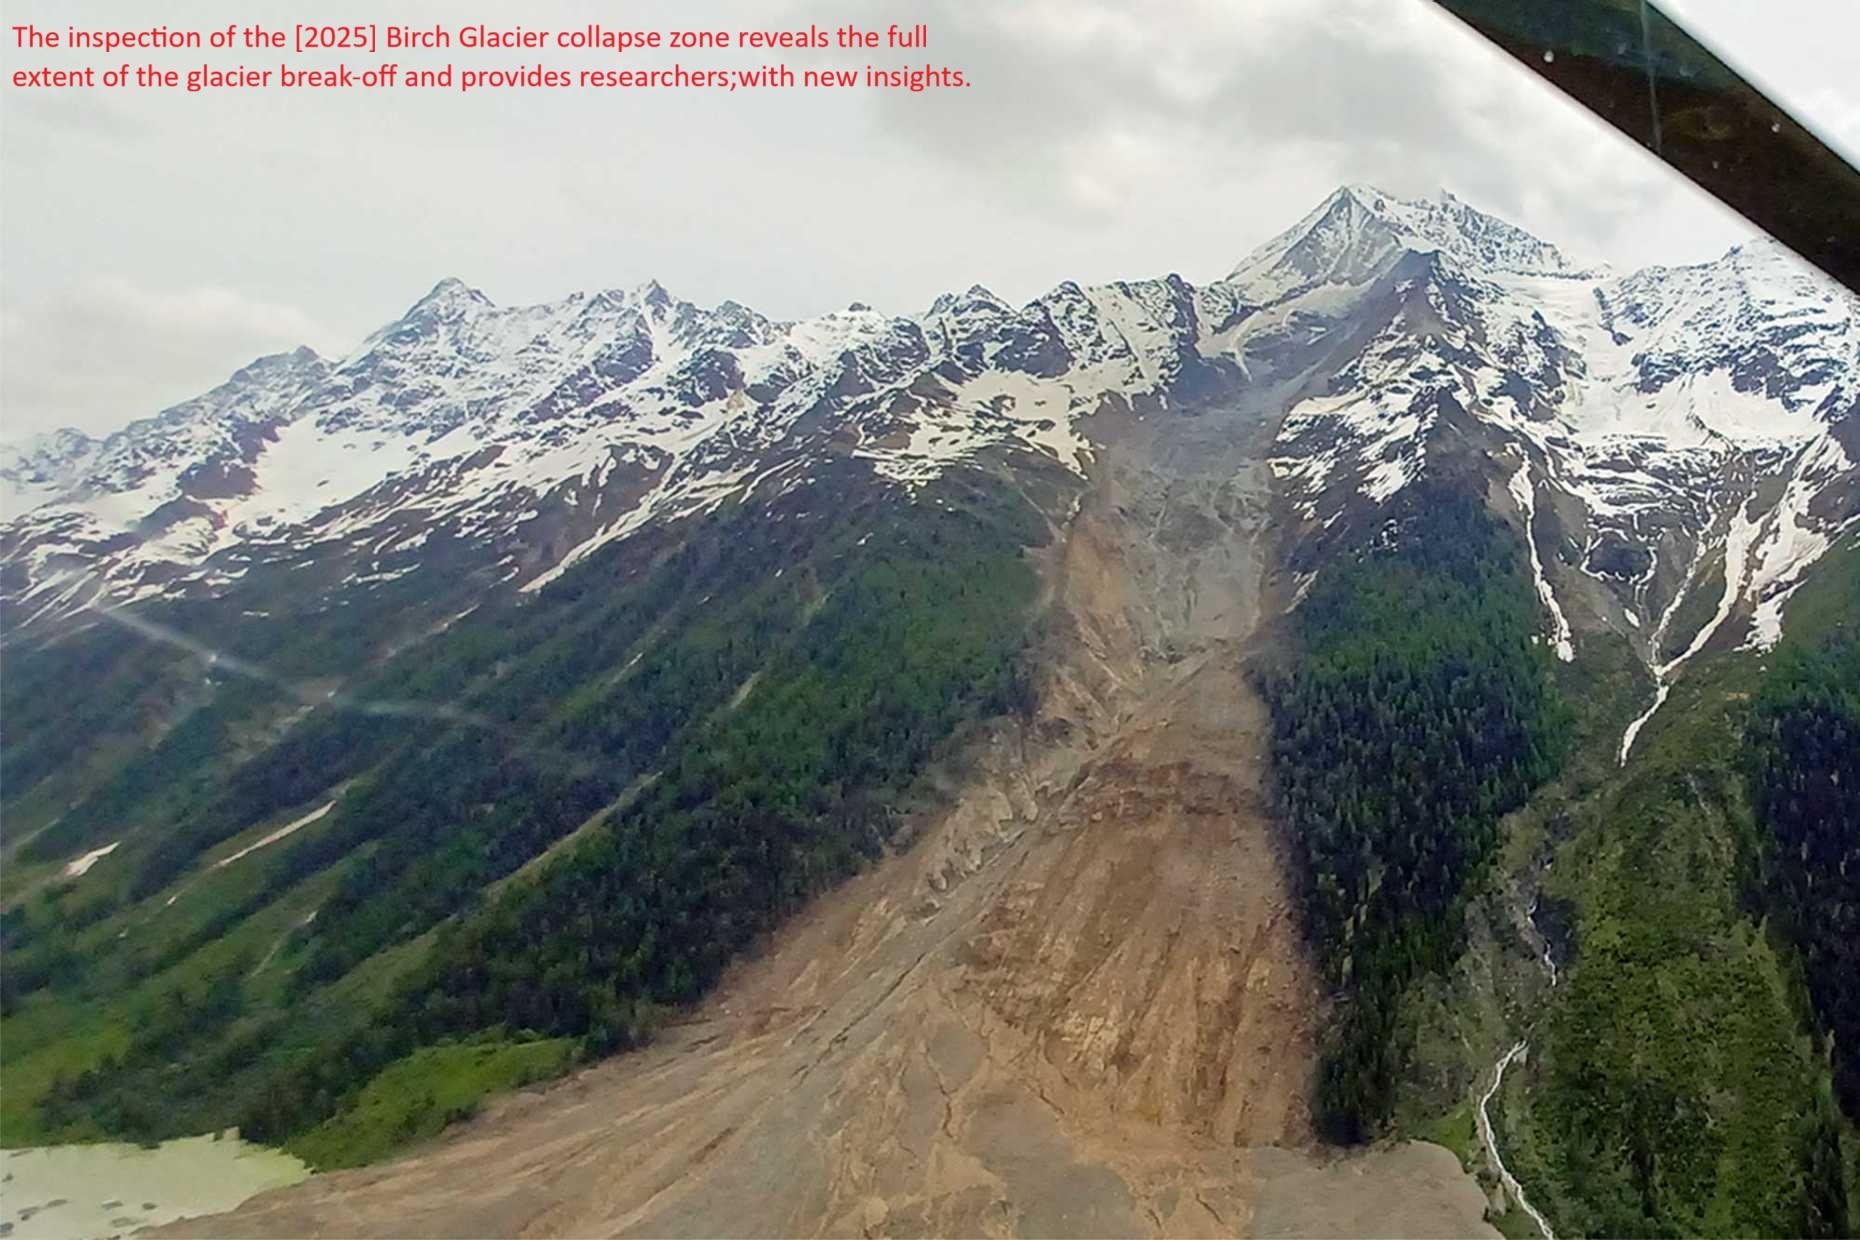
Rethinking Policy On High Mountain Cascading Hazards
--
https://doi.org/10.1038/s41561-025-01834-w <-- shared technical correspondence
--
https://ethz.ch/en/news-and-events/eth-news/news/2025/05/what-eth-glacier-researchers-know-about-the-collapse-of-the-birchgletscher-glacier.html <-- shared technical article, “What ETH glacier researchers know about the collapse of the Birch Glacier”
--
#cryosphericscience #geomorphology #geomorphometry #engineeringeology #hydrology #naturalhazards #planning #mitigation #risk #hazard #policy #massmovement #risk #hazard #change #infrastructure #flood #flooding #damage #cost #geology #massmovement #naturalhazards #disaster #snow #ice #glacier #melting #climate #warmer #BirchGlacier #Switzerland #avalanche #Blatten #Nepal #SetiKohla #publicsafety #warning #GLOF #Chamoli #India #Sedongpu #Tibet #cascading #water #hydrology #slope #landslide #global


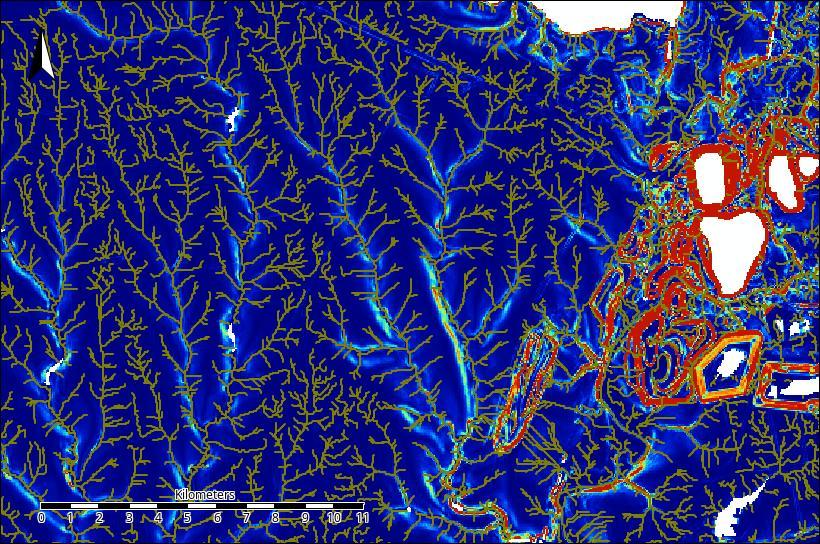
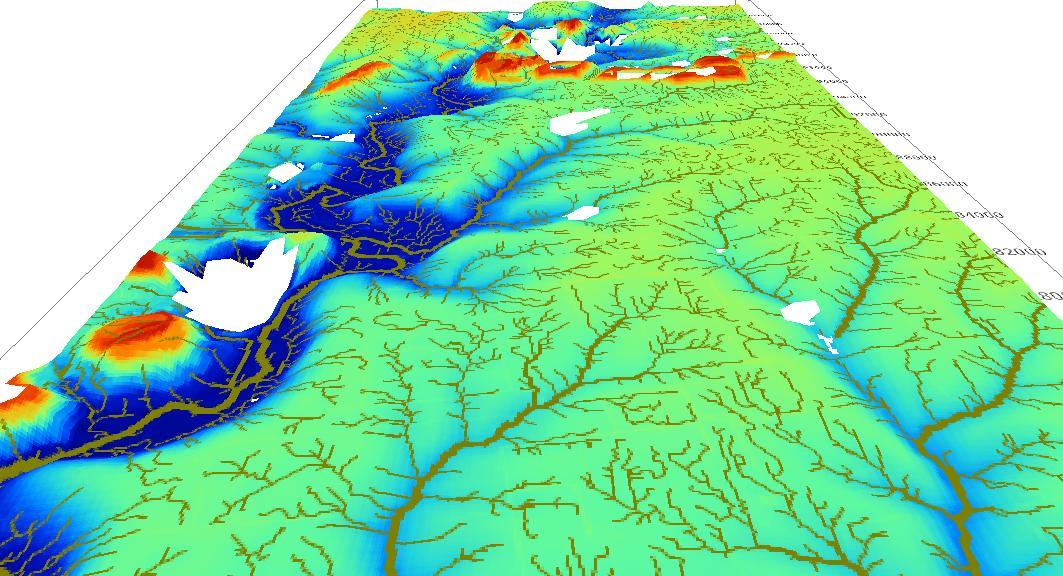
🌊 Hydrological patterns in the Inhulets River Basin
I’m working on a large-scale study of the technogenic impact on the Inhulets River system (Ukraine).
The workflow combines R + SAGA GIS + QGIS for geomorphometric and hydrological analysis.
Over the past week, I’ve been refining digital elevation models and tracing surface runoff connectivity — not an easy task in a region reshaped by century of mining.
The map below shows one of the calmest and most “well-behaved” areas, far from the mining zone.
As for the drainage network over the mining areas… let’s just say it’s geological chaos down there 😄
🛰️ Data: Copernicus DEM (GLO-30)
🧭 Tools: SAGA GIS (Terrain Analysis), R, QGIS
#Hydrology #Geomorphometry #SAGAGIS #QGIS #RStats #DEM #GIScience #EnvironmentalModeling #MiningImpact #Geodata #InhuletsRiver #Ukraine #KryvyiRih #Copernicus #CopernicusDem
Over the past few days, I’ve been refining a detailed hydrological model for the Inhulets River basin (Ukraine).
The goal is to reconstruct real surface-flow connectivity in a region with both natural and technogenic relief — open-pit mines, tailings ponds, subsidence zones, and artificial drainage structures.
The work is part of a larger multi-year study on the geochemical and hydrological evolution of the Kryvyi Rih Iron Ore Basin.
(attached: 3D terrain visualization)
#Hydrology #Geomorphometry #opensourcegis #InhuletsRiver #SagaGis

From fields to surface-specific points, geomorphons, and networks: David O’Sullivan’s latest post in his “GIS, a Transformational Approach” series explores how geospatial data transitions between continuous #fields and discrete forms like #points, #lines, and #areas. Using #geomorphometry concepts such as...
https://spatialists.ch/posts/2025/10/25-from-fields-to-surface-specific-points-geomorphons-and-networks/ #GIS #GISchat #geospatial #SwissGIS
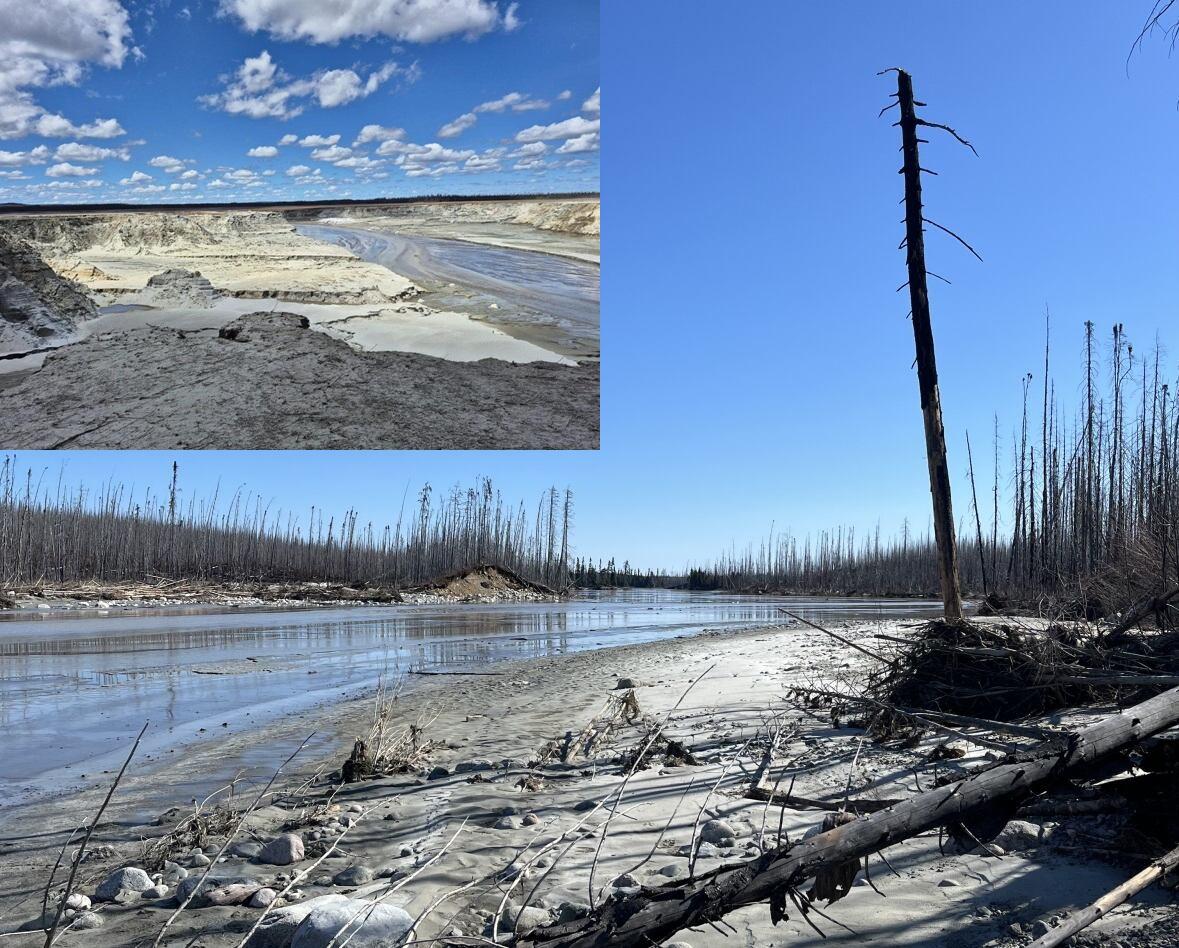
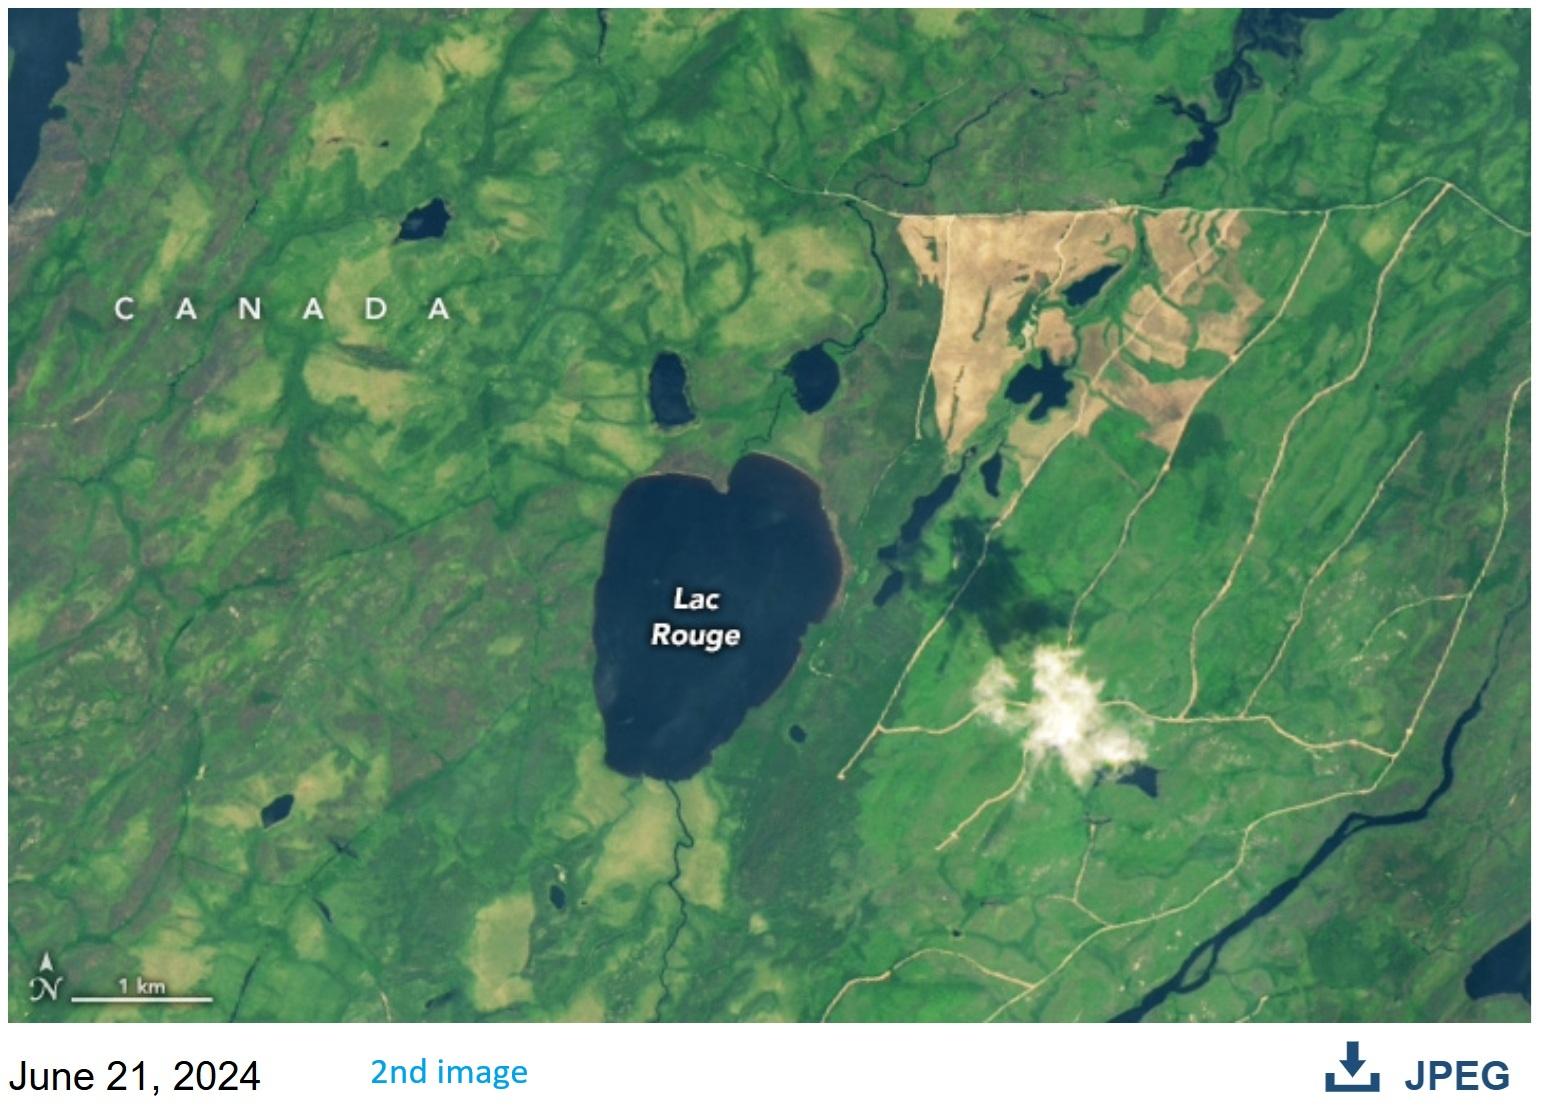
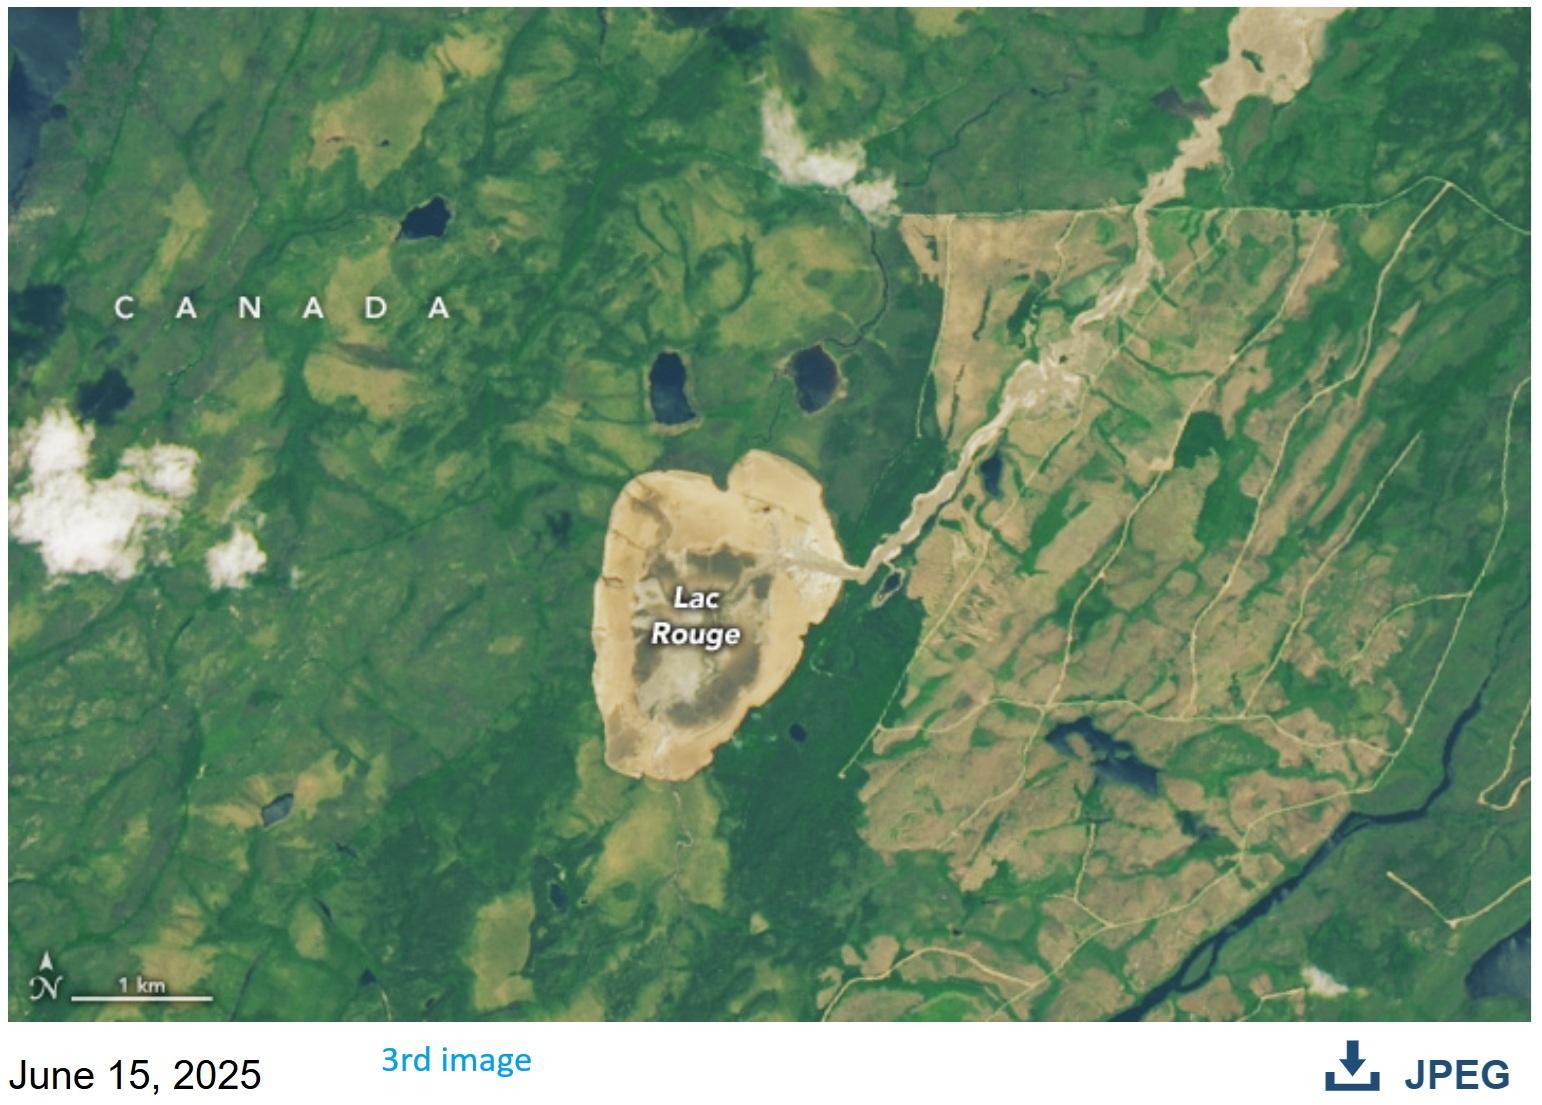
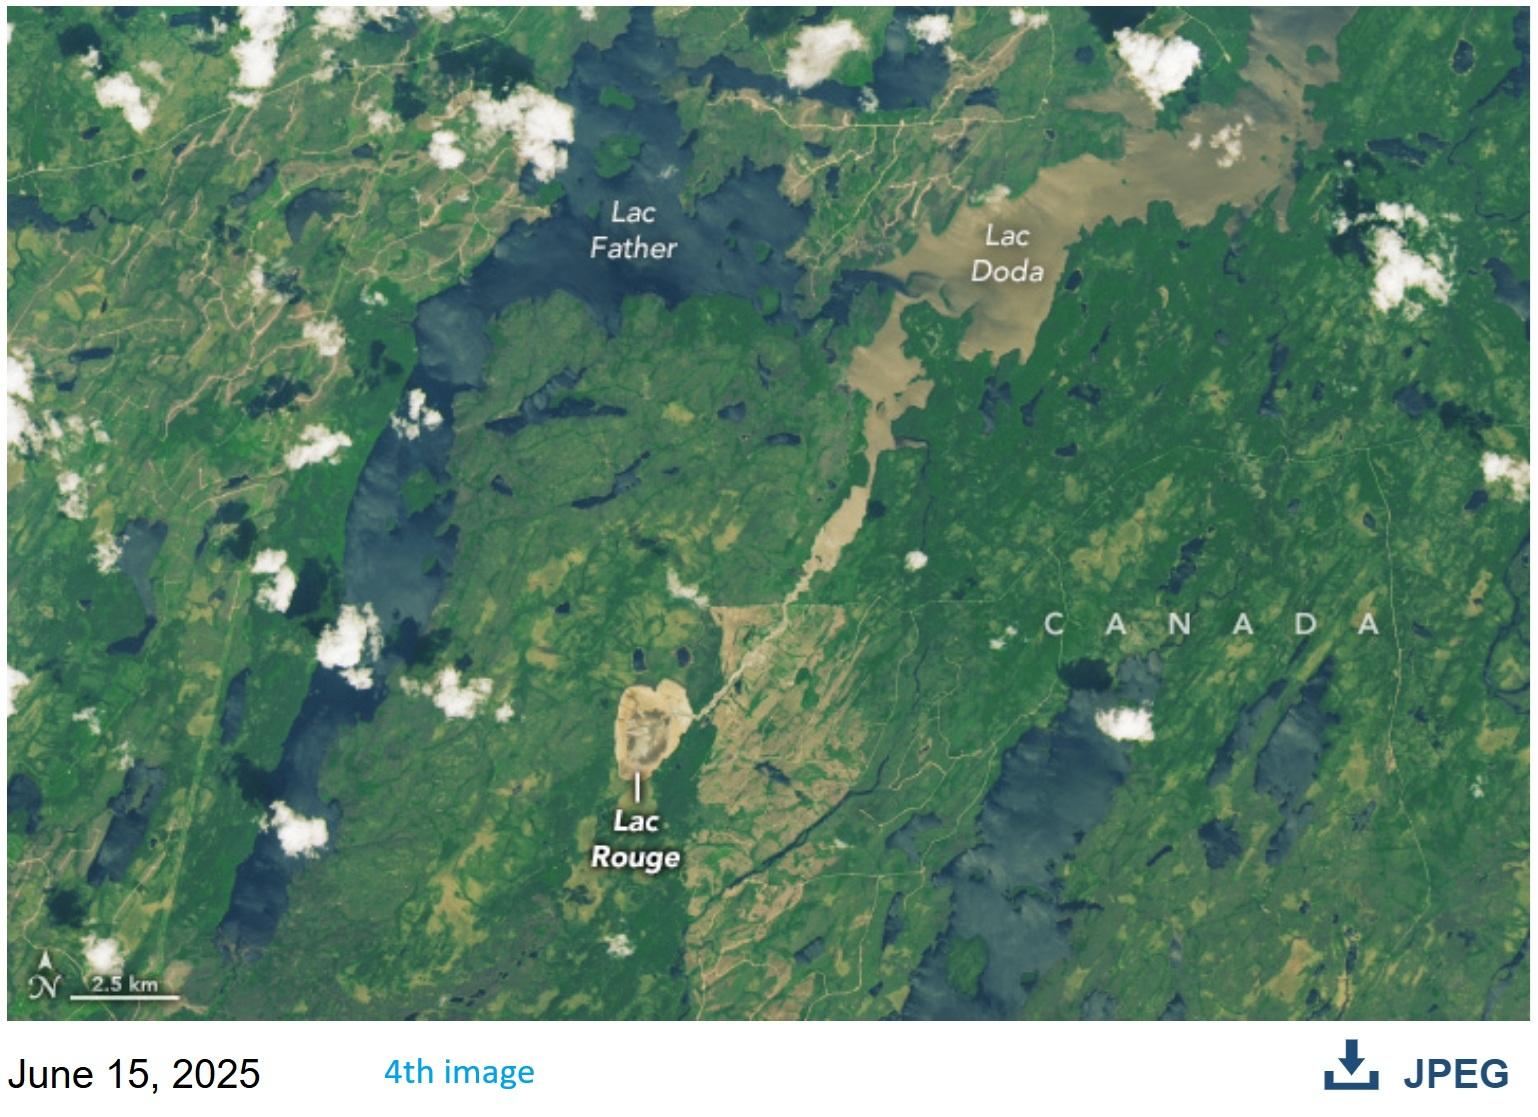
The Disappearance of Lac [Lake] Rouge [remote sensing]
--
https://www.earthobservatory.nasa.gov/images/154526/the-disappearance-of-lac-rouge <-- Shared NASA Earth Observatory Images Of The Day
--
https://www.cbc.ca/news/canada/north/lake-drainage-land-collapse-waswanipi-lake-rouge-lake-doda-1.7539994 <-- shared media article
--
“A landscape in central Quebec transformed suddenly in spring 2025 when a lake burst its banks and drained. Members of the nearby community of Waswanipi who use the area for hunting, fishing, and trapping learned of the curious incident in early May, after reports of a washed-out road. Further air- and ground-based investigations revealed that land around the lake had collapsed and that Lac Rouge had emptied..."
#GIS #spatial #mapping #spatiotemporal #water #hydrology #lake #LacRouge #Quebec #Canada #Waswanipi #Cree #FirstNation #wildfire #geomorphometry #outflow #OLI2 #Landsat #Landsat9 #earthobservation #remotesensing #wildlife #habitat #change #ecology #sediment # #snowmelt #rainfall
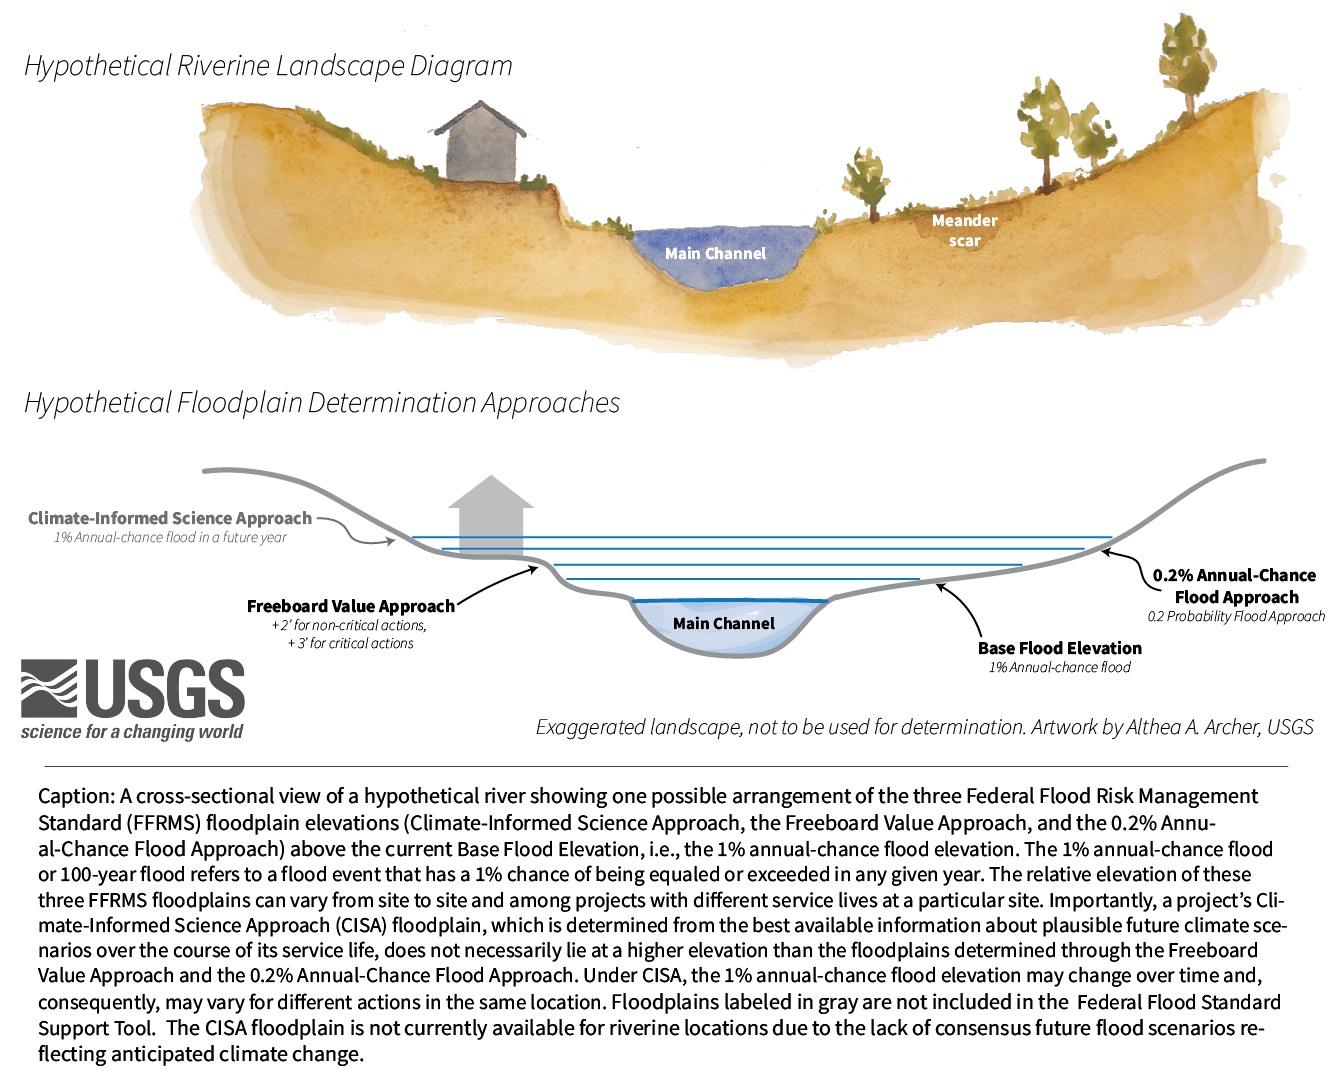
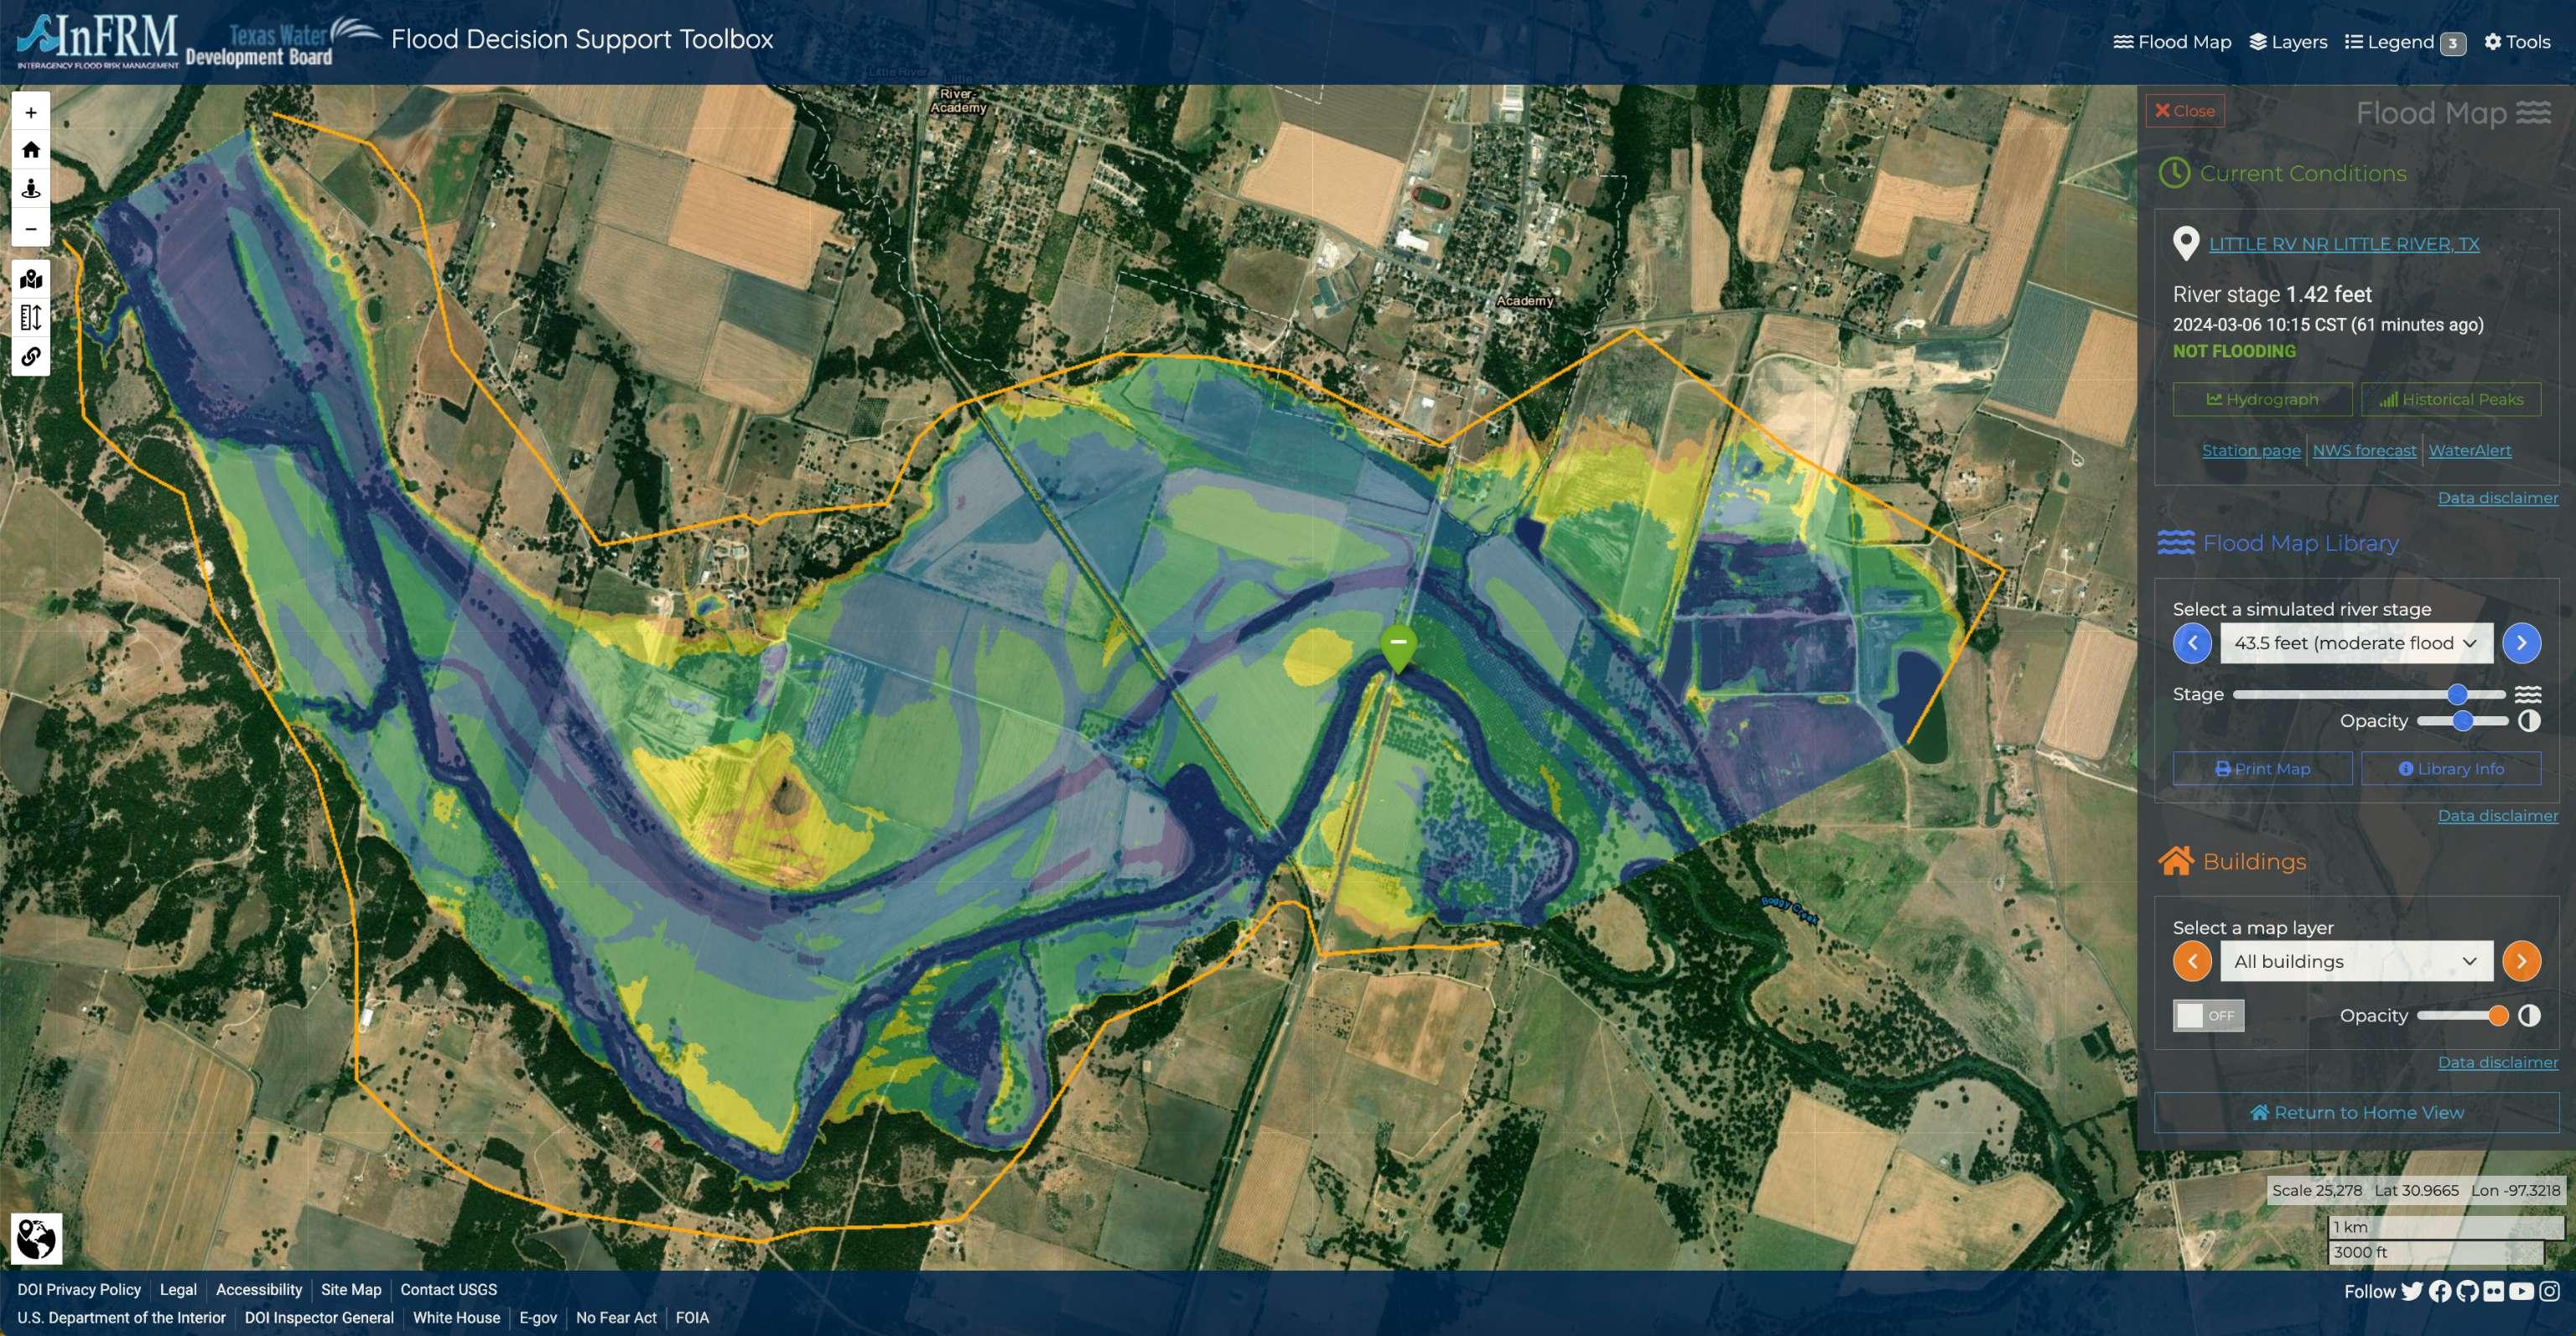
Floodplain Mapping - An Age-Old Practice Updated For Today's Flooding Events
--
https://woolpert.com/news/blogs/floodplain-mapping-an-age-old-practice-updated-for-todays-flooding-events/ <-- shared technical blog post
--
[this post should not be considered an endorsement of this specific vendor, rather sharing an informative technical article]
#GIS #spatial #mapping #opendata #model #modeling #flood #floodplain #flooding #3DHP #NHD #remotesensing #LiDAR #risk #hazard #water #hydrology #geohazard #river #terrace #elevation #climatechange #extremeweather #photogrammetry #property #infrastructure #mitigation #engineering #event #agriculture #storm #rainfall #precipitation #regulations #design #construction #seasonal #damage #cost #economics #cropland #lowlands #data #topography #geomorphology #geomorphometry
@USGS @NOAA @nws
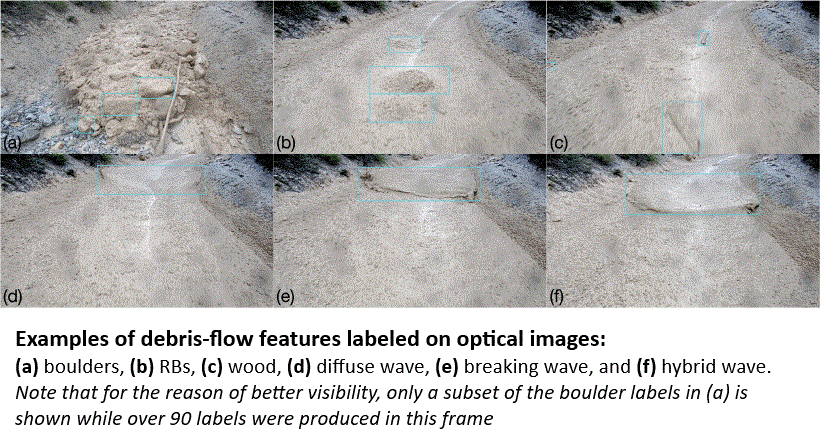
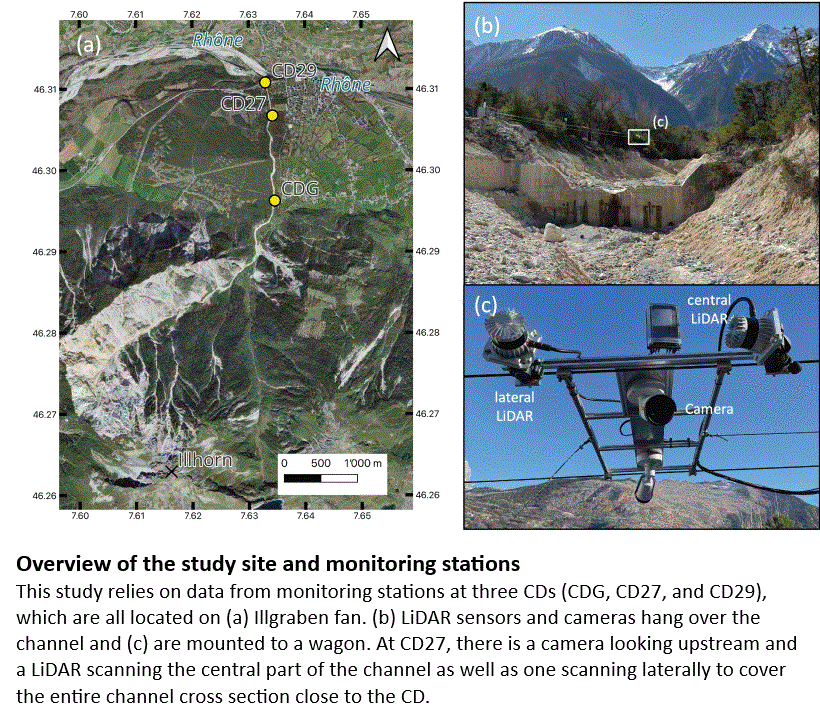
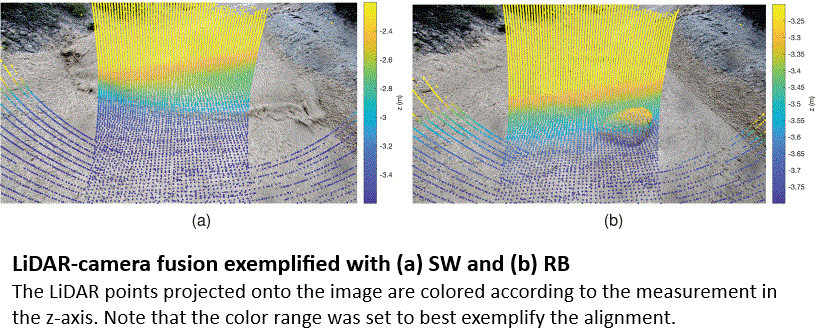
Deep-Learning-Based Object Detection And Tracking Of Debris Flows In 3D Through Lidar-Camera Fusion
--
https://doi.org/10.1109/TGRS.2025.3609573 <-- shared paper
--
[As an engineering geologist, I have been fortunate enough (sic) to see debris flows in action (indeed, I was rerouted on the motorcycle because of them) on the Poudre Canyon Road in Colorado, after the 2020 Cameron Peak Fire]
#GIS #spatial #mapping #debrisflow #geology #engineeringgeology #geology #massmovement #postfire #wildfire #water #sediment #hydrology #extremeweather #model #modeling #AI #deepleaning #algorithms #objectdection #monitoring #remotesensing #LiDAR #pointcloud #landform #geomorphometry #video #massmovement #risk #hazard #assessment #damage #infrastructure #rock #boulder #cost #economics #realtime #3D #wave #flow #dynamics
Development Of An Optimized Survey Workflow For Sandy Beaches With Mapping-Grade Mobile LIDAR
--
https://doi.org/10.2112/JCOASTRES-D-24-00056.1 <-- shared paper
--
#GIS #spatial #mapping #beach #sandy #coast #coastal #corridor #surveying #remotesensing #LiDAR #workflow #calibration #HiWayMapper #vehicle #UTV #4wd dataprocessing #postprocessing #GNSS #navigation #imagery #pointcloud #dunes #foredunes #geomorphology #geomorphometry #rmse #error #accuracy #precision #evaluation #metrics #shoreline #seasonal #dynamics #marine #waves #erosion #deposition
[USGS] FORT Science In Action – Science In Support Of Invasive Reptile Management In The Greater Everglades
--
https://www.usgs.gov/centers/fort-collins-science-center/news/fort-science-action-part-7-science-support-invasive <-- shared technical article
--
#remotesensing #florida #everglades #restoration #burmese #python #snake constrictor #impacts #invasive #species #reptiles #loss #mammal #tegus #ecosystems #habitat #plants #vertebrate #carnivore #feral #threatened #research #culling #risk #hazard #threat #AI #imagery #UAS #GIS #spatial #mapping #DNA #sampling #surveillance #cost #ecology #damage #trapping #collaboration #scaleable #control #biocontrol #fedscience #fedservice #management #protection #swamp #wetland #grasslands #geomorphology #geomorphometry #water #hydrology #native #species #USGS #NPS
@USGS @NPS


Researchers Shed Light On River Resiliency To Flooding
--
https://sciencedaily.com/releases/2024/02/240215113712.htm <-- shared technical article
--
https://doi.org/10.1073/pnas.2307065121 <-- shared paper
--
#model #modeling #spatiotemporal #water #hydrology #river #resilience #ecosystem #flood #flooding #remotesensing #monitoring #oxygen #sensor #growth #aquatic #plants #vegetation #algae #biomass #recovery #health #wildlife #fish #fishery #flow #sustenance #freshwater #management #controlled #autotrophic #geomorphology #geomorphometry #flow


Geologists Got It Wrong - Rivers Didn’t Need Plants To Meander
--
https://sciencedaily.com/releases/2025/08/250831010533.htm <-- shared technical article
--
https://doi.org/10.1126/science.adv4939 <-- shared paper
--
#water #hydrology #hydrographic #river #meanders #meandering #sediment #vegetation #geomorphology #geomorphometry #geoscience #geology #riverdynamics #sinuosity #geometry #GIS #spatial #mapping #remotesensing #earthobservation #spatialanalyis #spatiotemporal #bank #pointbar #flow #stratigraphy #geologicrecord #braiding #biogeochemical #stabilised #banks #erosion #roots


Grand Canyon Landslide-Dam And Paleolake Triggered By The Meteor Crater Impact At 56 Ka
--
https://doi.org/10.1130/G53571.1
--
#geology #geologichistory #landslide #dam #grandcanyon #USA #paleolake #water #hydrology #meteor #crater #engineeringgeology #massmovement #Nankoweap #ColoradoRiver #earthquake #seismic #dating #radiocarbon #Pleistocene #sediments #fieldwork #elevation #geomorphology #geomorphometry


Floodplain Mapping - An Age-Old Practice Updated For Today's Flooding Events
--
https://woolpert.com/news/blogs/floodplain-mapping-an-age-old-practice-updated-for-todays-flooding-events/ <-- shared technical blog post
--
[this post should not be considered an endorsement of this specific vendor, rather sharing an informative technical article]
#GIS #spatial #mapping #opendata #model #modeling #flood #floodplain #flooding #3DHP #NHD #remotesensing #LiDAR #risk #hazard #water #hydrology #geohazard #river #terrace #elevation #climatechange #extremeweather #photogrammetry #property #infrastructure #mitigation #engineering #event #agriculture #storm #rainfall #precipitation #regulations #design #construction #seasonal #damage #cost #economics #cropland #lowlands #data #topography #geomorphology #geomorphometry
#USGS #NOAA #NWS


Aquatic Habitat Response To Small Dam Removal Demonstrates Recovery In Three Years
-
https://doi.org/10.1002/ecs2.70323
-
#water #hydrology #fish #migration #fisheries #waterquality #restoration #dam #removal #reconnecting #dams #species #aquatic #environment #protection #forested #watershed #recreation #education #fisheries #wildlife #biodiversity #barrier #species #mobility #habitat #aquatic #natural #river #stream #connectivity #fishpassage #ecology #geomorphology #geomorphometry #monitoring #stakeholders #ShappPondDam #WappingerCreek #DutchessCounty #recovery #HudsonRiverEstuary #NewYorkState #USA #impoundment #downstream #upstream #sediment #sedimentation #macroinvertebrate #impact #assessment
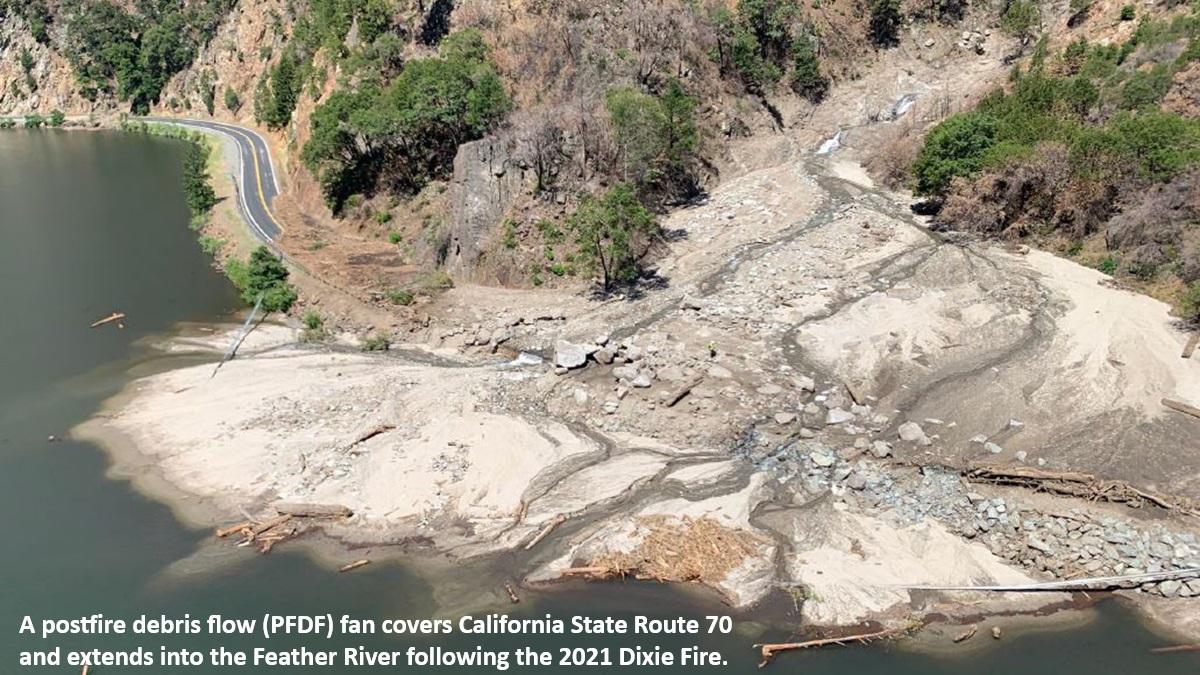
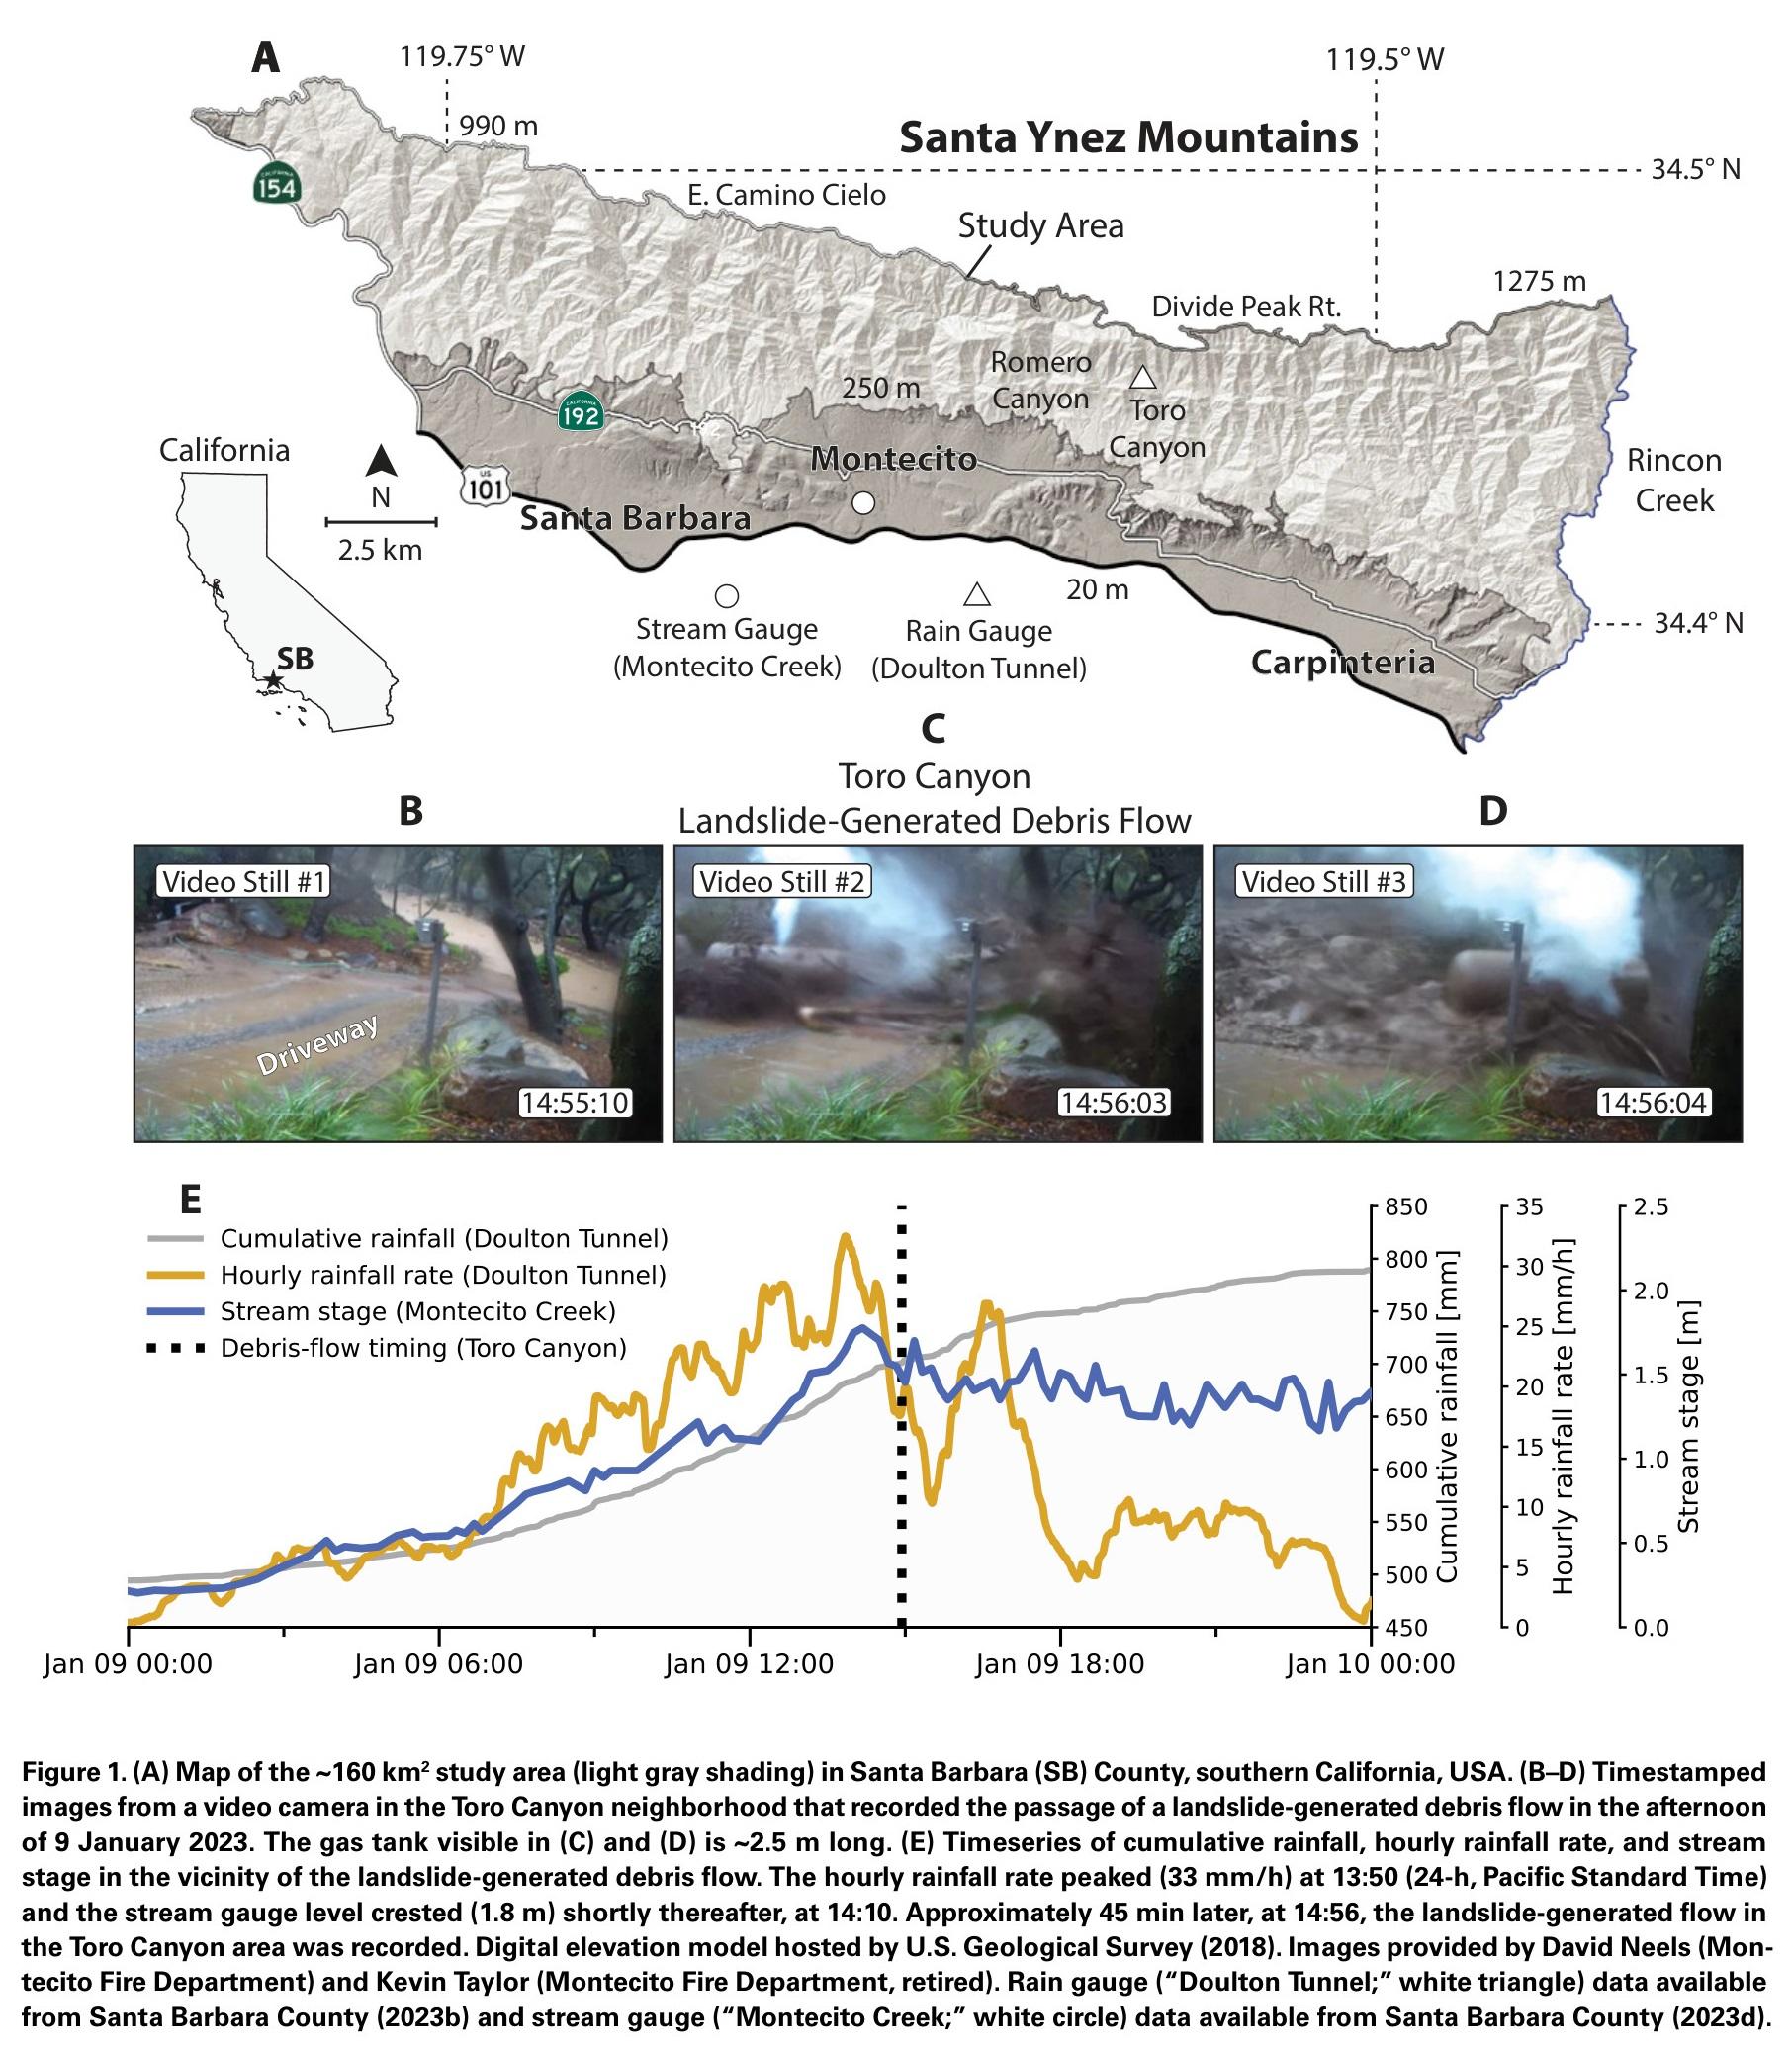
Landsliding Follows Signatures Of Wildfire History And Vegetation Regrowth In A Steep Coastal Shrubland
--
https://www.linkedin.com/posts/tmatthew_the-geoscience-community-is-finding-more-activity-7365791741355950080-VzES <-- shared LinkedIn post
--
https://pubs.geoscienceworld.org/gsa/geosphere/article/doi/10.1130/GES02856.1/660392/Landsliding-follows-signatures-of-wildfire-history <-- shared paper
---
#GIS #spatial #mapping #massmovement #debrisflow #debrisslide #California #USA #climatechange #extremeweather #fire #engineeringgeology #risk #hazard #geoscience #water #hydrology #rainfall #precipitation #wildfire #postwildfire #landslide #vegetation #cover #type #causality #coast #coastal #shrubland #model #modeling #atmosphericriver #storm #geomorphology #geomorphometry #SantaYnezMountains #imagery #remotesensing #delineation #downslope #sediment #damage #cost #economics #infrastructure #geology #regrowth #postfire
U.S. Geological Survey (USGS) USDA Forest Service California Geological Survey


Client Info
Server: https://mastodon.social
Version: 2025.07
Repository: https://github.com/cyevgeniy/lmst