
Slab Tearing Along A Subducted Oceanic Plate Joint Beneath The Alaska Peninsula
--
https://doi.org/10.1038/s41561-025-01749-6 <-- shared paper
--
#fault #faulting #subduction #slab #oceanic #plate #trench #Alaska #USA #geophysics #seismic #seismology #remotesensing #tomography #model #modeling #seismicity #volcano #vulcanism #Aniakchak #asthenosphere #geology #structuralgeology #mantle
#faulting


Landslide Influence On Delta Stratigraphy, Northeastern Gulf Of Mexico
--
https://doi.org/10.1130/GES02908.1 <-- shared paper
--
https://zenodo.org/records/15857064 <-- shared seismic reflection datasets
--
#spatial #mapping #marine #submarine #chanels #canyons #GulfOfMexico #delta #massmovement #landslide #submarinelandslide #remotesensing #geophysics #seismic #reflection #engineeringgeology #sediment #sedimentology #delta #stratigraphy #hydrology #deepwater #fault #faulting #glacioeustatic #erosion #model #modeling #scarp #masstransport #shelf #shelfmargin #geologicmapping


Unravelling The Dance Of Earthquakes - Evidence Of Partial Synchronization Of The Northern San Andreas Fault And Cascadia Megathrust
--
https://doi.org/10.1130/GES02857.1 <-- shared paper
--
“Previous paleoseismic work has suggested a possible stress triggering relationship between the Cascadia subduction zone and the northern San Andreas fault based on similar event timings. Turbidite successions correlated to both systems may support this hypothesis. Historic earthquakes in 1980 and 1992 in the Cascadia subduction zone and the 1906 earthquake on the northern San Andreas fault left turbidite records that are temporally well constrained by bomb-carbon−supported age-depth models..."
#geology #USWest #Seattle #Washington #California #earthquake #engineeringeology #fault #faulting #SanAndreas #Cascadiasubductionzone #linked #Cascadia #research #sediment #sedimentology #Turbidite #paleoseismology #historic #spatial #spatialanalysis #spatiotemporal #model #modeling #stress #subduction #dating #radiocarbon #Holocene


New Research Aims To Better Predict And Understand Cascading Land Surface Hazards
--
https://phys.org/news/2025-06-aims-cascading-surface-hazards.html <-- shared technical article
--
https://doi.org/10.1126/science.adp9559 <-- shared paper
--
#interconnected #geology #engineeringgeology #landcover #landsurface #GIS #spatial #mapping #landcover #hydrology #water #geomorphology # geomiorphmetry #risk #hazard #extremeweather #climatechange #cascading #cascadinghazards #debrisflow #wildfire #massmovement #landslides #flood #flooding #mudflow #susceptibility #chainreaction #spatialanalysis #spatiotemporal #prediction #management #planning #mitigation #multifactor #sediment #erosion #fluvial #earthquake #fault #faulting #hazardassessment #riskassessment #volcano #vulcanism #sealevelchange #cryosphere #ice #snow #GLOF #humanimpacts #urban #infrastructure #cost #economics #loss #damage #earthobservation #remotesensing #LiDAR #UAV


Non-Collisional Orogeny In Northeast Japan Driven By Nearby Same-Dip Double Subduction
--
https://doi.org/10.1038/s41561-025-01704-5 <-- shared paper
--
#geology #structuralgeology #japan #subduction #system #plate #geometry #mantle #tectonics #geodynamics #orogeny #Ryukyu #IzuBoninMarianas #kinematics #backarc #earthquake #fault #faulting #orogenesis #platetectonics


Increased Flood Exposure In The Pacific Northwest Following Earthquake-Driven Subsidence And Sea-Level Rise
--
https://doi.org/10.1073/pnas.2424659122 <-- shared paper
--
https://oregoncapitalchronicle.com/2025/05/02/big-one-coupled-with-rising-ocean-could-leave-many-in-northwest-living-in-flood-zones-study-finds/ <-- shared media article
--
#GIS #spatial #mapping #coast #coastal #sealevelrise #sealevel #SLR #climatechange #PNW #PacificNorthWest #Cascadia #flood #flooding #risk #hazard #exposure #damage #infrastructure #publicsafety #geology #fault #faulting #engineeringgeology #subsidence #earthquake #floodplains #omgoing #spatialanalysis #model #deformation #modeling #roads #residents ##Washington #Oregon #California #subduction #communities #management #planning #mitigation #coastalengineering #sinking


Multispectral Remote Sensing Expression of Lineaments and Alteration Minerals in Part of Crystalline Rock Units of Southwestern Nigeria - Implication on Gold Prospecting
--
https://doi.org/10.1016/j.oreoa.2025.100091 <-- shared paper
--
#GIS #spatial #mapping #ASTER #Gold #Hydrothermal #HydrothermalAlteration #Lineament #Landsat #ETM #EnhancedThematicMapper #phyllic #Ilesha #schist #belt #geology #mining #Nigeria #naturalresources #mineral #mineralresources #golddeposits #aerogeophysical #remotesensing #geophysical #spatialanalysis #geomorphology #geomorphometry #alteration #propylitic #argillic #mineralogy #XRD #structuralgeology #lithology #PrincipalComponentAnalysis #PCA #prospecting #fracture #joints #faulting #Multispectral #Lineaments #Crystalline


Deep Beneath California's Sierra Nevada, Earth's Lithosphere May Be Peeling Away
--
https://phys.org/news/2025-01-deep-beneath-california-sierra-nevada.html <-- shared technical article
--
https://doi.org/10.1029/2024GL111290 <-- shared paper
--
#GIS #spatial #mapping #geology #lithosphere #California #SierraNevada #continentalcrust #crust #mantle #foundering #remotesensing #geophysics #geophysical #earthquake #spatialanalysis #spatiotemporal #structuralgeology #earthquake #seismic #seismology #Moho #platetectonics #tectonics #shearzone #faults #faulting #seismicity #model #modeling #3dmodel


Here’s How Earthquakes Are Measured
--
https://www.nytimes.com/2024/12/05/us/earthquakes-measured-magnitude-richter-scale.html <-- shared media article
--
https://www.usgs.gov/programs/earthquake-hazards/earthquake-magnitude-energy-release-and-shaking-intensity <-- shared technical article
--
[I have experienced a number of earthquakes, including the 2001 Nisqually earthquake when I lived in Western Washington State.]
#GIS #spatial #mapping #earthquakes #seismology #magnitude #momentmagnitude #energy #geology #engineeringgeology #risk #hazard #scale #fault #faulting #Richter #logarithmic #rupture #engineering #buildingstandards #seismic #seismometers #shaking #quake #spatialanalysis #spatiotemporal #infrastructure


Research Offers Insights Into Permian Basin Earthquake Hazards
--
https://phys.org/news/2024-12-insights-permian-basin-earthquake-hazards.html <-- shared technical article
--
https://doi.org/10.1306/intro10012424106 <-- shared paper(s)
--
https://www.usgs.gov/programs/earthquake-hazards <-- USGS earthquake record, including catalogue
--
#GIS #spatial #mapping #model #modeling #3dmodeling #Texas #NewMexico #well #fracking #injection #oilandgas #petroleumindustry #wastewater #PermianBasin #subsurface #reservoirs #fault #faulting #earthquake #sesimicity #inducedseismicity #geology #basin #spatialanalysis #spatiotemporal #risk #hazard #reservoirengineering #geomechanics #WestTexas #oil #gas #production #Midland #MidlandBasin #regulations


Earthquake Hazard Uncertainties Improved Using Precariously Balanced Rocks
--
https://doi.org/10.1029/2020AV000182 <-- shared paper
--
#GIS #spatial #mapping #spatialanalysis #geomorphometry #probabilistic #seismichazard #analysis #PSHA #groundmotion #earthquake #risk #hazard #naturalhazard #quantitative #fault #faulting #geology #engineeringgeology #empirical #balancedrocks #PBR #California #cosmogenic #10Be #dating #model #modeling #hazardmodel #probability #infrastructure #cost #economics


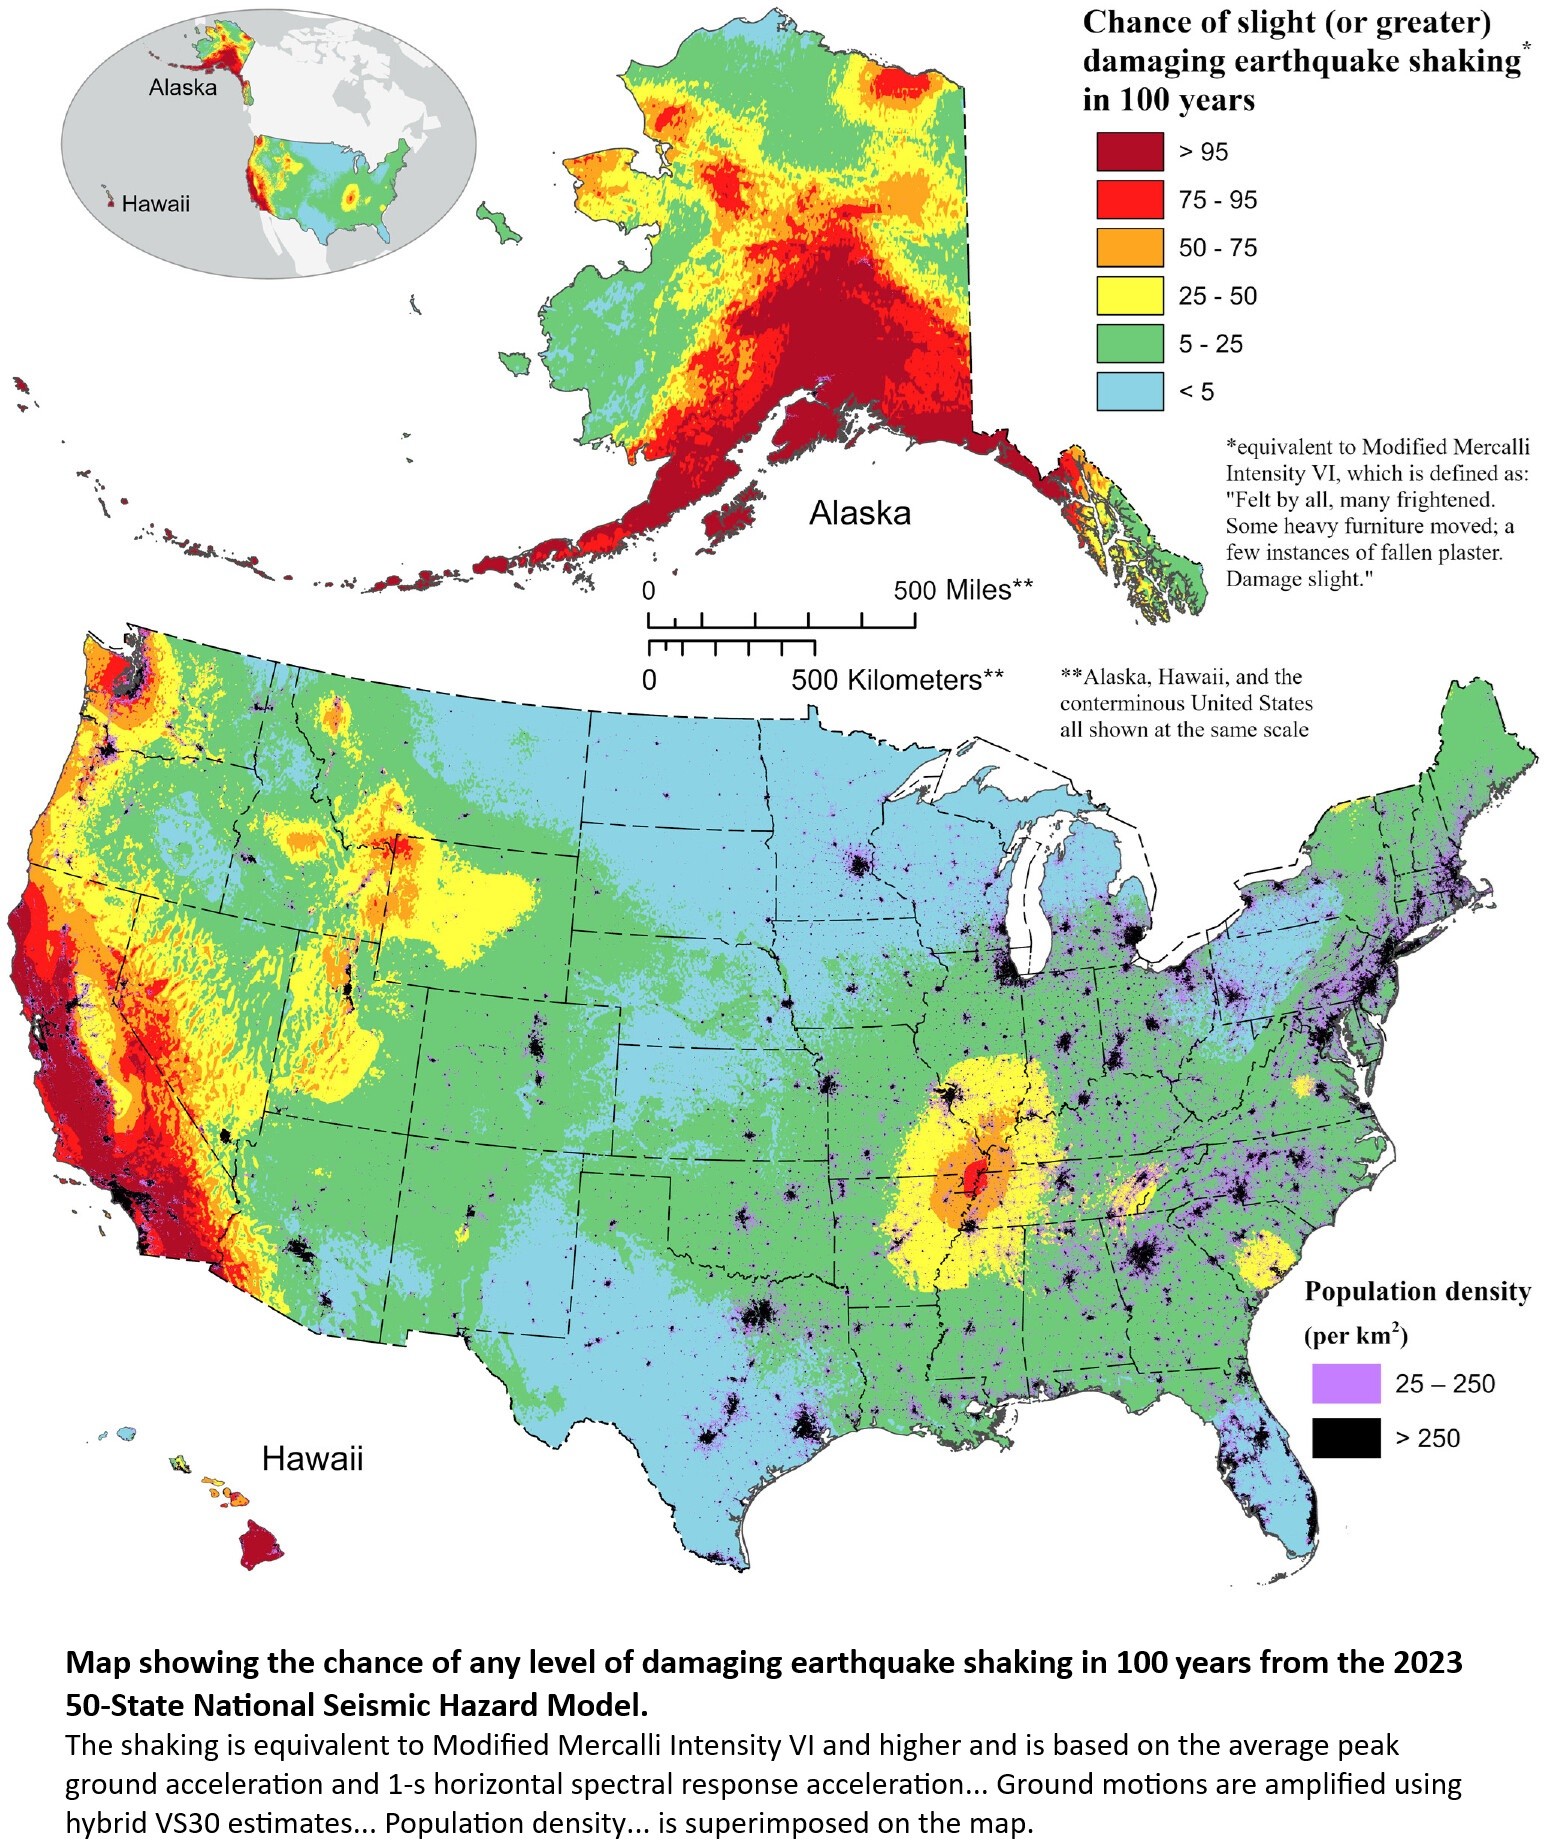
The 2023 US 50-State National Seismic Hazard Model - Overview And Implications
--
https://www.usgs.gov/programs/earthquake-hazards/science/2023-national-seismic-hazard-model-whats-shaking <-- USGS technical article
--
https://doi.org/10.1177/87552930231215428 <-- shared paper
--
#GIS #spatial #mapping #earthquake #seismichazard #risk #hazard #shakemap #cost #economics #geology #engineeringgeology #hazardmodel #model #modeling #seismicity #faultruptures #groundmotions #probabilistic #probability #geostatistics #engineering #planning #management #mitigation #NSHM #forecast #infrastructure #publicsafety #hazardassessment #fault #faulting #structuralgeology #intensity #mercalli #buildingcode #design #publicpolicy #shakemap #engineeringrisk #future
@USGS @FEMA
Preliminary Observations of the 5 April 2024 Mw 4.8 New Jersey Earthquake
--
https://doi.org/10.1785/0320240024 <-- shared paper
--
https://doi.org/10.1785/0320240020 <-- shared paper
--
https://doi.org/10.1177/87552930231215428 <-- shared paper
--
[This is ‘unusual’ seismic activity and shaking patterns for this part of the USA, on an ‘unmapped’ fault, and seemingly challenging existing models of earthquake risk in the region; while a 4.8 is not big, it must have been quite a surprise for the people in this heavily populated U.S. Northeast not used to such things (per the paper, the USGS estimated it was felt by some 42 million people.]
#GIS #spatial #mapping #earthquake #risk #hazard #spatialanalysis #model #modeling #NewJersey #USA #geology #engineeringgeology #seismic #USGS #seismology #fault #faulting #Tewksbury #DidYouFeelIt #geotechnical #NIST #remotesensing #InSAR #strikeslip #mechanism #thrust


![Geologic map of the epicentral area simplified from Owens et al. (1998) and Drake et al. (1996) draped over topography showing mapped faults (black lines), initial aftershock locations from U.S. Geological Survey (USGS) Comprehensive Earthquake Catalog (ComCat; U.S. Geological Survey [USGS], 2017; downloaded 7 April 2024, at 13:59 UTC; purple circles), and mainshock focal mechanism (see Data and Resources). The location of seismic station BRNJ, which was not recording during the mainshock, is shown by the red square. The New Jersey Highlands, composed of Mesoproterozoic to Ordovician igneous and metamorphic rocks, are shown to the northwest of the white line, and the Newark basin, composed of Mesozoic sedimentary and volcanic rocks, lies to the southeast. Background image is a shaded relief derived from the 10 m National Elevation Dataset (see Data and Resources). Seismicity in inset (gray dots and yellow stars) is from the USGS ComCat (USGS, 2017). The blue rectangle in the inset map indicates the region depicted in the larger figure.](https://files.mastodon.social/cache/media_attachments/files/113/476/834/885/563/078/original/14955d4fc882df06.png)
Earthquake Focal Mechanisms – Life’s A Beach(Ball) [USGS]
--
https://www.usgs.gov/observatories/yvo/news/earthquake-focal-mechanisms-lifes-a-beachball <-- shared technical link
--
https://doi.org/10.1029/2003JB002675 <-- shared paper
--
#geology #faulting #risk #hazard #spatialanalysis #spatial #GIS #mapping #earthquake #beachball #beachballdiagram #slip #orientation #slipdirection #focalmechanism #focalsphere #structuralgeology #seismic #waves #compression #tension #mechanism #geomorphometry
@USGS


Most Detailed Study Yet Of Seismic Activity Links Fault Strength To Likelihood Of Large Earthquakes
--
https://phys.org/news/2024-09-seismic-links-fault-strength-likelihood.html <-- shared technical article
--
https://www.nature.com/articles/s41467-024-49422-7 <-- shared paper
--
[seems intuitive, but nice to see some data/analysis]
#GIS #spatial #mapping #monitoring #observations #network #seismicstations #earthquake #faults #faulting #Pacific #RingOfFire #Japan #geology #structuralgeology #risk #hazard #prediction #seismic #activity #seismology #strength #bvalue #model #modeling #numericmodeling #stress


Earthquake Fault Friction’s Dependence On Temperature Different From Previously Thought
--
https://today.usc.edu/earthquake-fault-frictions-dependence-on-temperature-different-from-previously-thought/ <-- shared technical article
--
https://doi.org/10.1073/pnas.2405111121 <-- shared paper
--
#model #modeling #earthquake #fault #faulting #numericmodeling #rock #friction #temperature #mechanics #stress #stressrelief #geology #structuralgeology #experiment #experimentation #brittle #ductile #deform #degrade #fracturing #thermal #predictive #prediction

New Study Seeks To Shed Light On Earthquake Hazards In The Gallatin Range
--
https://www.usgs.gov/observatories/yvo/news/new-study-seeks-shed-light-earthquake-hazards-gallatin-range <-- shared technical article
--
#GIS #spatial #mapping #remotesensing #LiDAR #earthquake #fault #scarps #faulting #opendata #3dep #NGTOC #ruptures #surfaceexpression #risk #hazard #geology #engineeringgeology #geomorphology #geomorphmetry #seismology #elevation #topography #EastGallatin #ReeseCreek #faultsystem #EGRCFS #GallatinRange #GardnersHole #Yellowstone #Wyoming #Montana #USA #glaciation #superposition #dating #geologichistory #NationalSeismicHazardModel #model #modeling #spatialanalysis #spatiotemporal #massmovement #hydrothermal #YellowstoneNationalPark
@USGS


Most Detailed Study Yet Of Seismic Activity Links Fault Strength To Likelihood Of Large Earthquakes
--
https://phys.org/news/2024-09-seismic-links-fault-strength-likelihood.html <-- shared technical article
--
https://doi.org/10.1038/s41467-024-49422-7 <-- shared paper
--
#GIS #spatial #mapping #earthquake #Japan #risk #hazard #seismology #bvalue #model #modeling #spatiotemporal #stress #sampling #spatialanalysis #fault #faulting #strength #magnitude #stressfield
More Faults, More Resolution, More Features - The New Zealand Active Faults Database Webmap Gets A Major Upgrade
--
https://www.gns.cri.nz/news/more-faults-more-resolution-more-features-the-nz-active-faults-database-webmap-gets-a-major-upgrade/ <-- shared technical article
--
https://data.gns.cri.nz/af/ <-- New Zealand Active Faults home page/ webmap
--
#GIS #spatial #mapping #spatiotemporal #fault #faulting #NewZealand #earthquake #geology #risk #hazard #groundsurface #webmap #record #database #surfacetrace #geomorphology #geomorphmetry #NZAFD #infrastructure #earthquakeengineering #engineeringgeology #planning #urbanplanning #regulations #geotechnical #landuse #permits #slip #frequency #riskassessment #GNS
@gnsscience


Japan Issues First ‘Megaquake’ Warning For Nankai Trough After Strong Earthquake Hits Miyazaki [August 8th 2024]
--
https://www.nzherald.co.nz/world/japan-issues-first-megaquake-warning-for-nankai-trough-after-strong-earthquake-hits-miyazaki/FPL7SAYODZGAXC6TGMJEXOC5TE/ <-- shared media article
--
https://earthquakeinsights.substack.com/p/m71-earthquake-strikes-southern-japan <-- shared Earthquake Insights details page
--
#GIS #spatial #mapping #operationalearthquakeforecast #OEP #japan #NankaiTrough #megaquake #earthquake #Miyazaki #risk #hazard #model #modeling #fault #faulting #geology #engineeringgeology #structuralgeology #earthquakehazard #infrastructure #humanimpacts


Client Info
Server: https://mastodon.social
Version: 2025.07
Repository: https://github.com/cyevgeniy/lmst