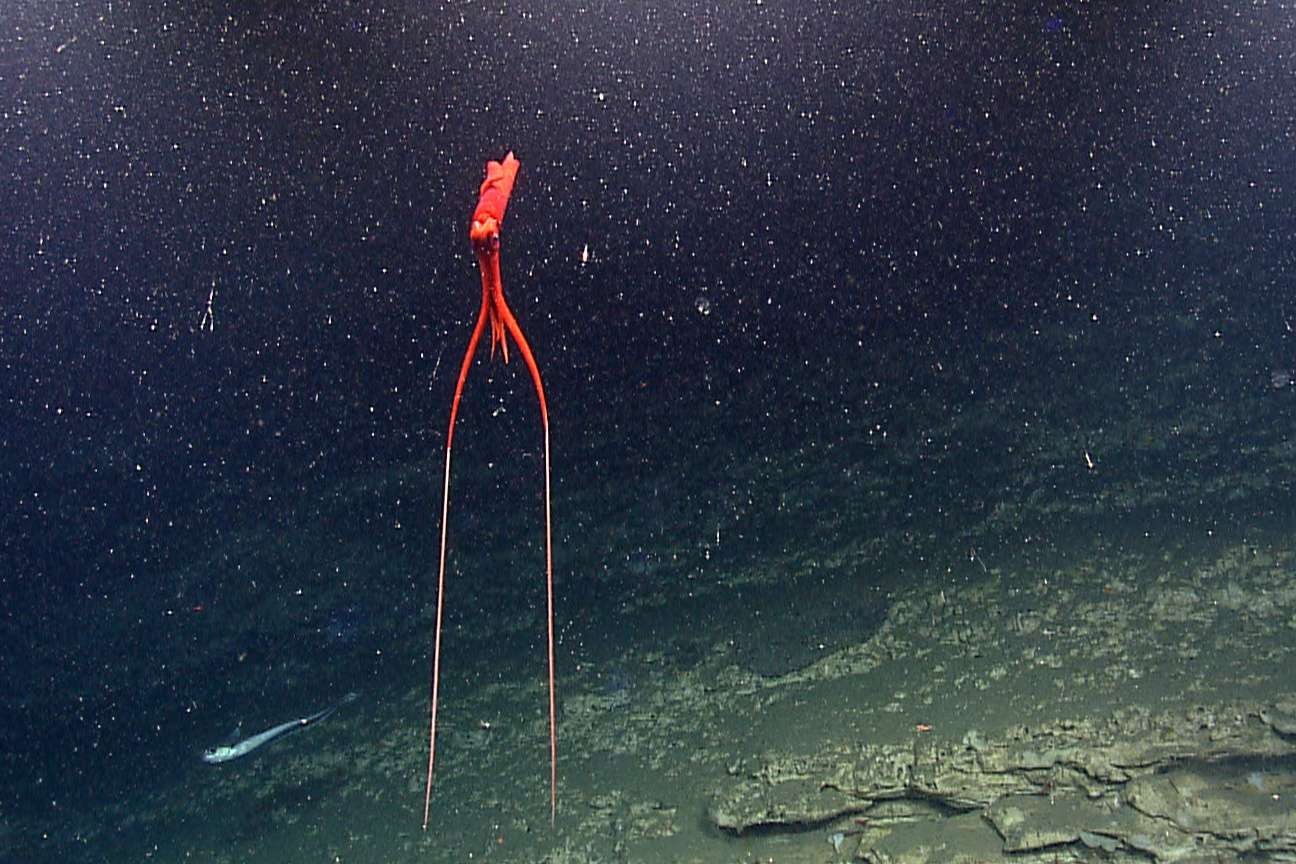
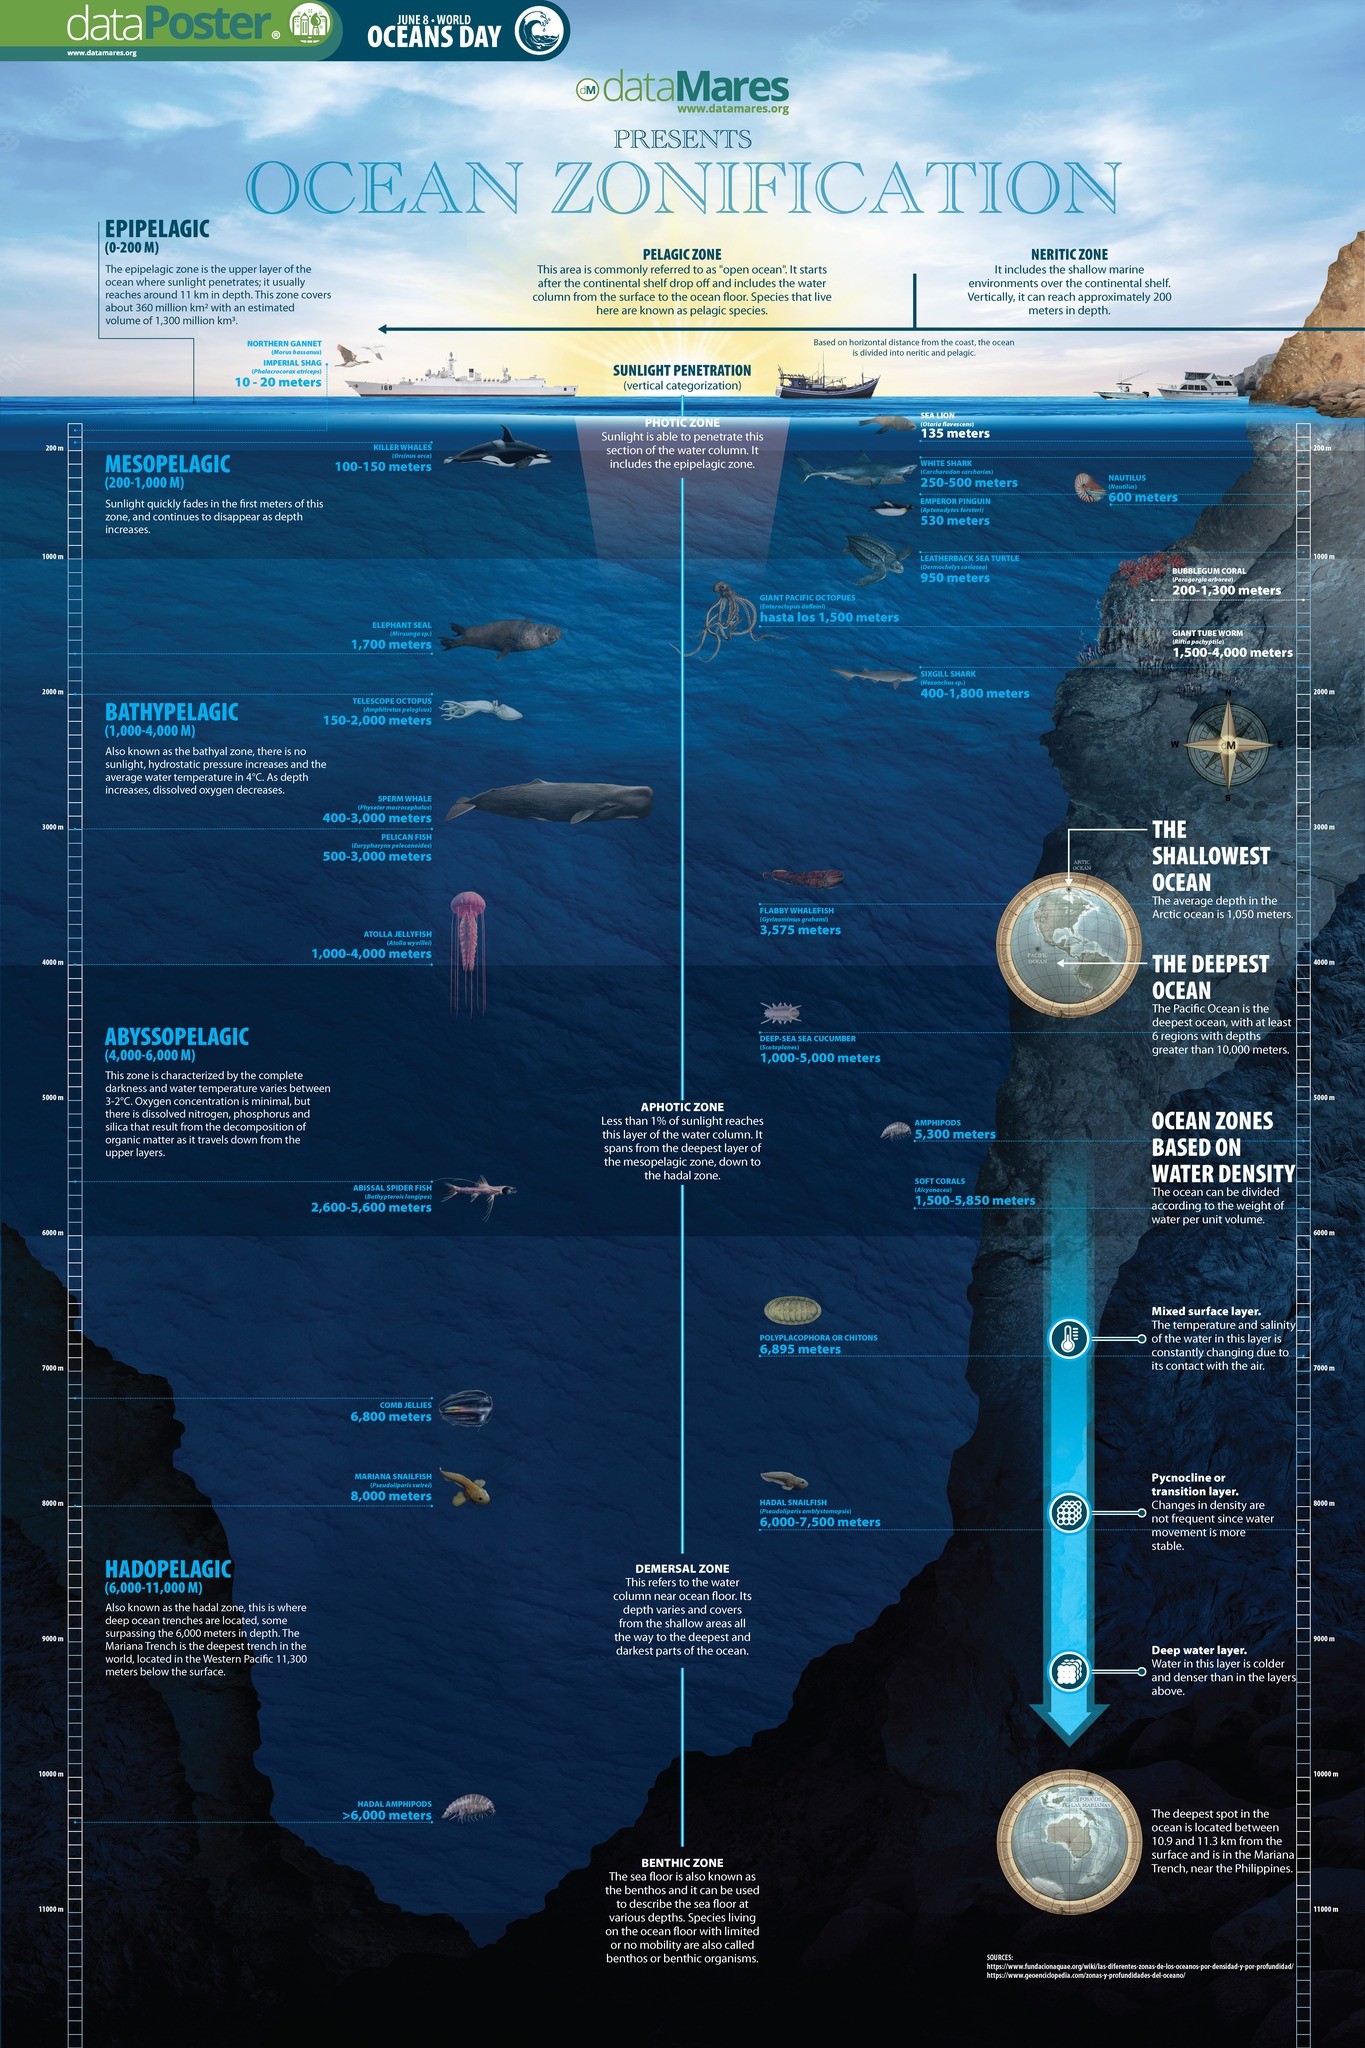
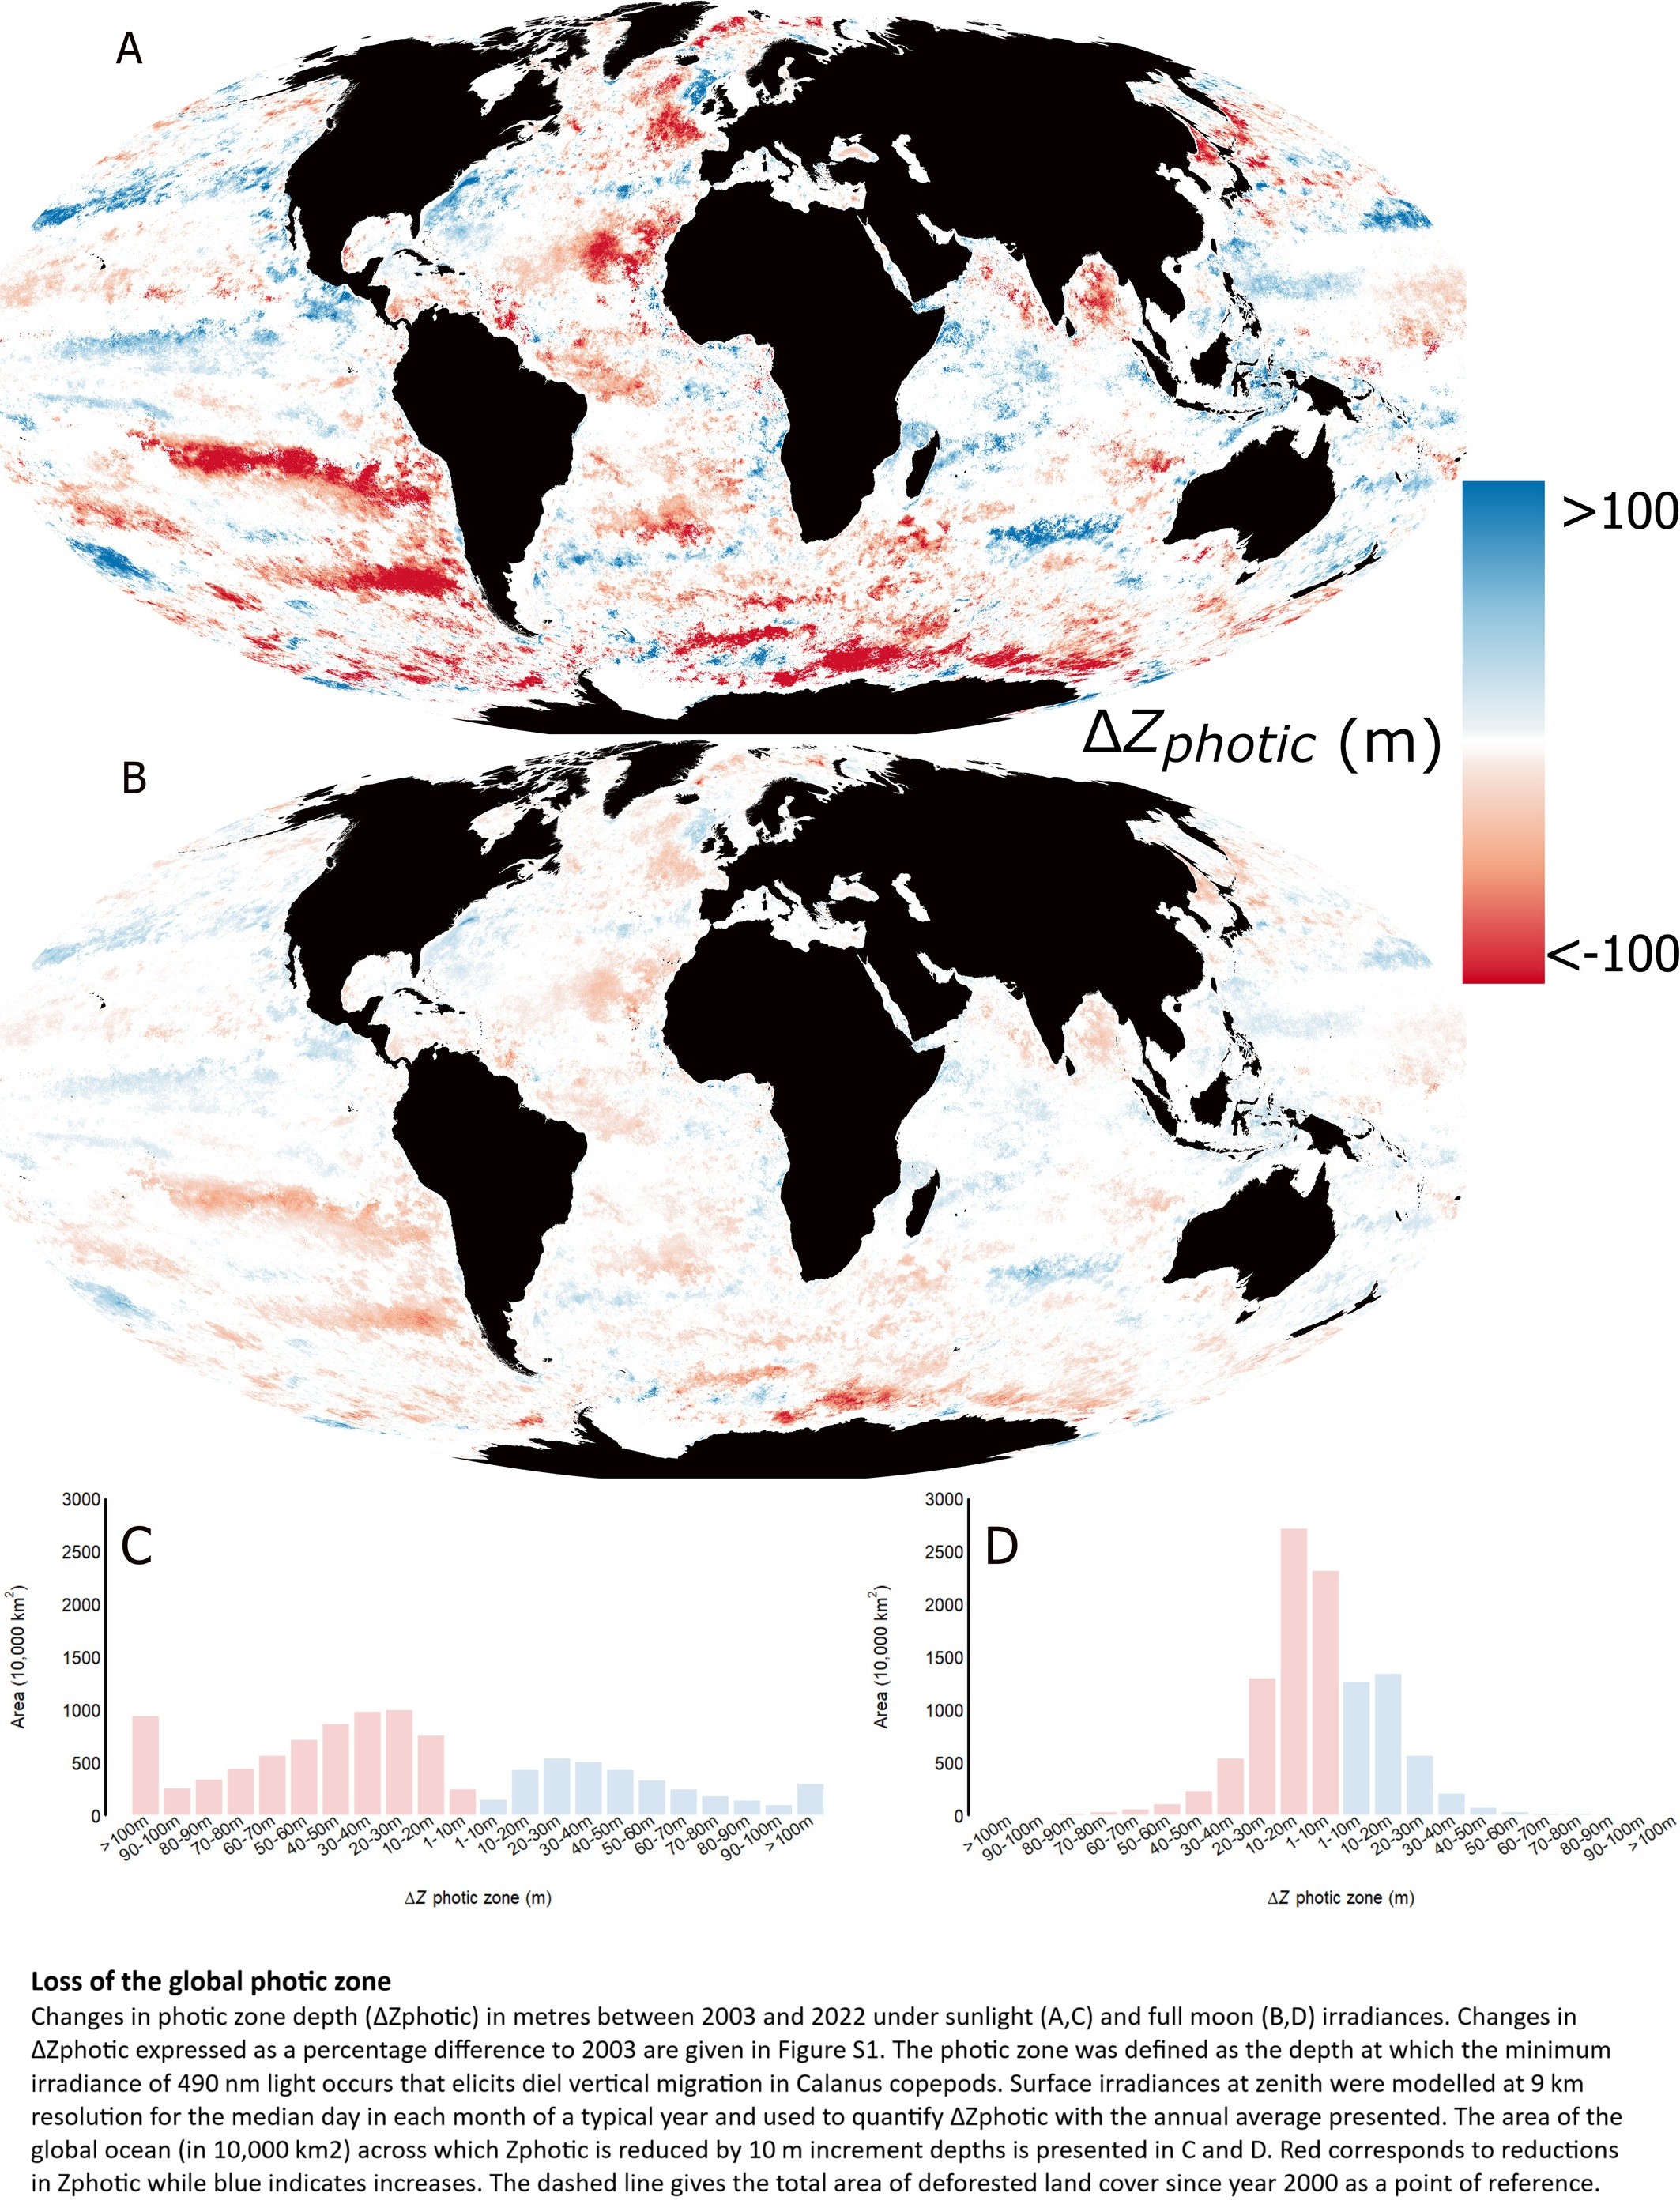
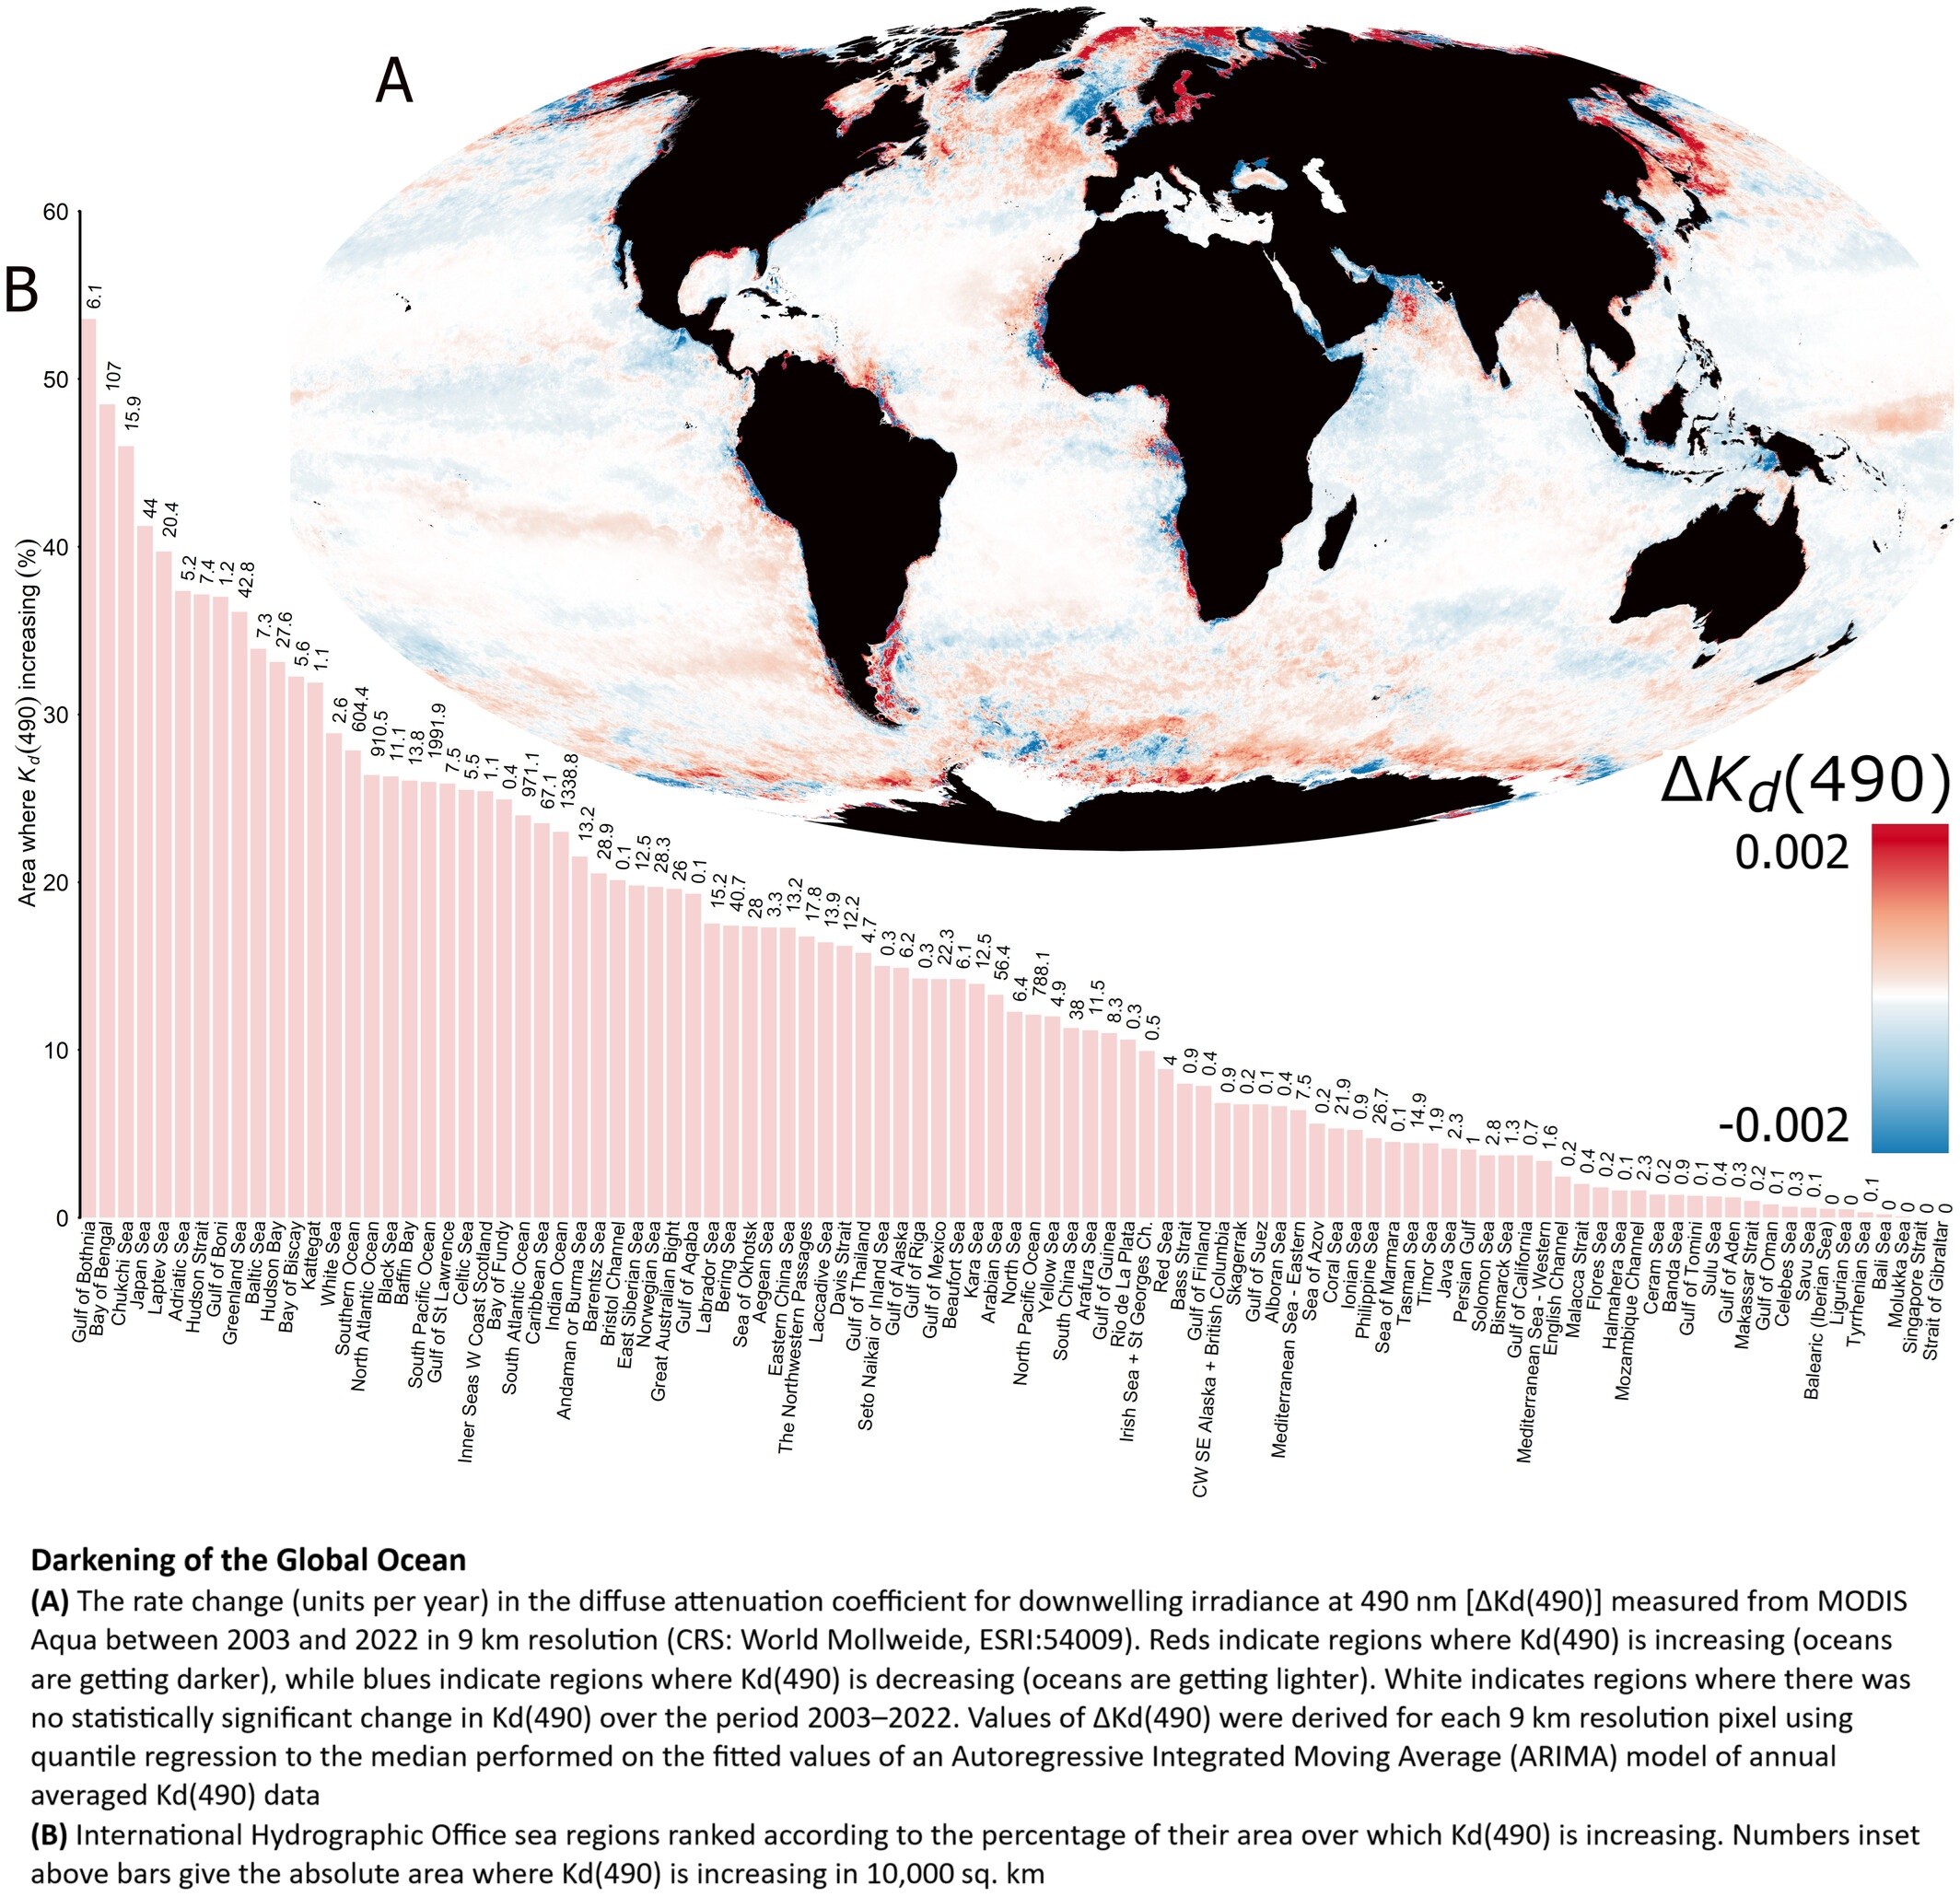
Darkening Of The Global Ocean
--
https://doi.org/10.1111/gcb.70227 <-- shared paper
--
[a little outside of ‘my usual’, but fascinating (and alarming, frankly…)]
#GIS #spatial #mapping #marine #ocean #photic #photiczone #ecology #change #sunlight #moonlight #spatialanalysis #spatiotemporal #darkening #habitat #biogeochemical #penetration #MODIS #remotesensing #earthobservation #satellite #light #coast #deepsea #openocean #nutrient #sediment #currents #circulation #productivity #fisheries #surface #ecology #ecosystems #impacts #humanimpacts
#MODIS
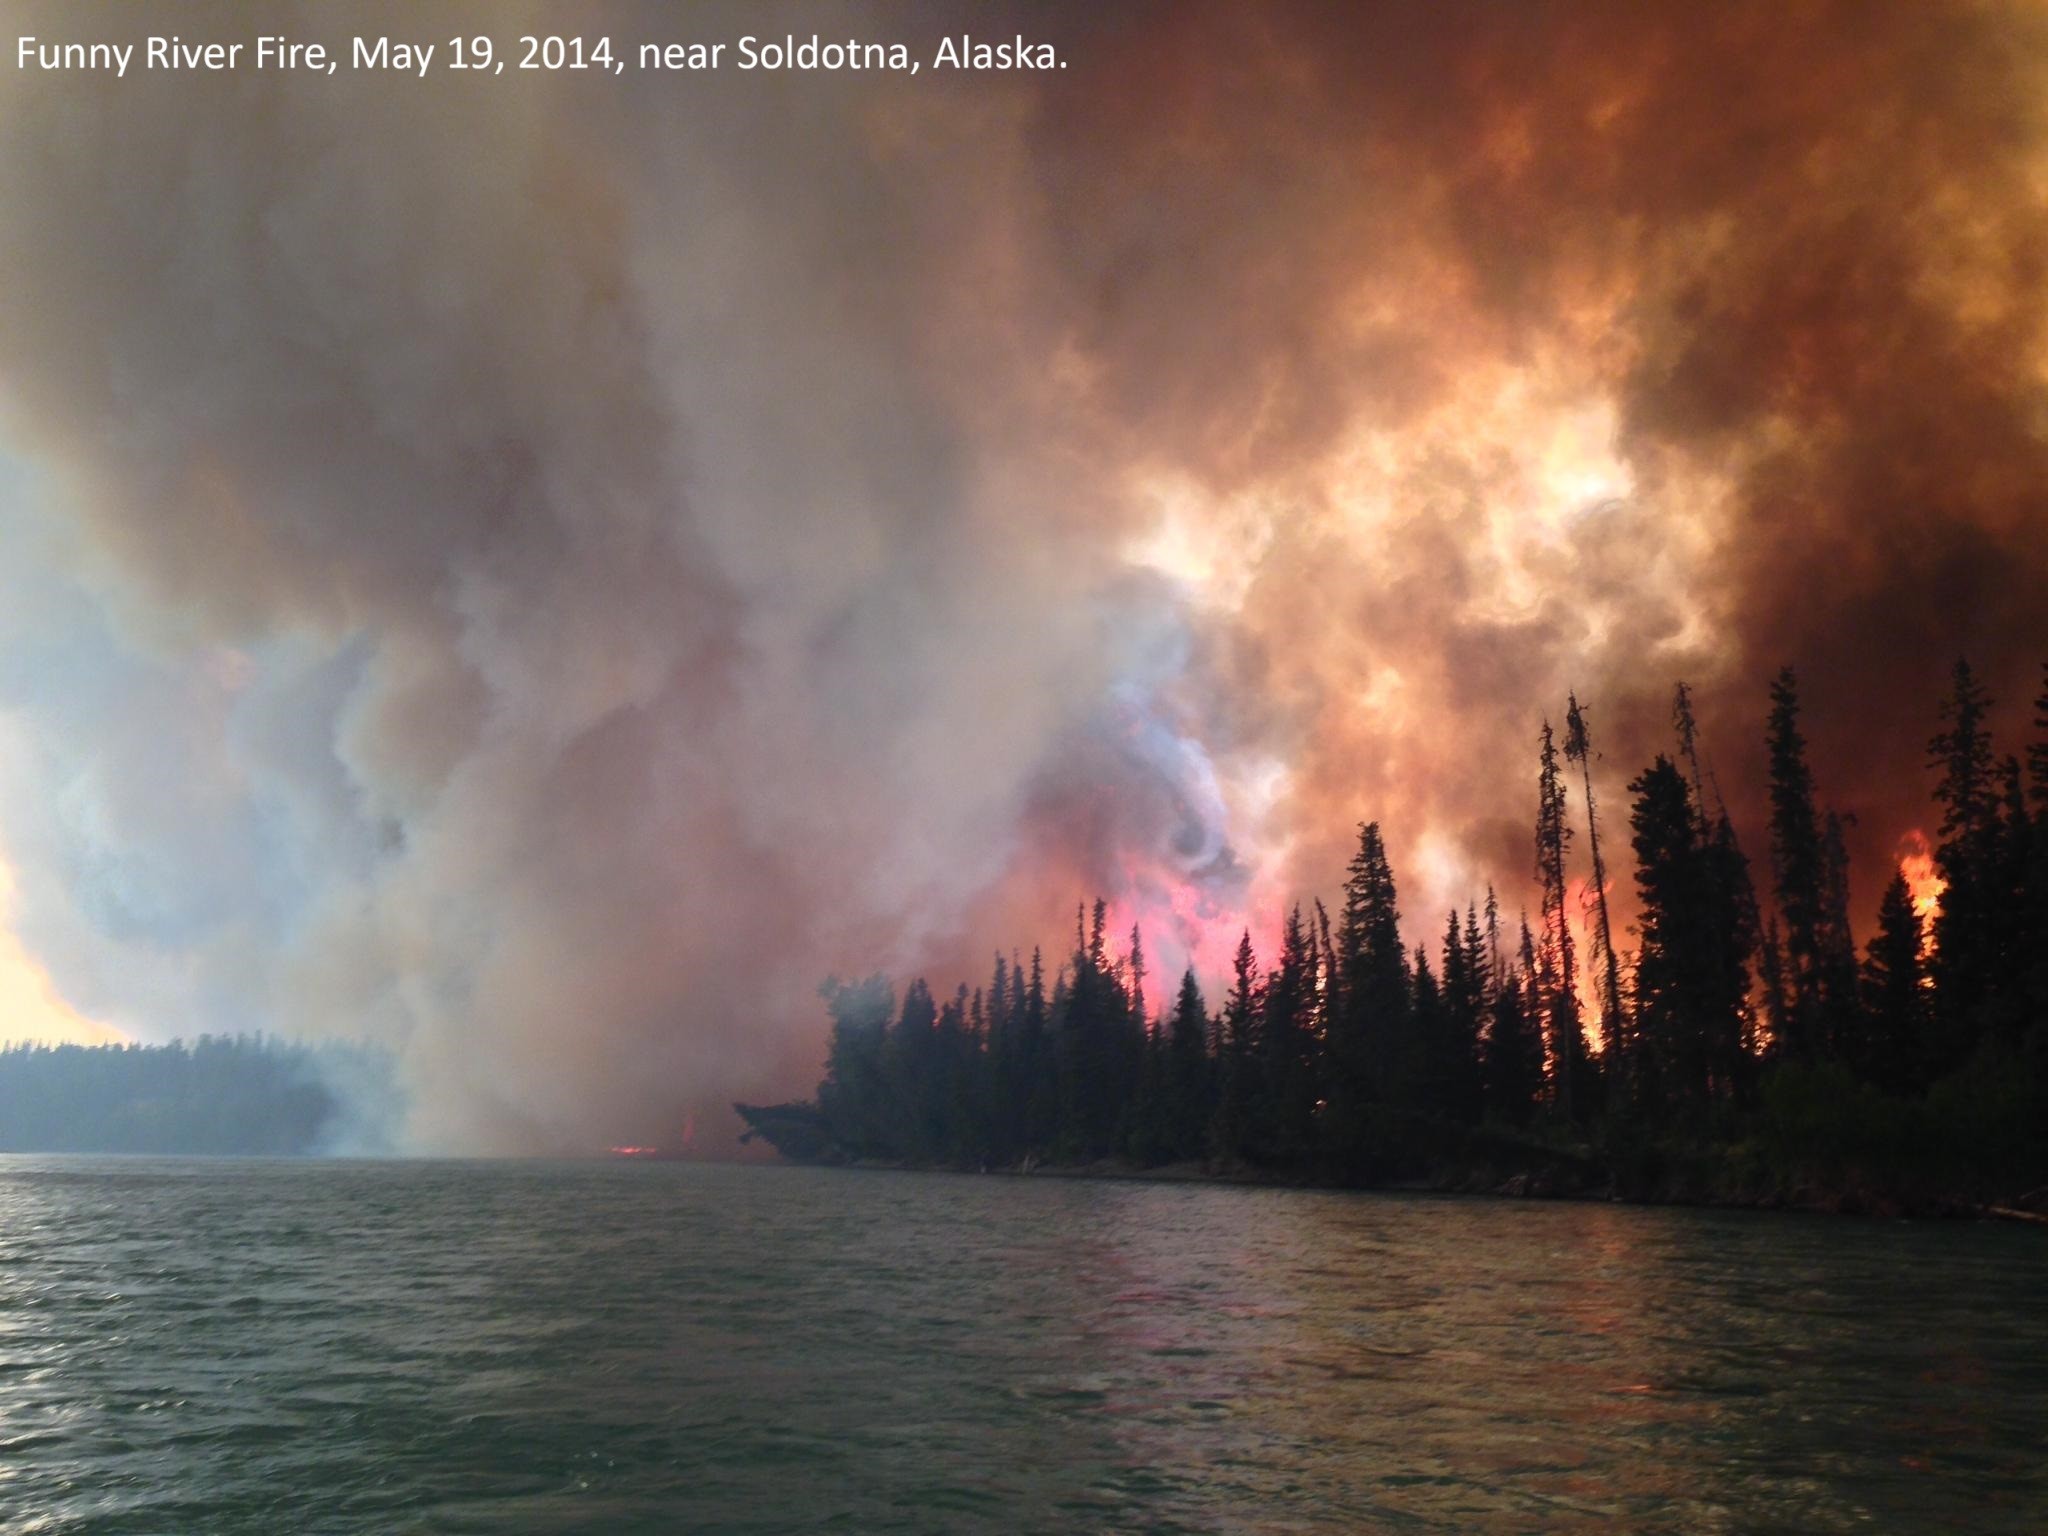
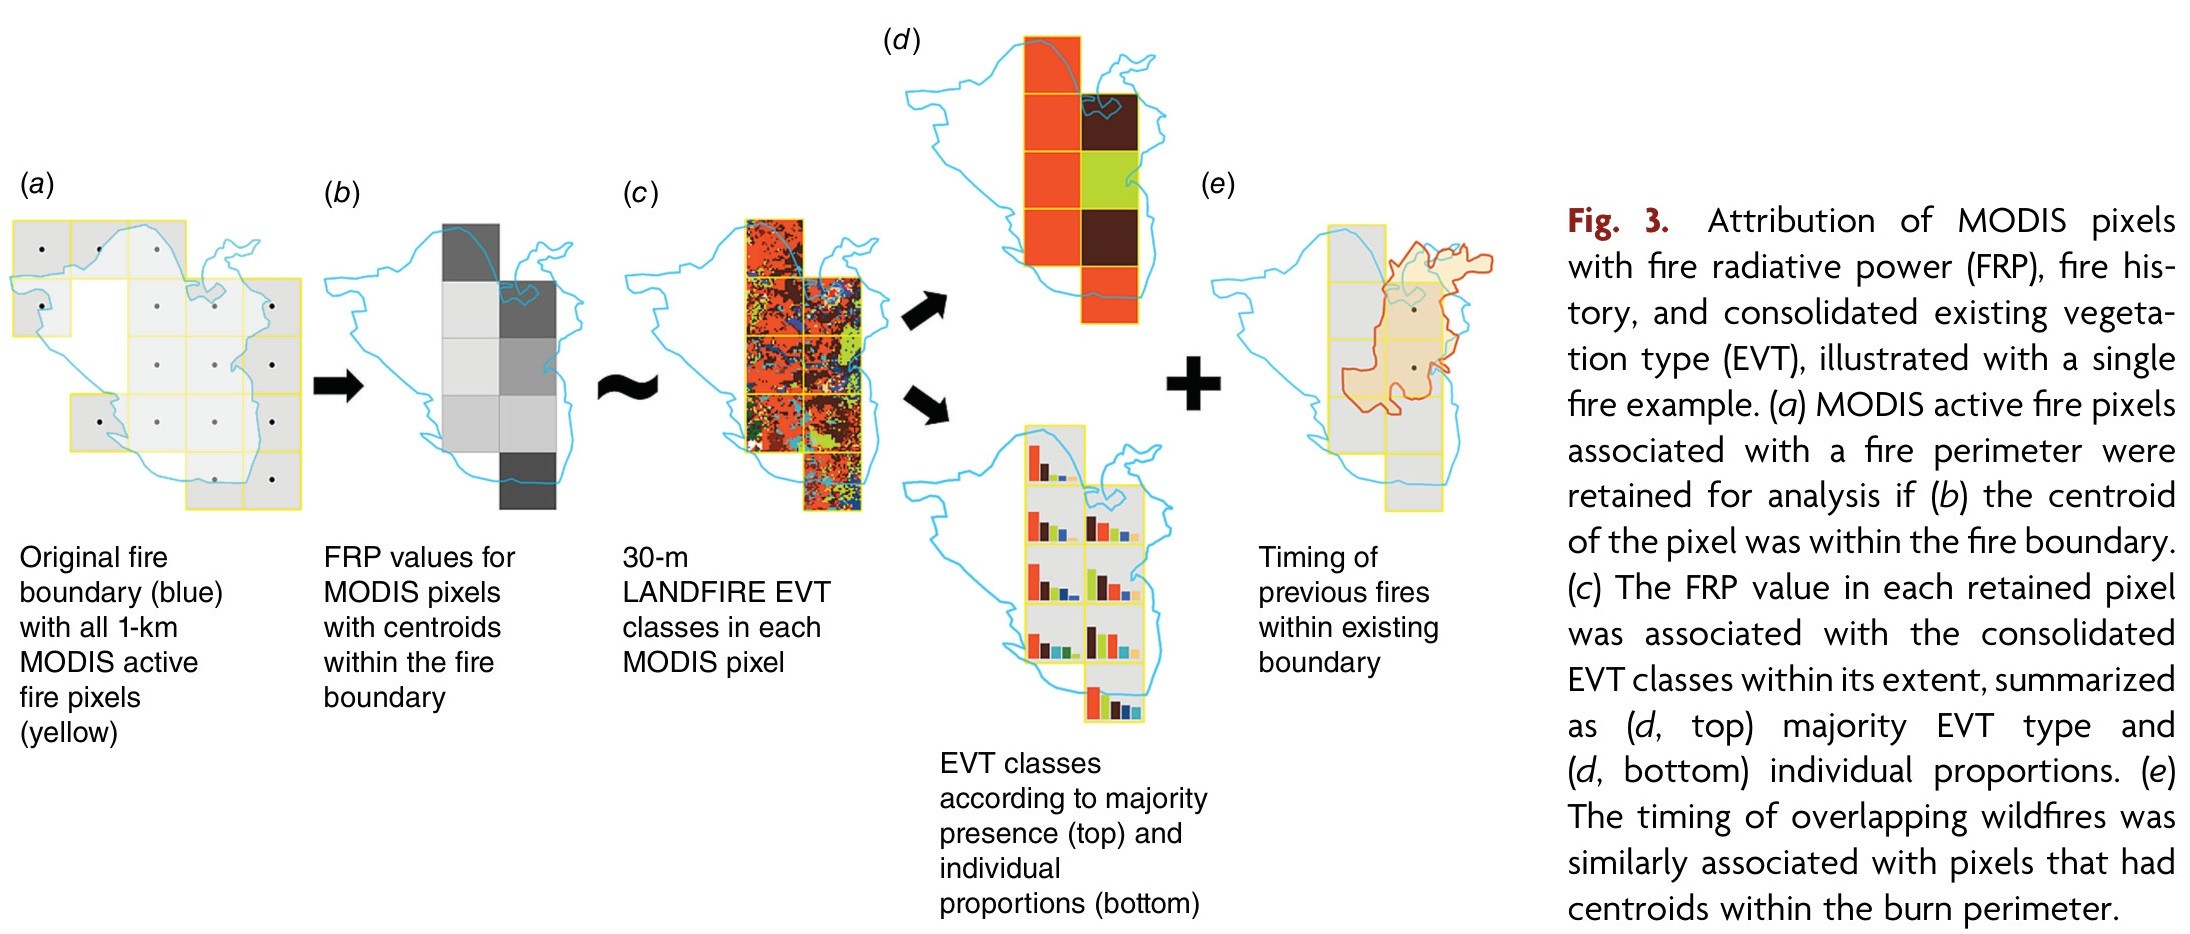
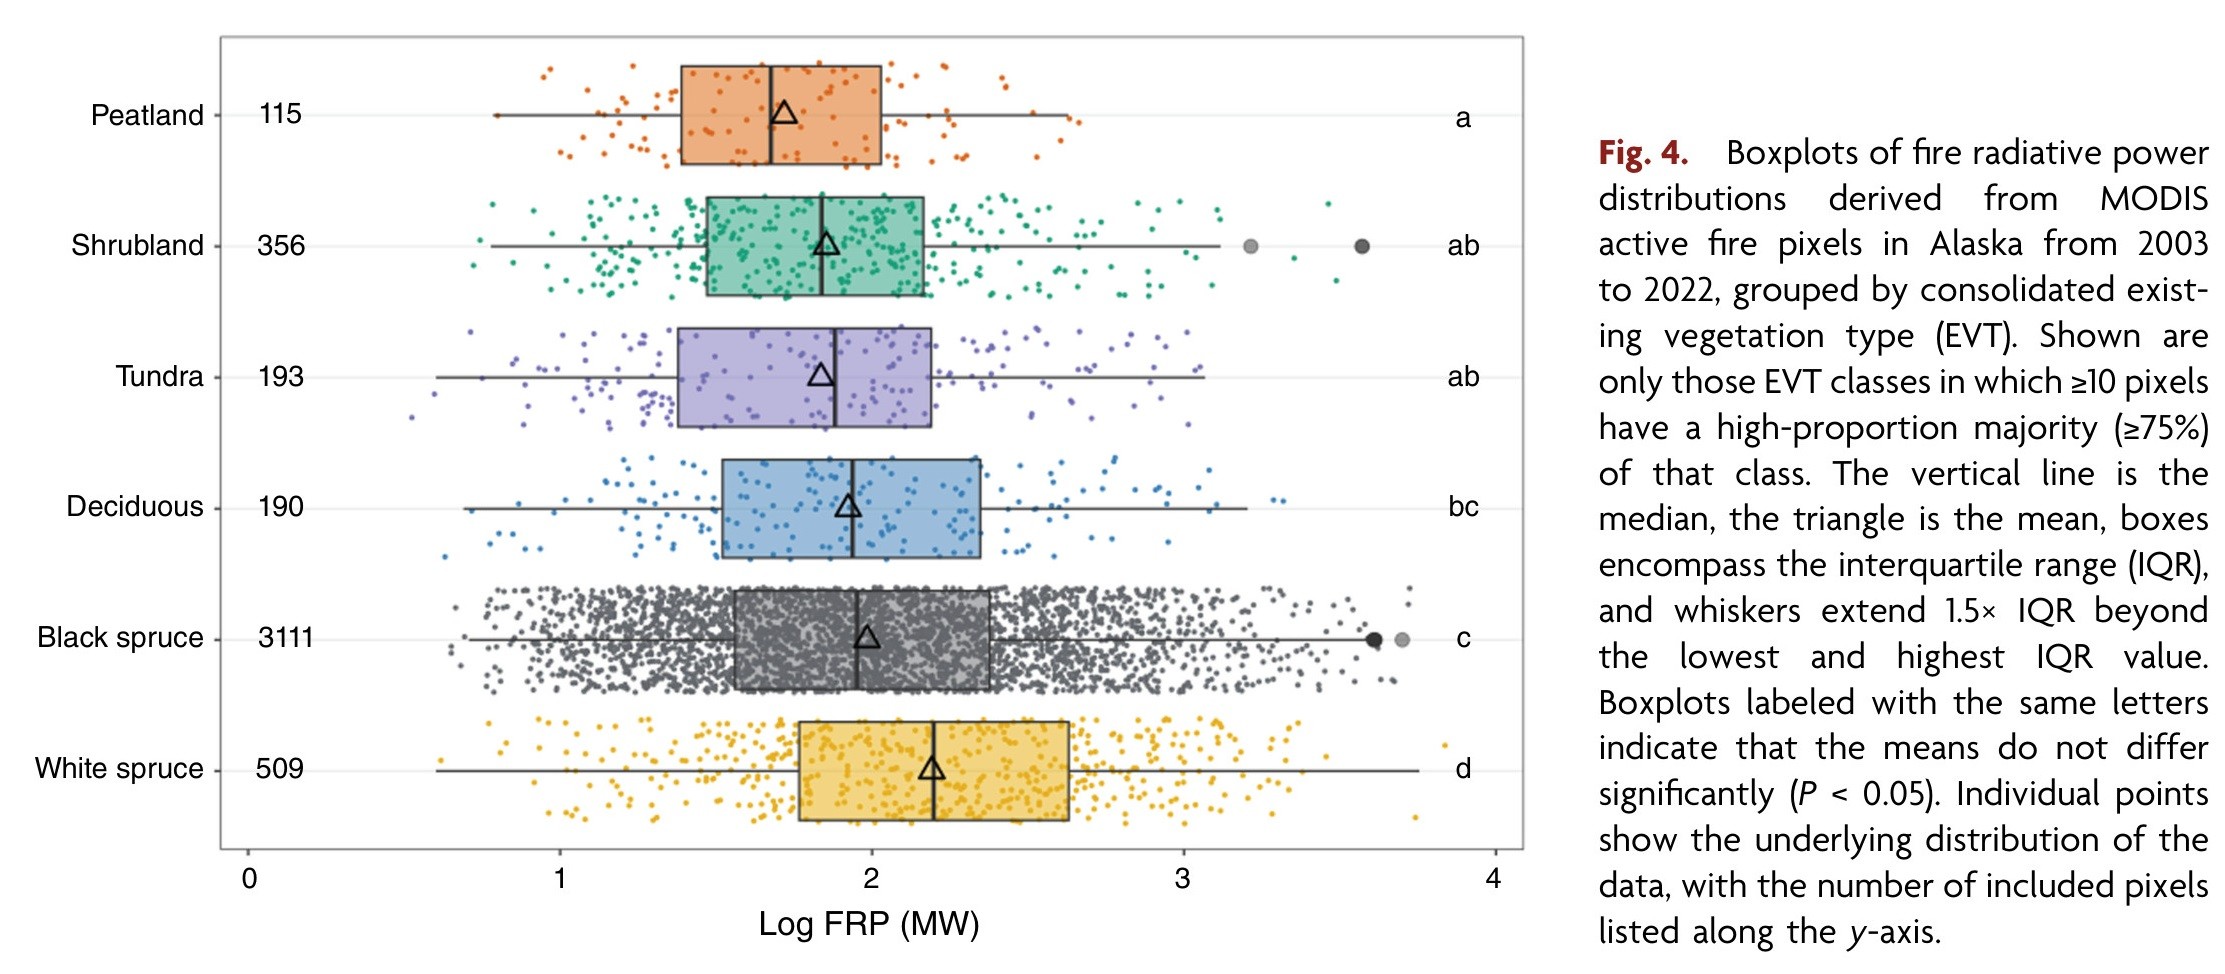
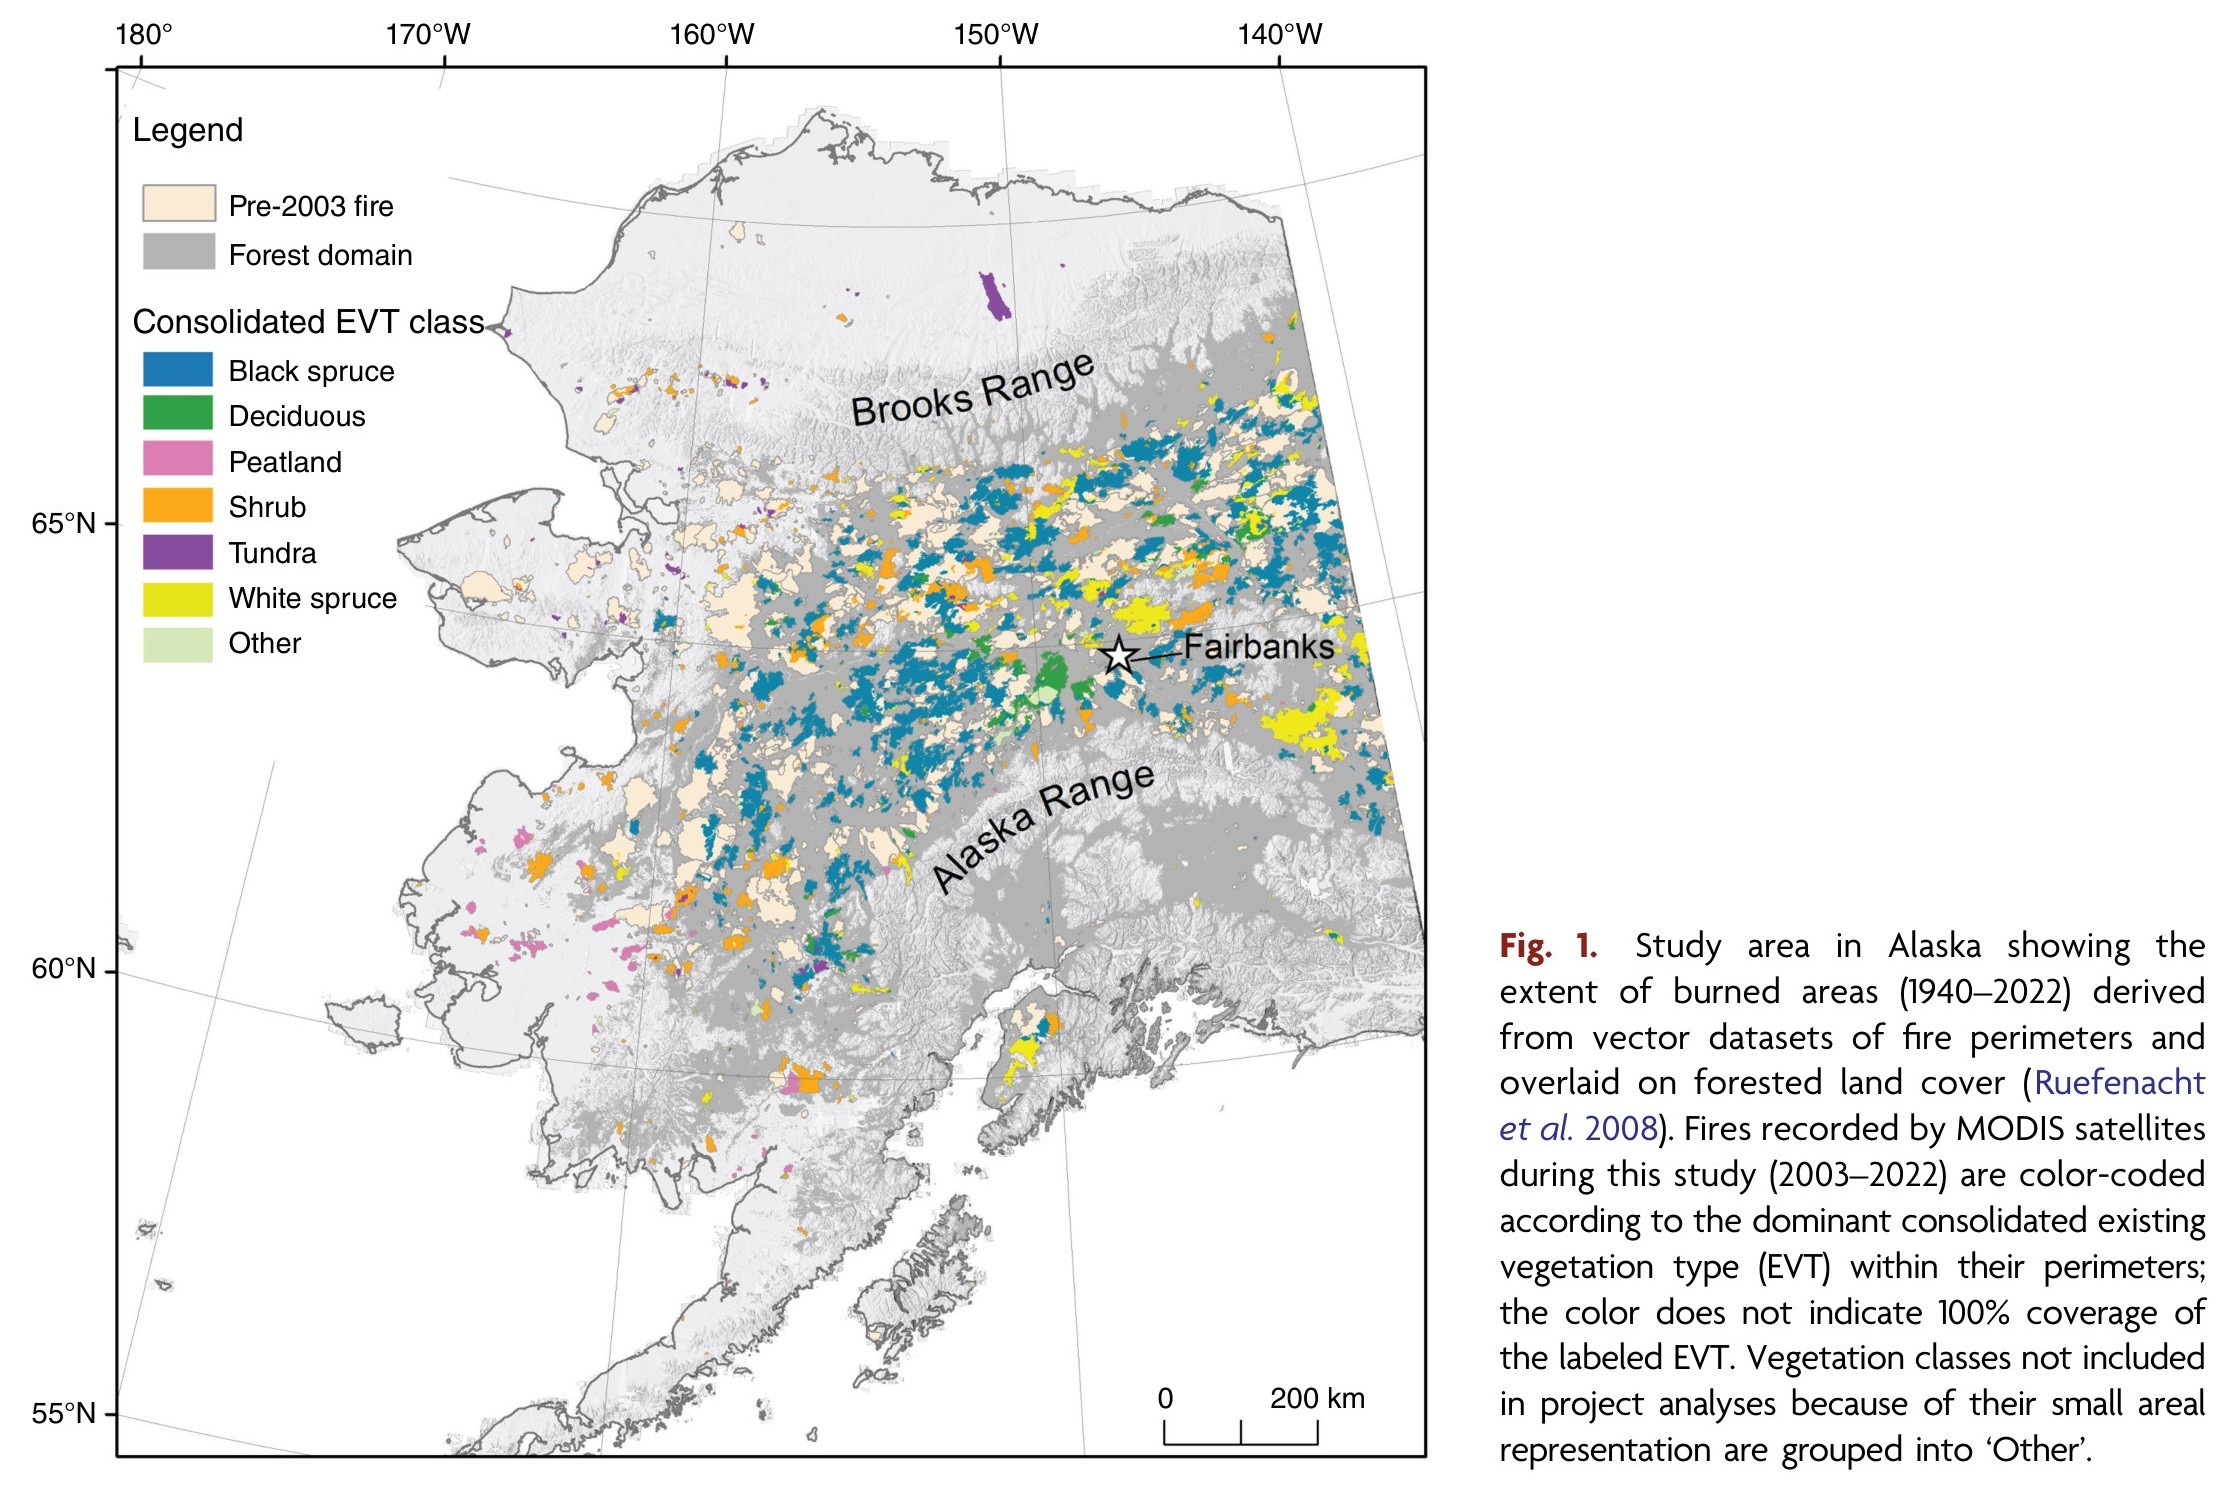
Understanding Wildfire Behaviour Across Alaska Using Remote Sensing Of Fire Intensity
--
https://www.usgs.gov/programs/ecosystems-land-change-science-program/news/understanding-wildfire-behavior-across-alaska <-- shared article
--
https://doi.org/10.1071/WF24062 <-- shared paper
--
https://www.sciencebase.gov/catalog/item/66c3aef6d34e03388287afd0 <-- shared USGS open data release - MODIS Fire Radiative Power Data Compiled From Active Fires In Alaska, 2003-2022
--
https://akfireinfo.com/ <-- shared Alaska Wildland Fire Information page
--
#GIS #spatial #mapping #WildfireScience #Alaska #RemoteSensing #satellite #WildfireAwarenessMonth #WildlandFireScience #fedscience #fedservice #wildfire #bushfire #blackspruce #boreal #fireintensity #fireradiativepower #FRP #MODIS #postfire #shrubland #tundra #whitespruce #peat #ecosystems #risk #hazard #management #planning #recovery #severity
Hardline Republicans in the U.S. House of Representatives blocked President Donald Trump's sweeping tax bill on Friday over concerns it did not do enough to cut spending hours before Moody's stripped the federal government of its once top-tier credit rating. Moody's, which was the last of the three major ratings agencies to rate U.S. AAA, warned that the nation's debt burden could reach 134% of gross domestic product by 2035, compared with 98% in 2024. #us #usa #news #America #trump #modis
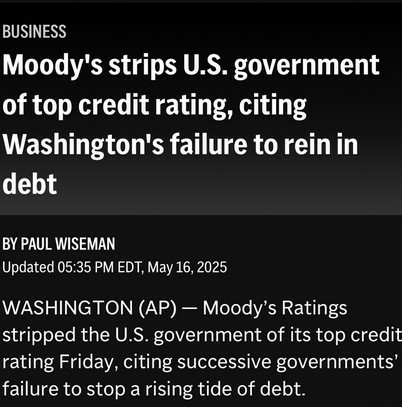
Hardline Republicans in the U.S. House of Representatives blocked President Donald Trump's sweeping tax bill on Friday over concerns it did not do enough to cut spending hours before Moody's stripped the federal government of its once top-tier credit rating. Moody's, which was the last of the three major ratings agencies to rate U.S. AAA, warned that the nation's debt burden could reach 134% of gross domestic product by 2035, compared with 98% in 2024. #us #usa #news #America #trump #modis

Mithilfe von #Satellitendaten erkennt ein neues Verfahren das winzige #Zooplankton Calanus finmarchicus, das für Nordatlantische #Glattwale lebenswichtig ist.
Die Methode hilft, Fressgebiete im Golf von Maine vorherzusagen. Das könnte Kollisionen mit Schiffen und Verwicklungen in Fischereigeräte reduzieren. Die Daten stammen von NASA-Instrumenten wie #MODIS und künftig #PACE.
https://dx.doi.org/10.3389/fmars.2025.1507638
#Weltnaturschutz #Meeresforschung #Klimawandel #NASA #Ozeanbeobachtung #Wale #Artenschutz
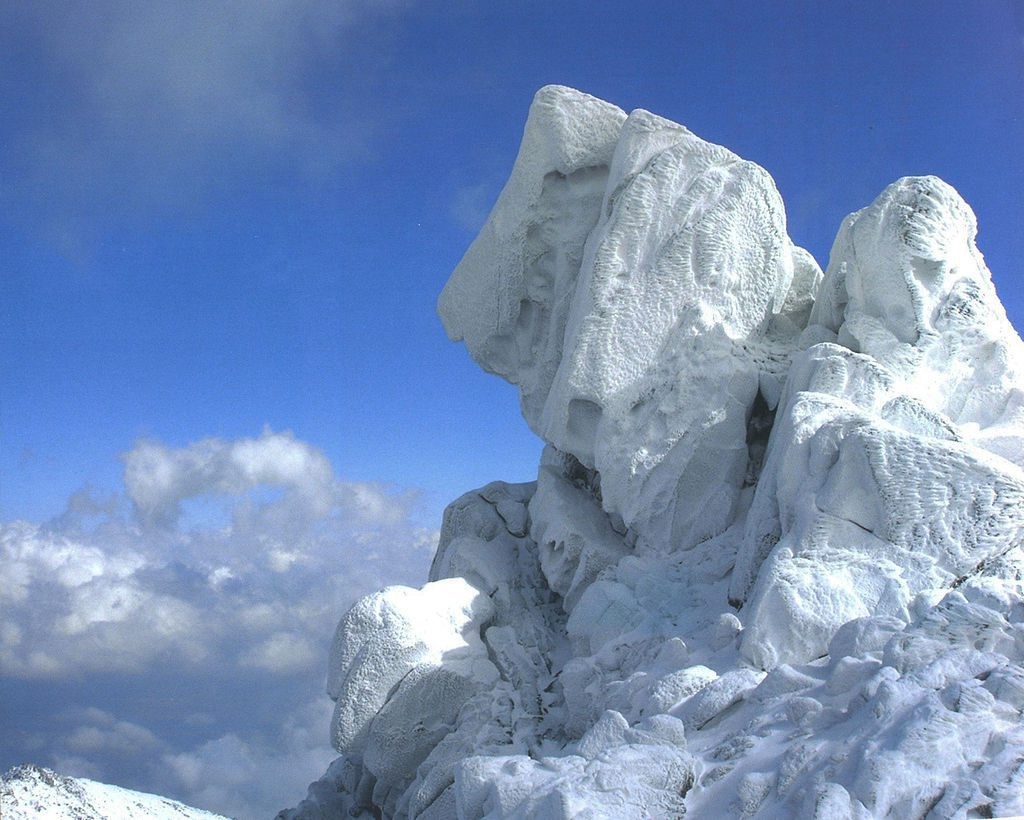
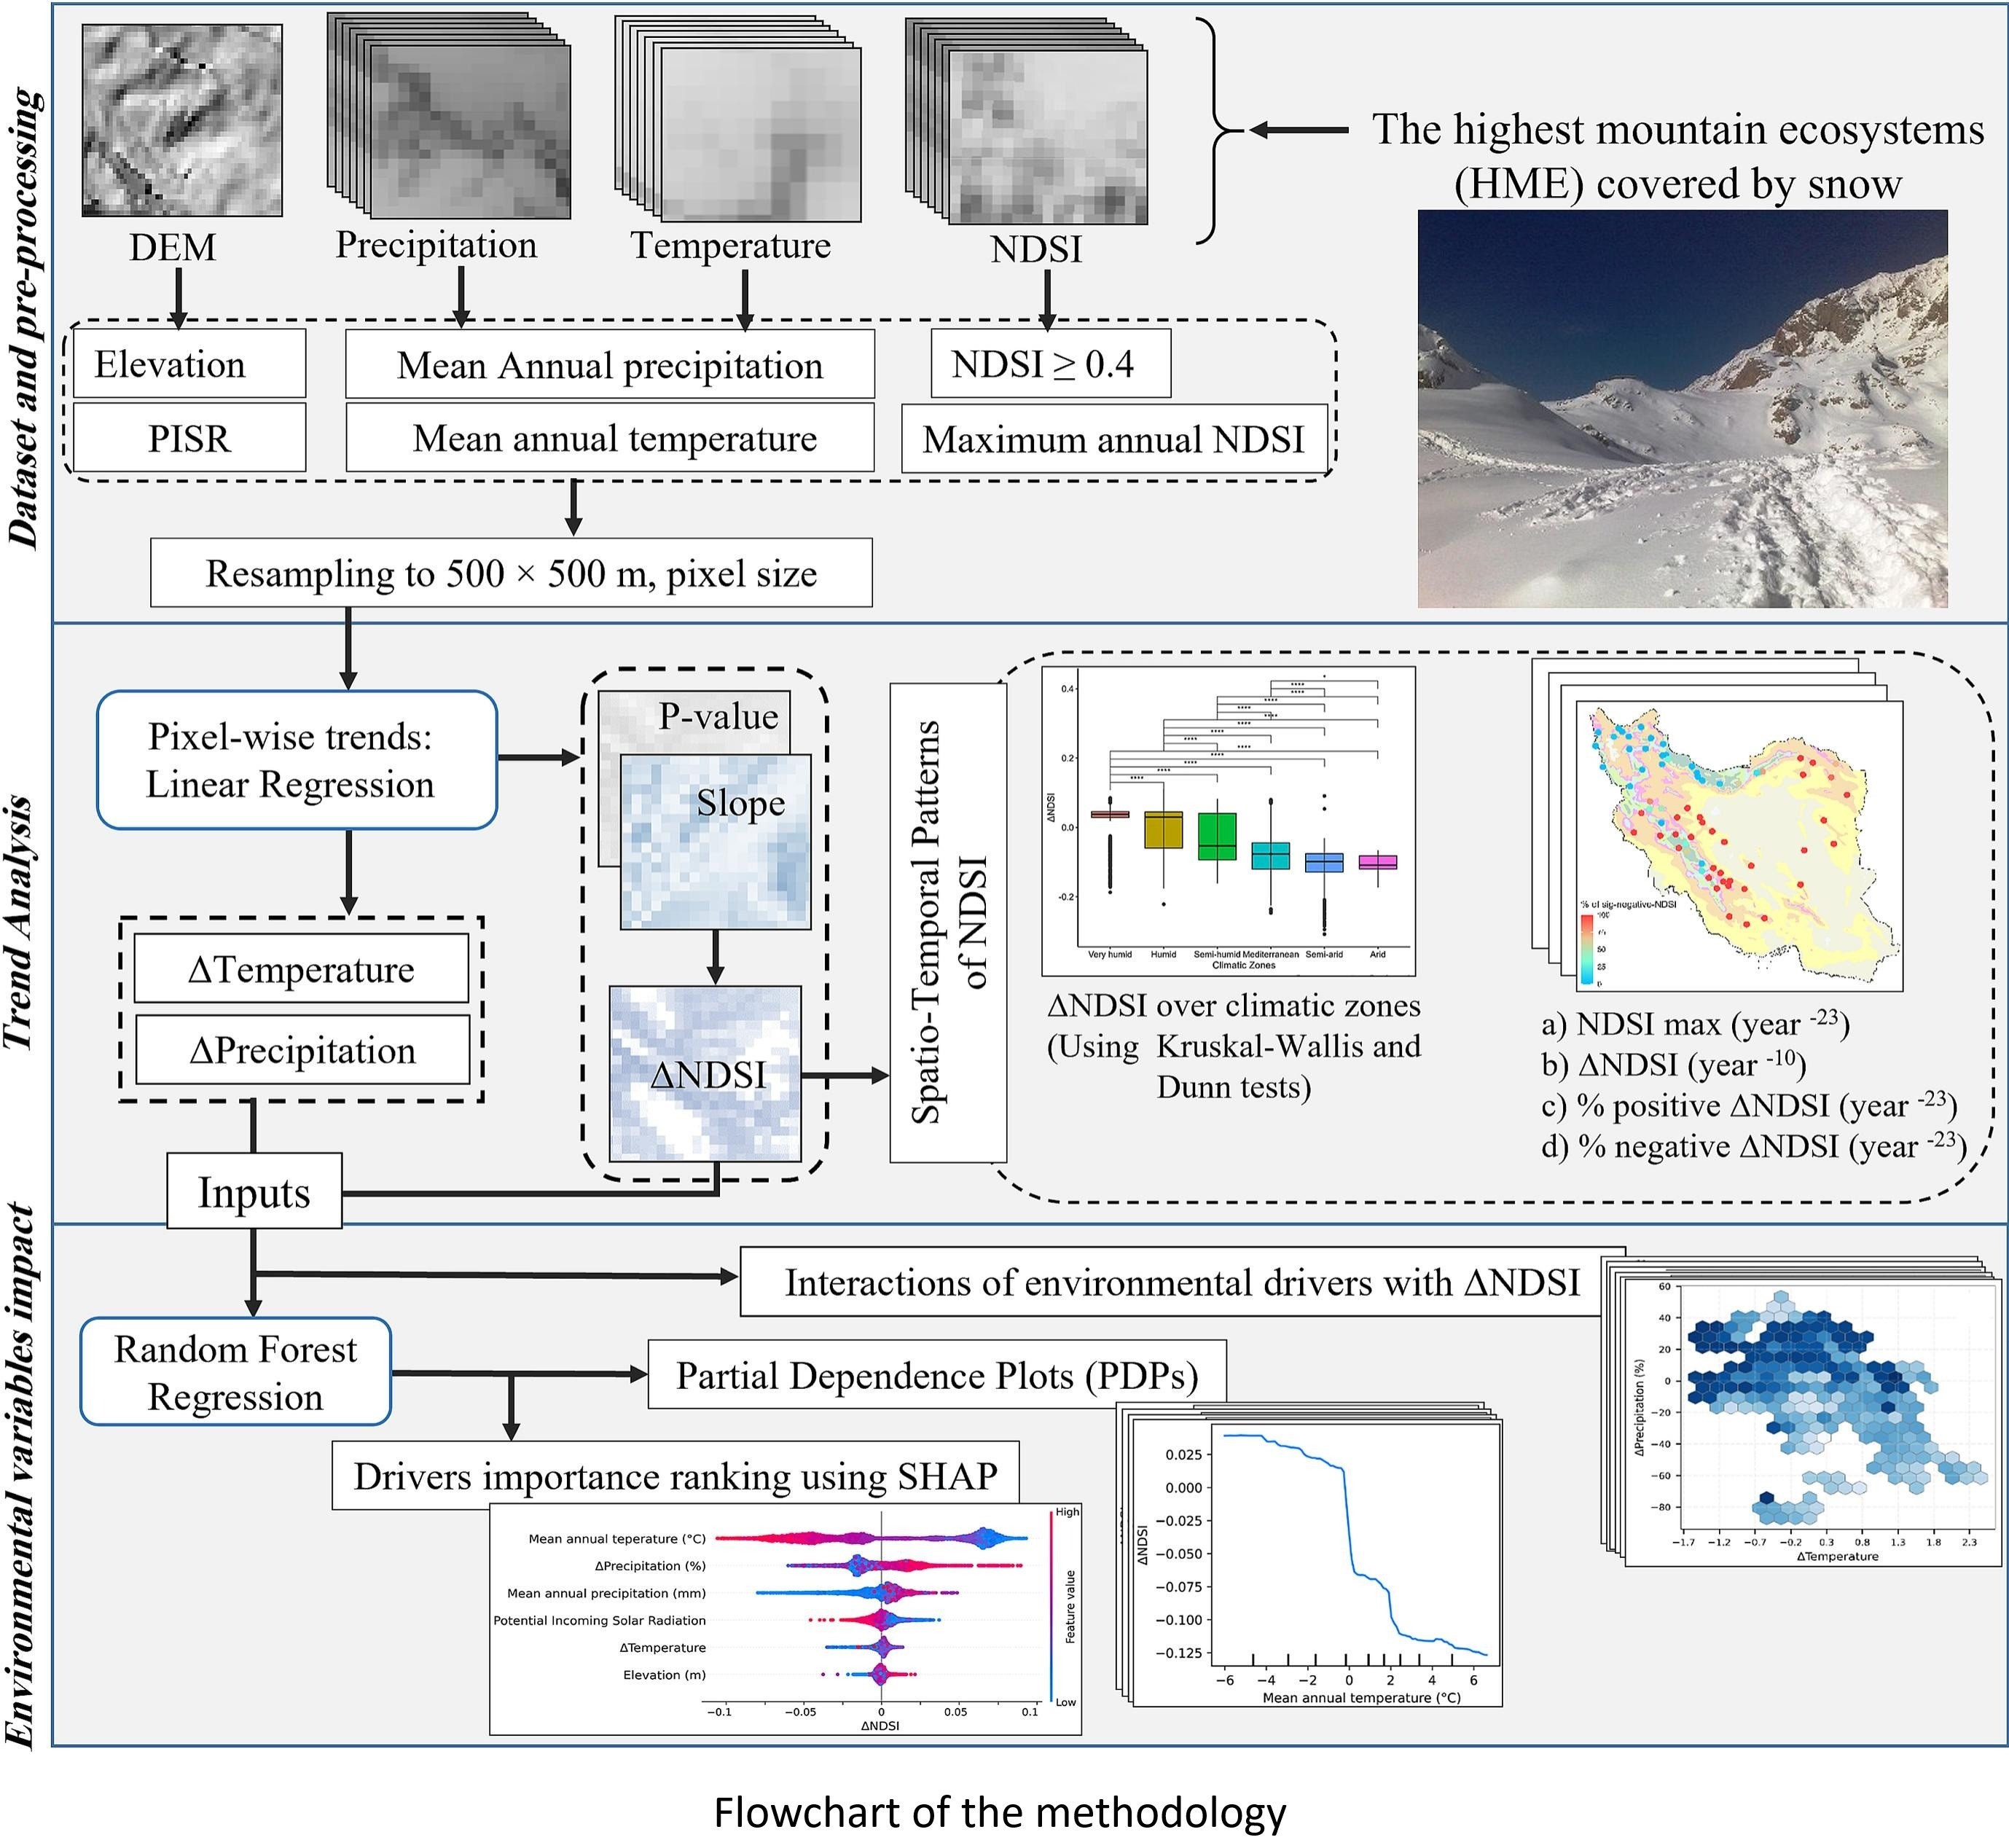
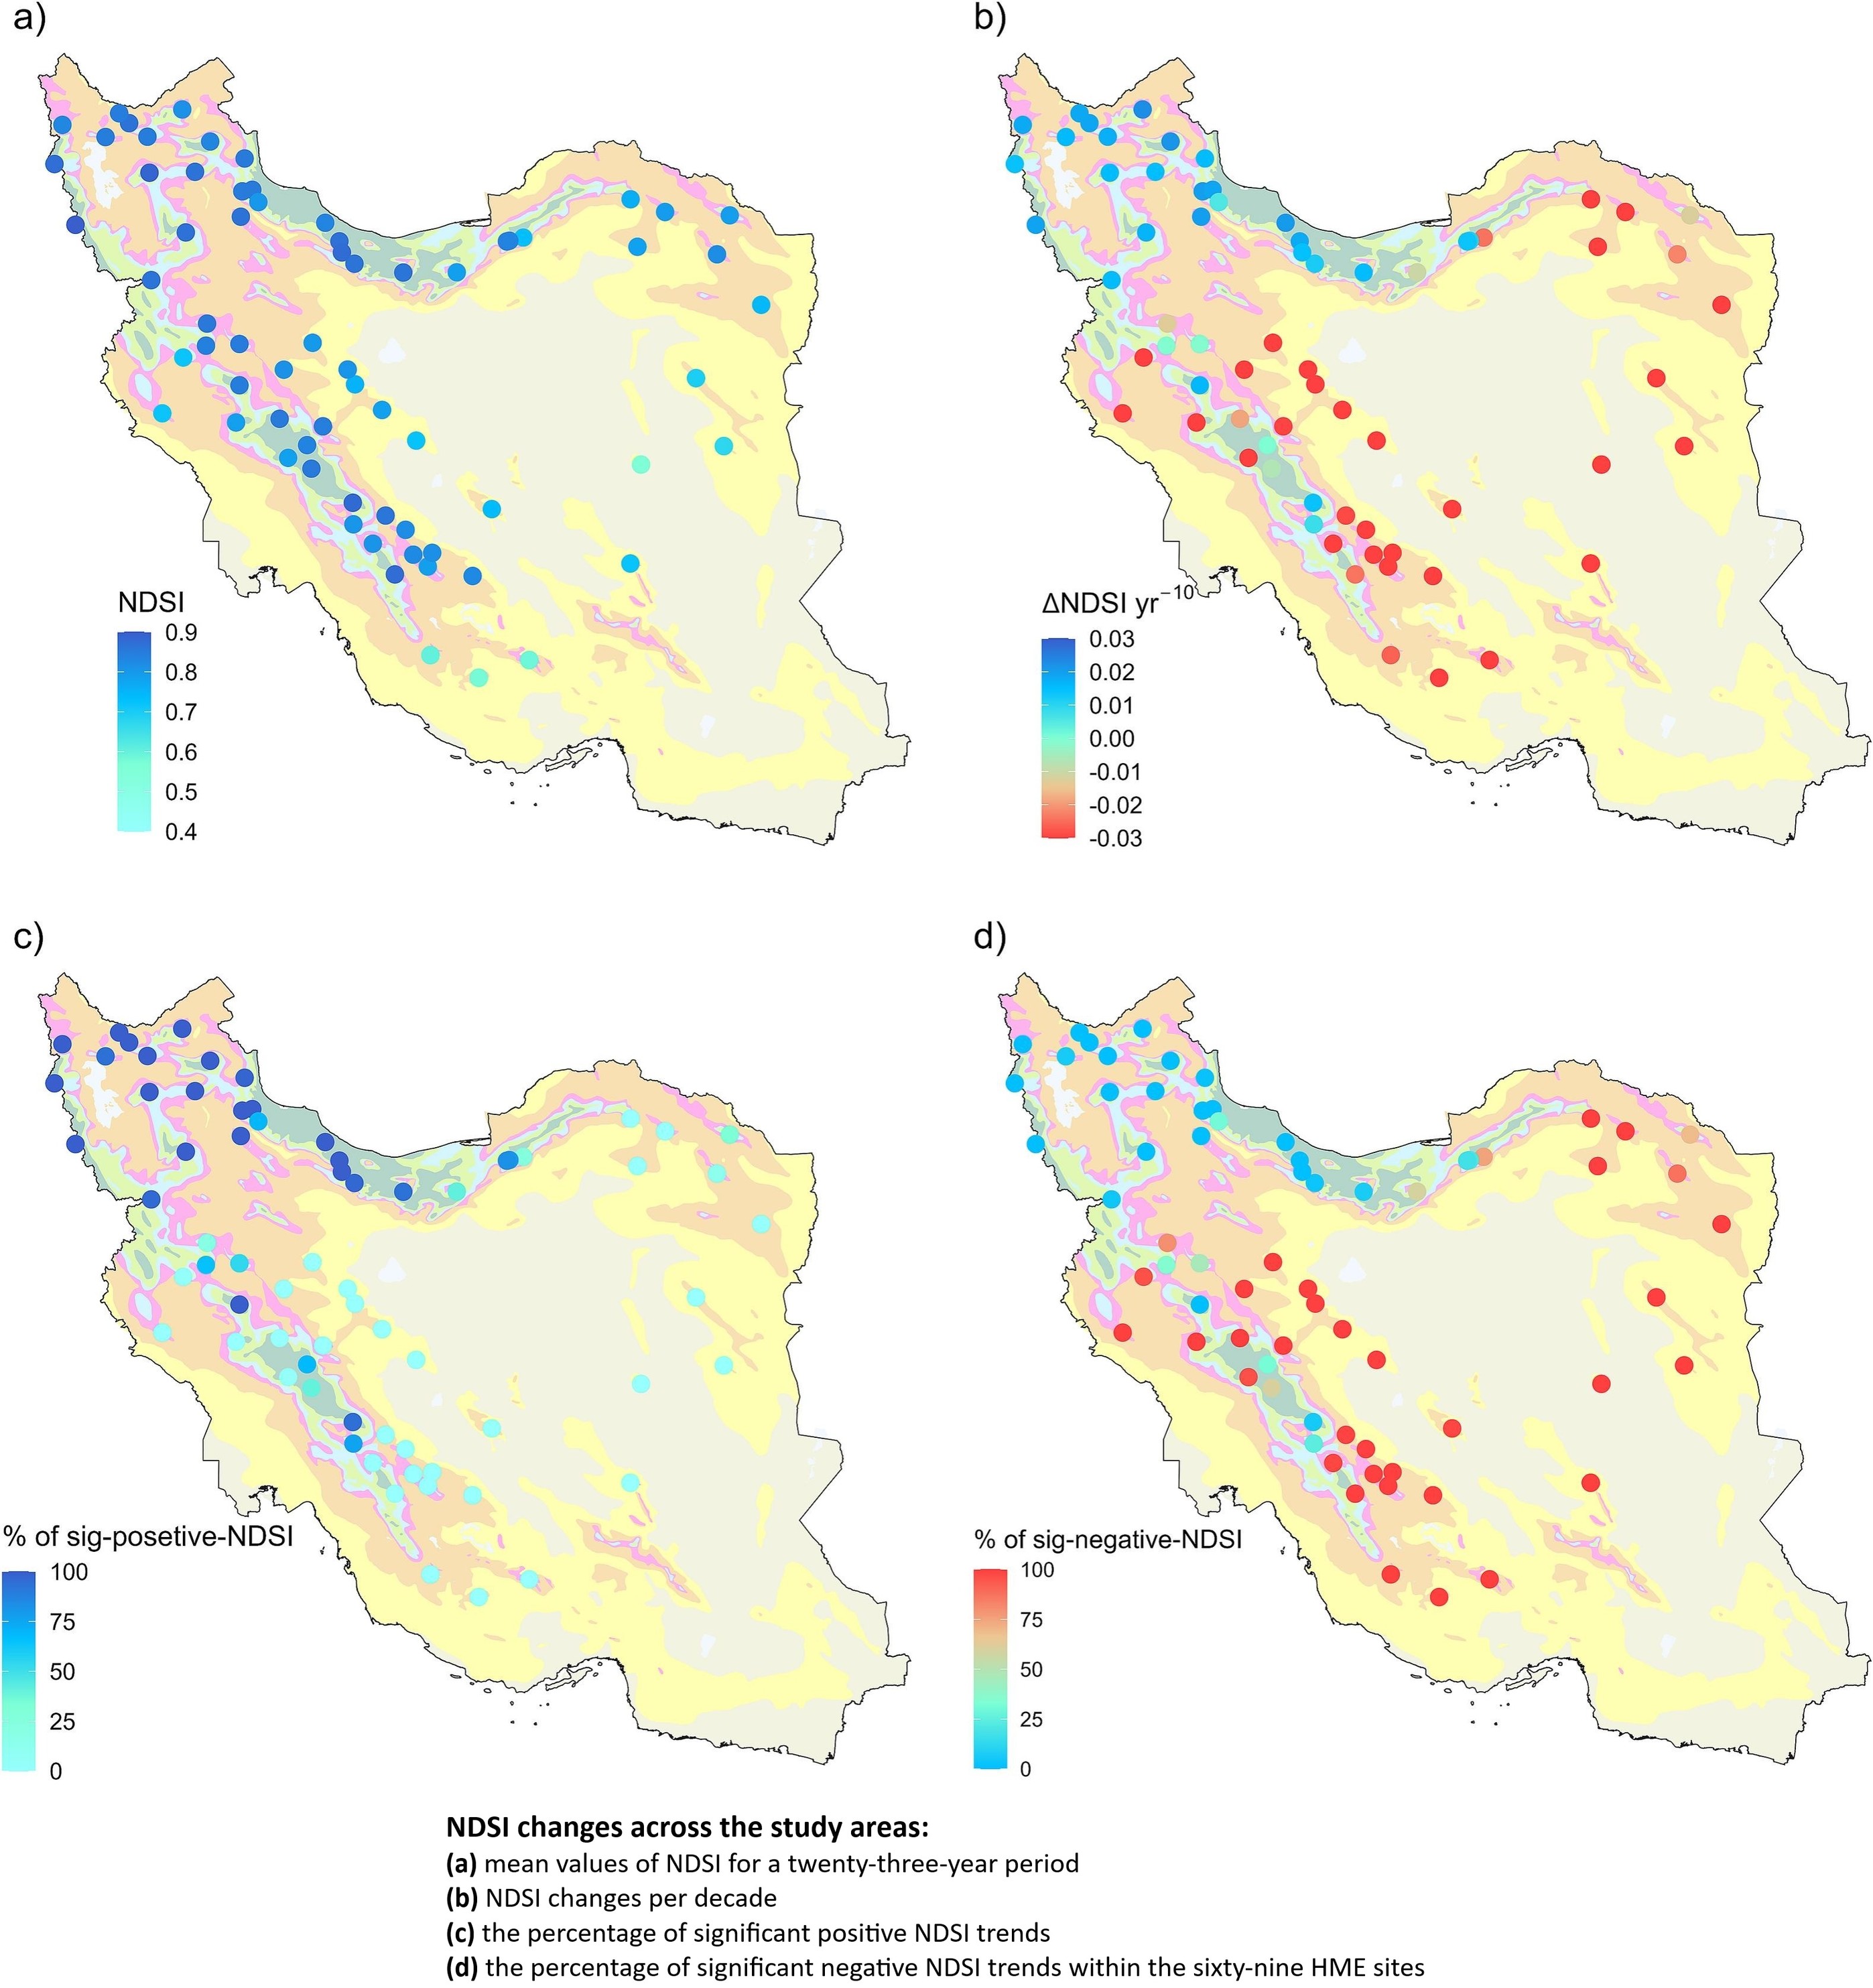
Assessment Of Snow Cover Dynamics And The Effects Of Environmental Drivers In High Mountain Ecosystems
--
https://doi.org/10.1016/j.eiar.2025.107969 <-- shared paper
--
#GIS #spatial #mapping #remotesensing #earthobservation #snow #ice #snowcover #dynamics #climatechange #mountains #ecosystems #spatialanalysis #spatiotemporal #MODIS #model #modeling #extremeweather #water #hydrology #climate #zones #trendanalysis #linearregression #RandomForest #cryosphere

"Satellite-based evidence of recent decline in global forest recovery rate from tree mortality events" by Yuchao Yan et al 2025.
Fascinating and educational. All the more for us in Germany and Finland, and likely other Europeans, whose forests morphed from CO2 sink to source. The study ends with 2020 data tho, Europe with 2018.
Only non-fire mortality events were analyzed.
I learned how recovery after a drought-driven forest mortality event depends on🌡️💧during recovery; not so much the event severity.
https://www.nature.com/articles/s41477-025-01948-4
Free e-pdf provided by one of the authors:
https://rdcu.be/eigV4
Don't know about you but to me, a paper is particularly "good" if I'm left with a host of new pressing questions. "Why did they..? Was it maybe ..? What if it had been...?"
For a recovery phase, they differentiate between recovery of the canopy greening and recovery of water content in the canopy. Both are based on satellite obs only. And if a satellite image suggests greening is recovered to pre-mortality level, it might not actually be re-greening from recovered old or new young trees but could be merely dense shrubbery. The Greening parameter is often used to glean carbon stock. Shrubs have less biomass=less carbon than trees.
The water content in the canopy then somehow helps to clarify the actual recovery state. How? 🤷♀️
Water content in canopy always takes far longer to recover than re-greening.
Longer = years and years longer.
Always = in the 1980s as well. Which I take as: that's the normal baseline behaviour for a given biome, a given latitude zone, a given climate zone, a given elevation, a given human intervention etc.
Supplementary Fig. 5. c and d show numbers for North America and Tropics https://static-content.springer.com/esm/art%3A10.1038%2Fs41477-025-01948-4/MediaObjects/41477_2025_1948_MOESM1_ESM.pdf .
Recovery Time in years for water in canopy in North America
in the 1990s took 2 - 12, average 6.
in the 2000s took 2 - 18, average 9.
in the Tropics:
in the 1990s took 2 - 12, average 6.
in the 2000s took 2 - 11, average 7.
Europe is missing an extra whiskers plot. Maybe they saved this for their next paper. But European events are included up to 2018, if I got it right.
With all the factors to be considered, and bias in numbers of events in any given factor, making recovery comparable across regions, across biomes, across climate zones, a global average doesn't seem very useful.
However, here are the global numbers from Figure 1d for
Recovery time RT for water in canopy. In the 1980s RT was between 2 and 15, average 8, median 6 .
In the 1990s, RT was 2 - 22, average 8, median 6.
In the 2000s, RT was 2 - 20, average 9, median 9 years.
Am curious wrt the missing potential cause for the greatly reduced RecoveryTime in the 2010s in Fig.1d. Is that an artefact of the shortened observation time for these 10 most recent mortality yrs?
And Greening recovered astonishingly quickly in the 2010s. is it the high CO2 fertilisation or a regional bias from the events in this period?
#climate #ecosystem #drought #forest #satellite #MODIS #ForestMortality
SciTech Chronicles. . . . . . . . .Feb 4th, 2025
#Graphene #Tattoos #Biosensors #epidermal #Boreal #MODIS #Migration #Tundra #exudates #methanogens #SUSIBA2 #fumarate #ethanol #Fibre-optic #DAS #axis #algorithm #Honeybee #Varroa #timeframe #adherence #treatment
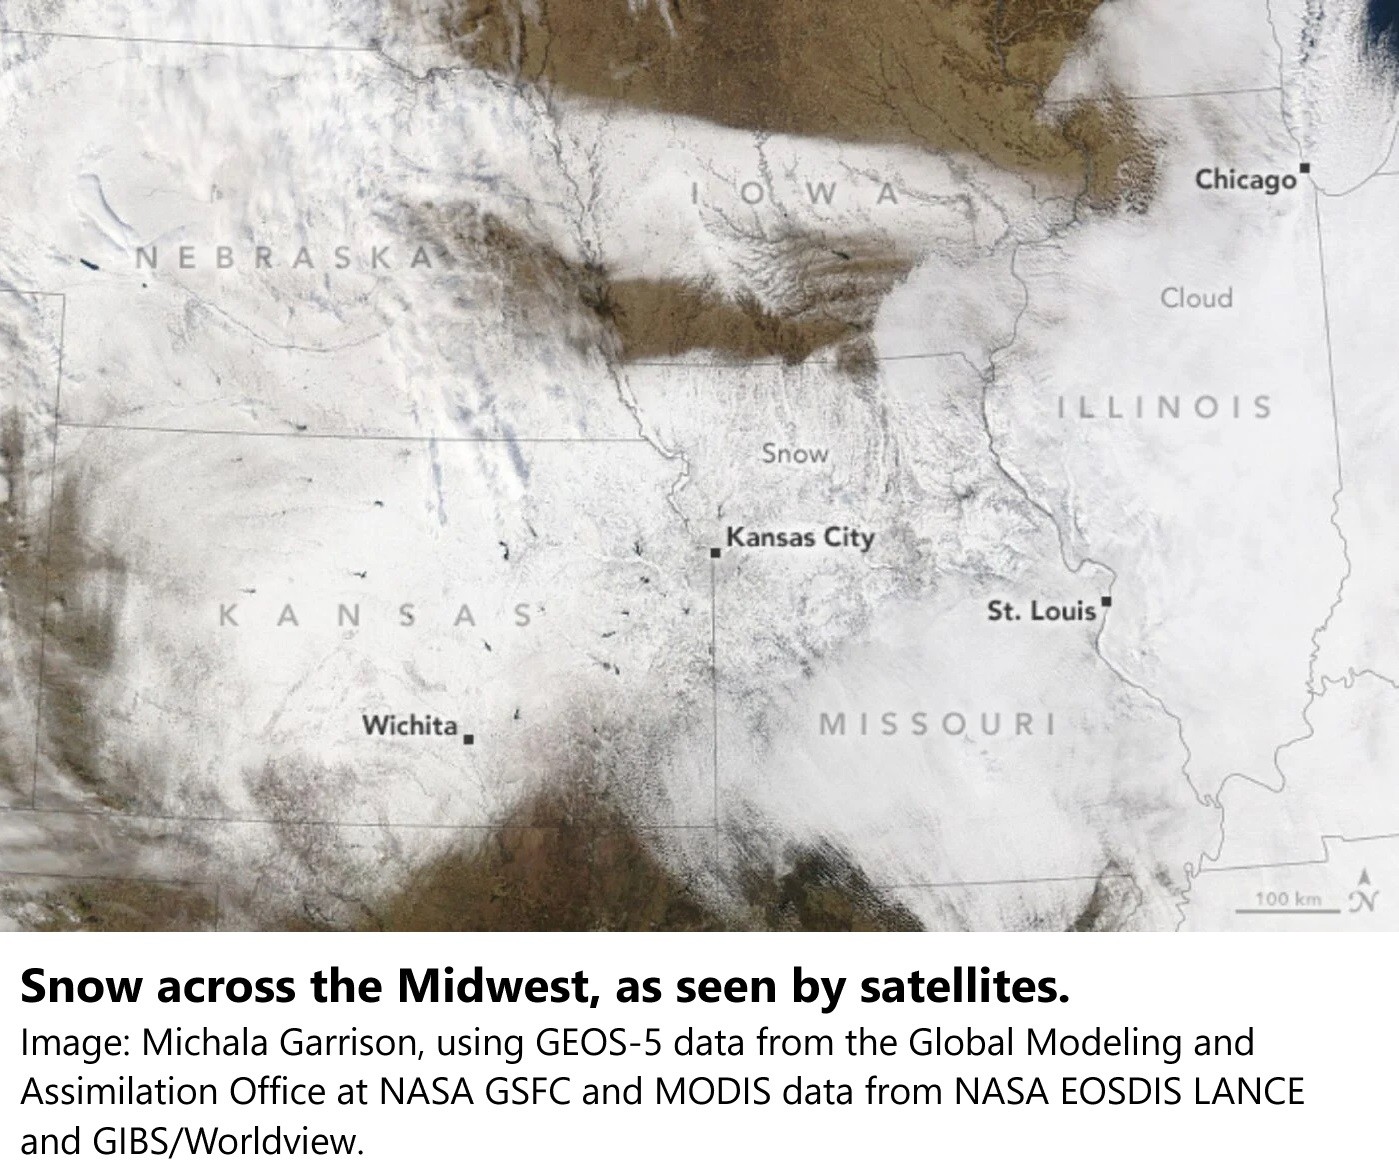
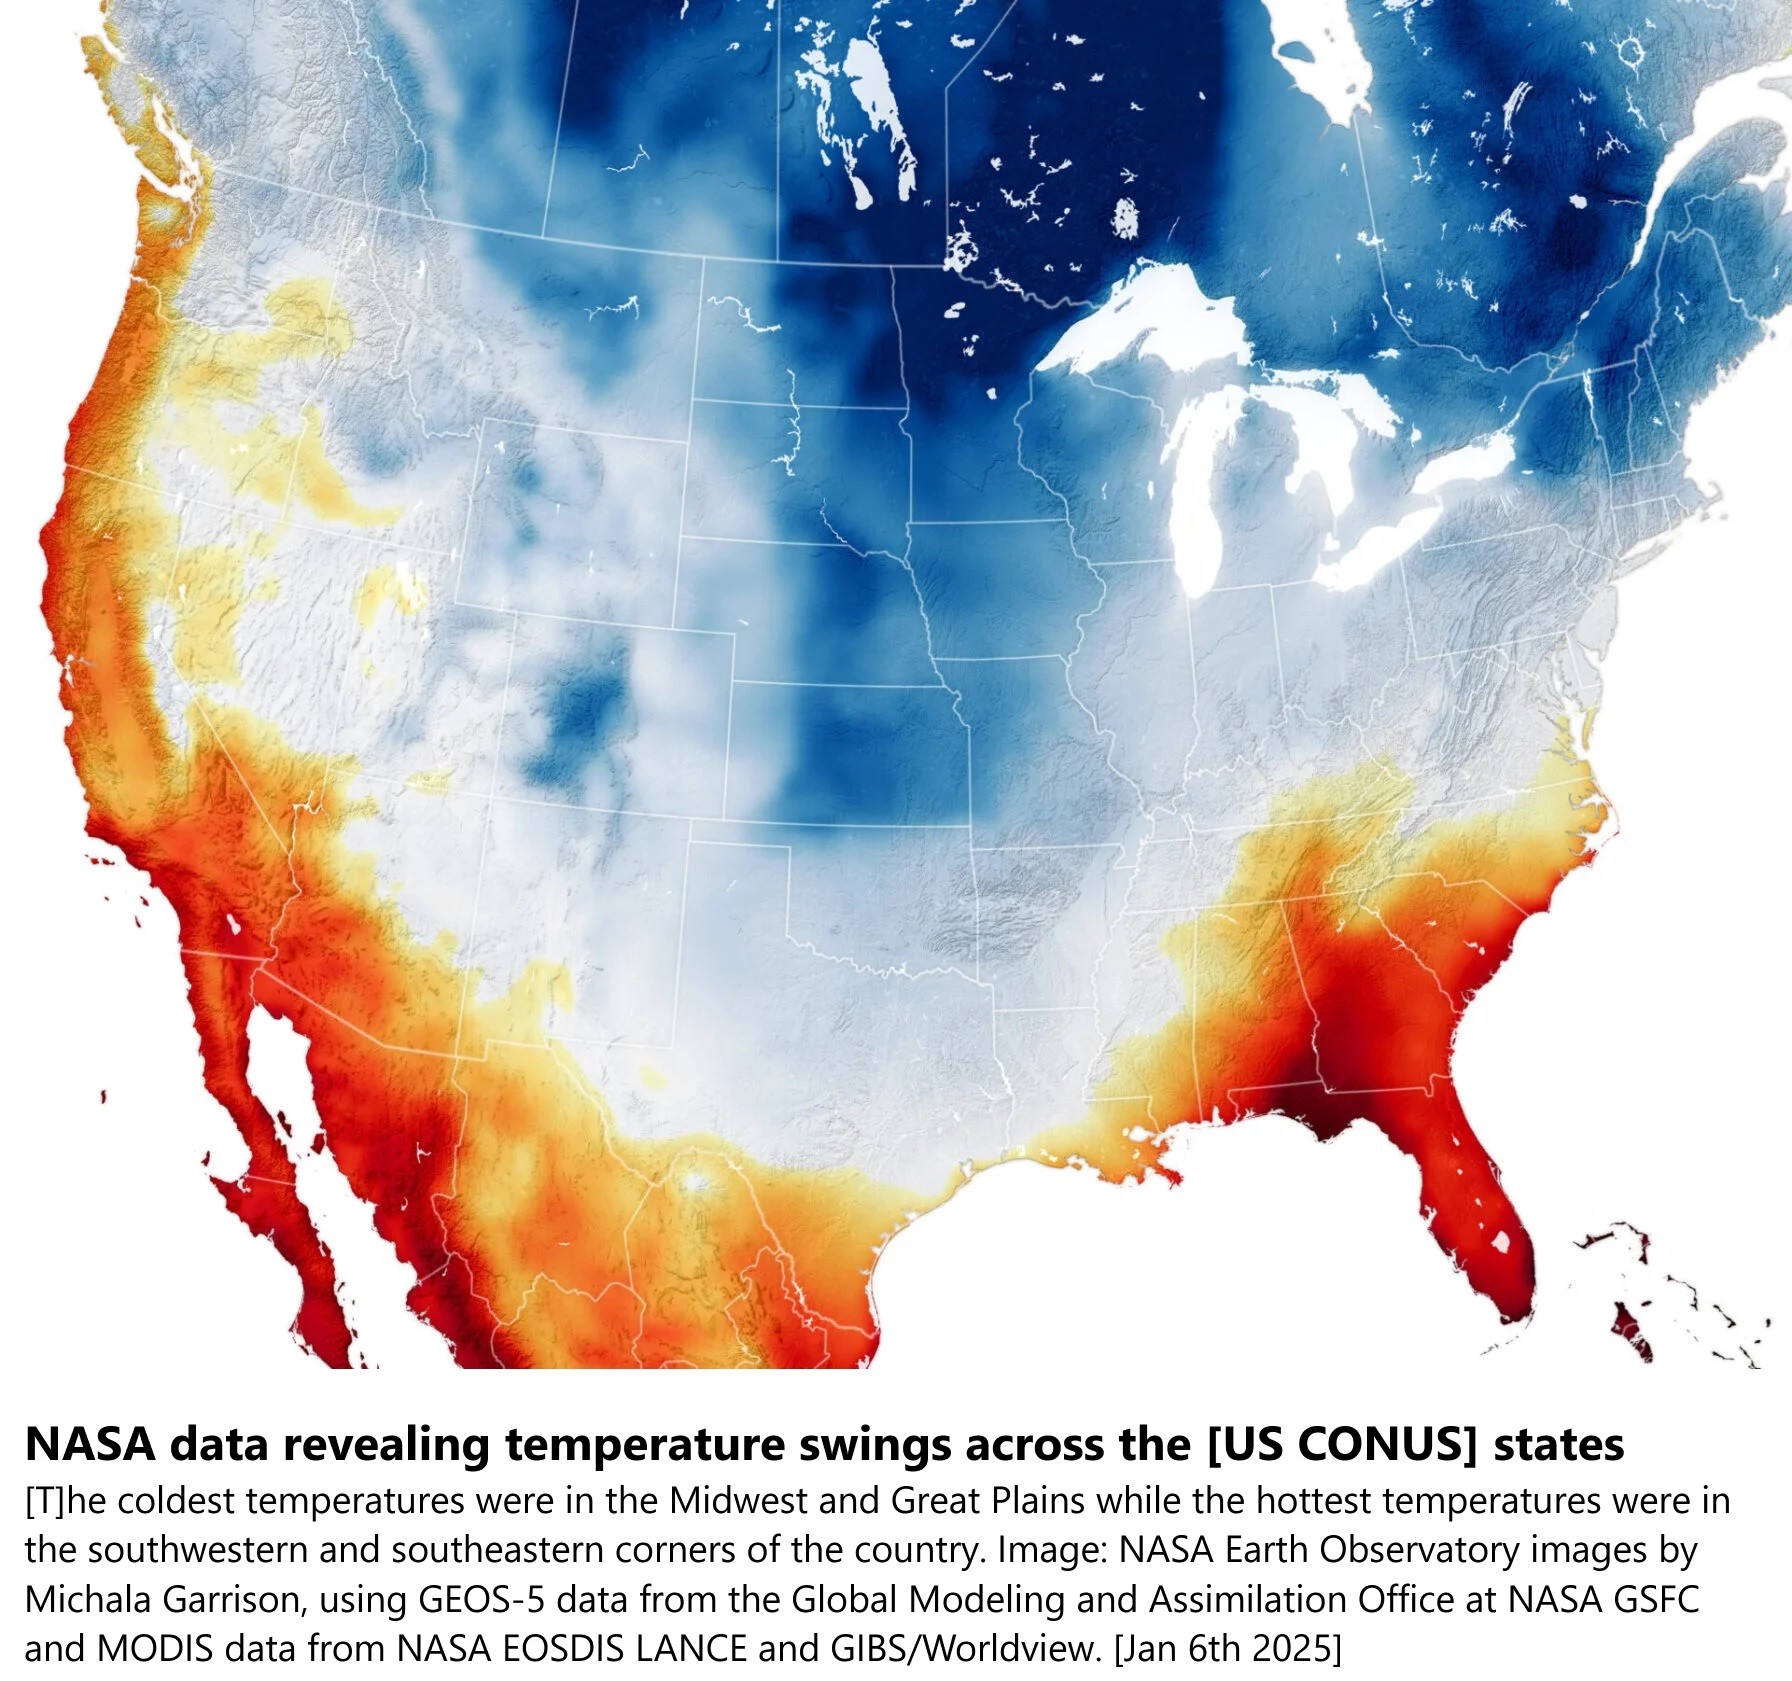
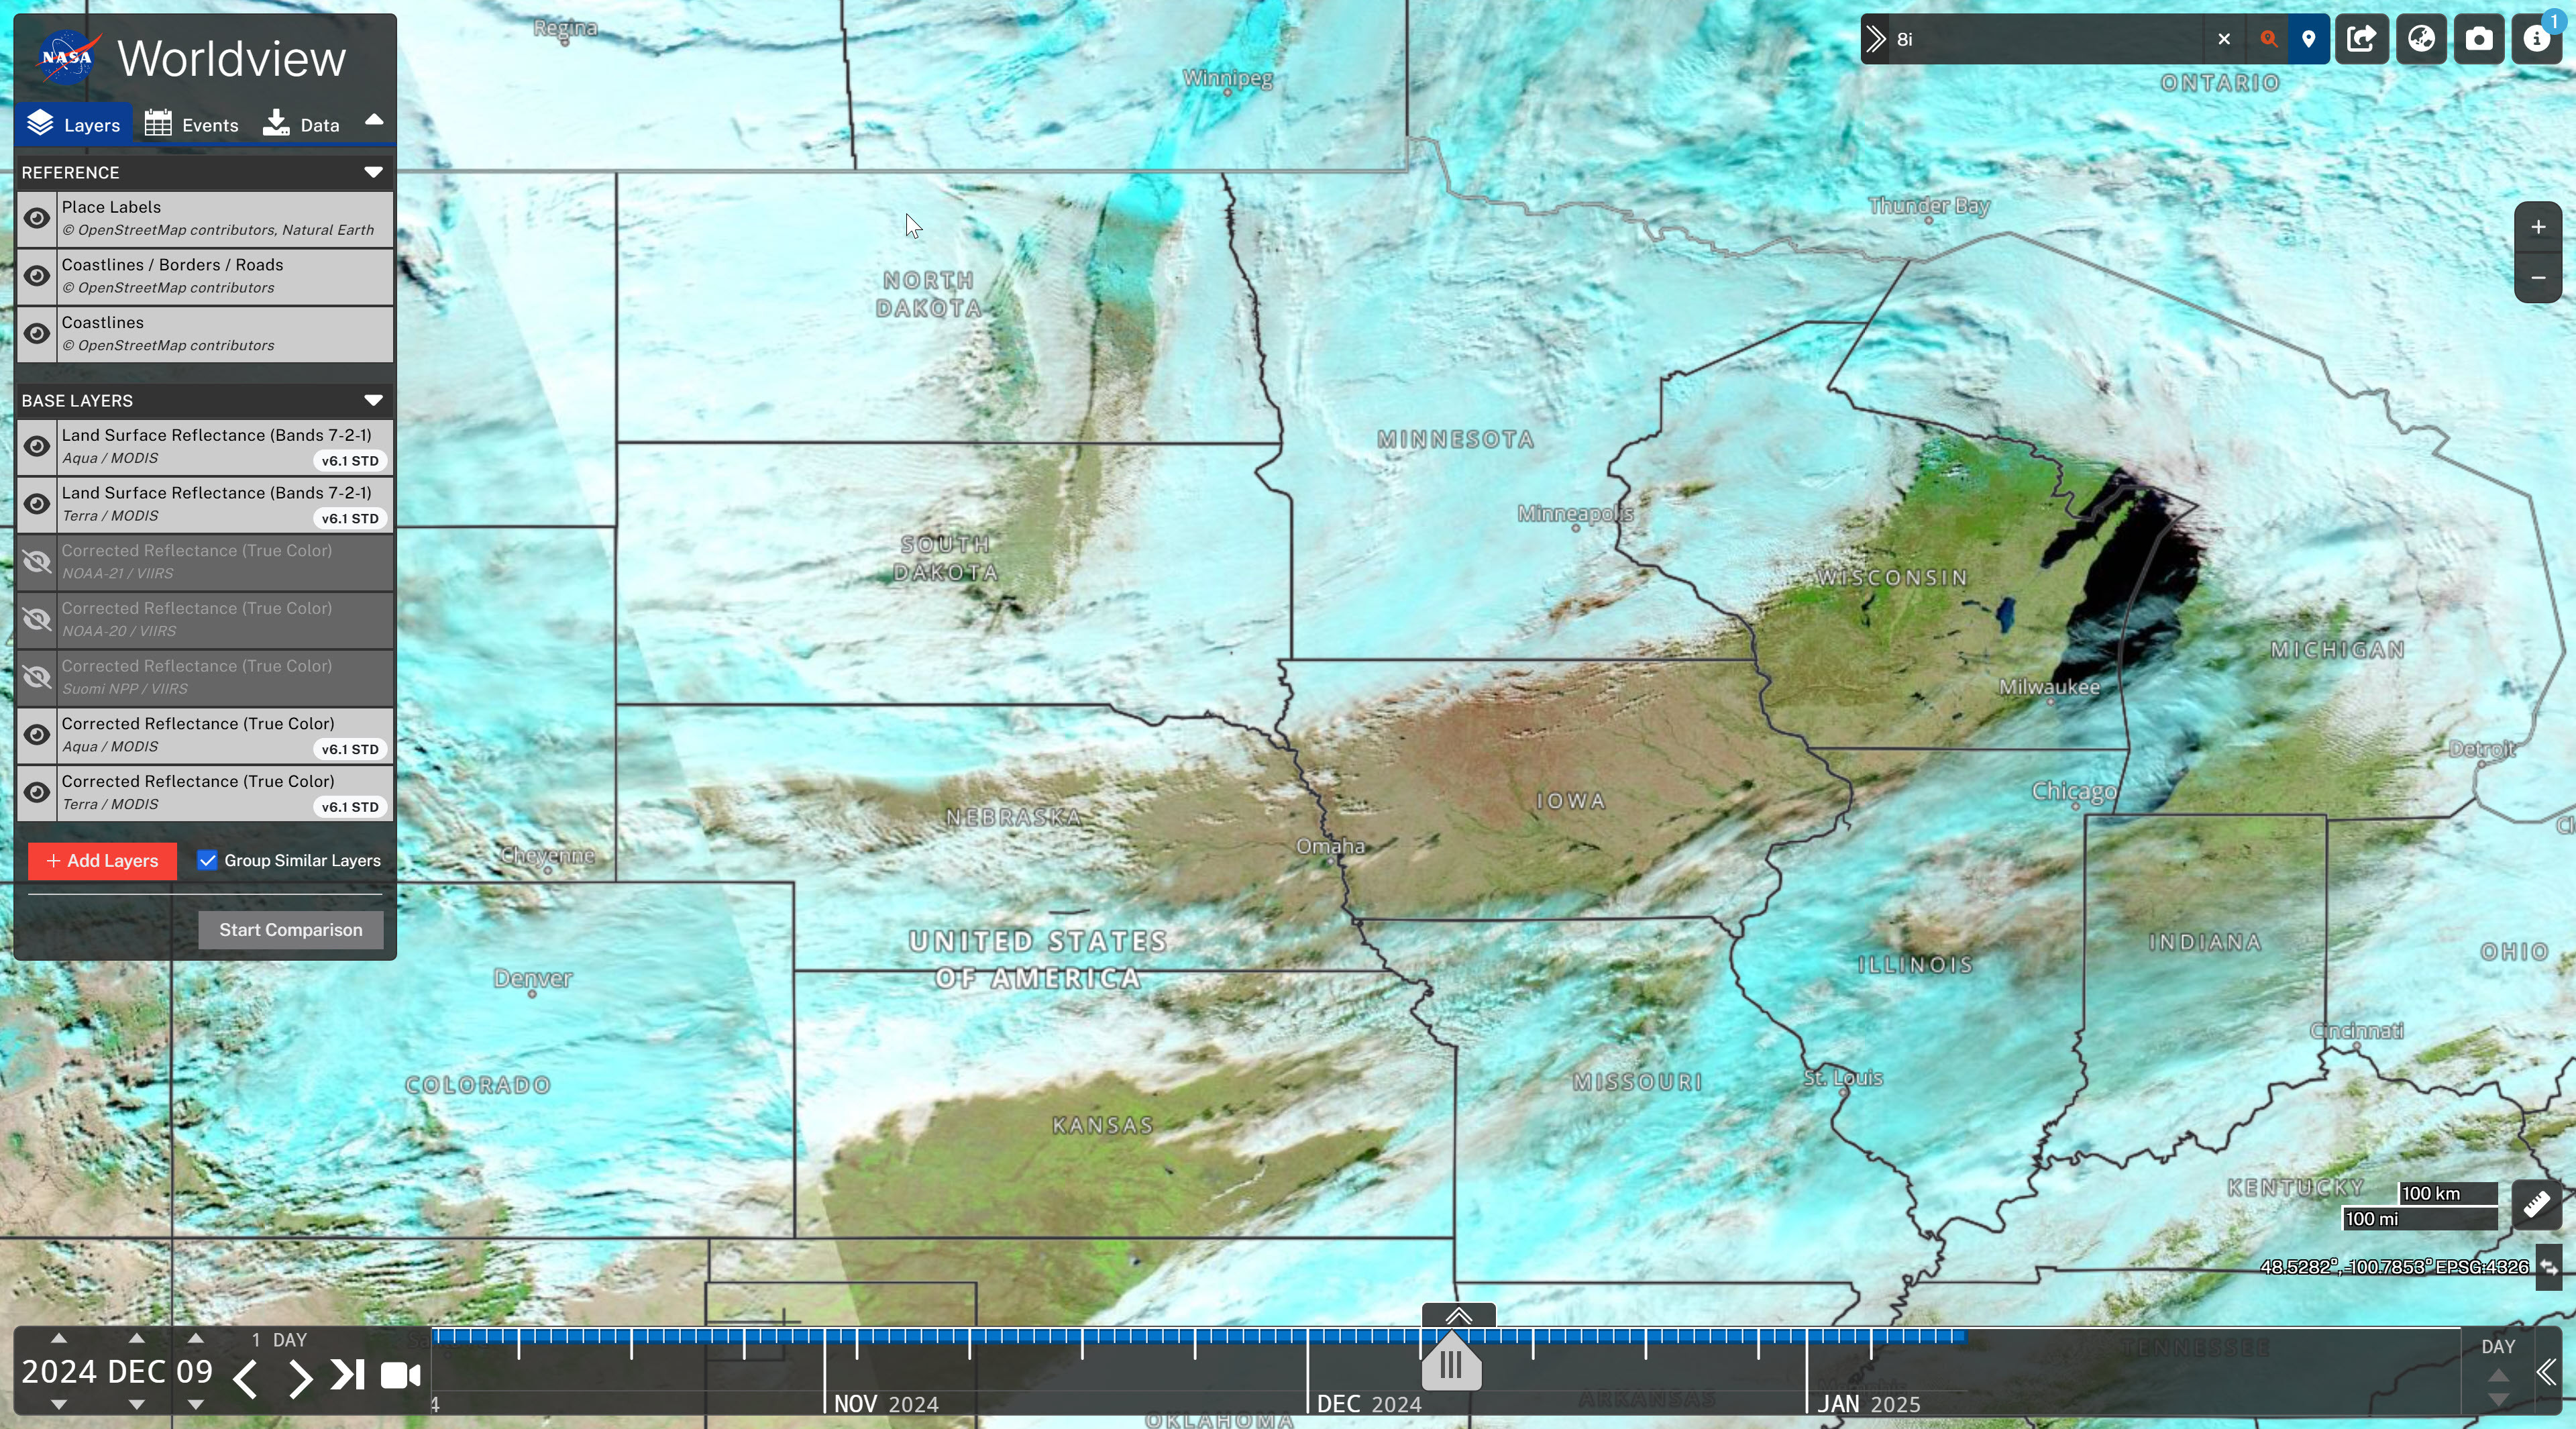
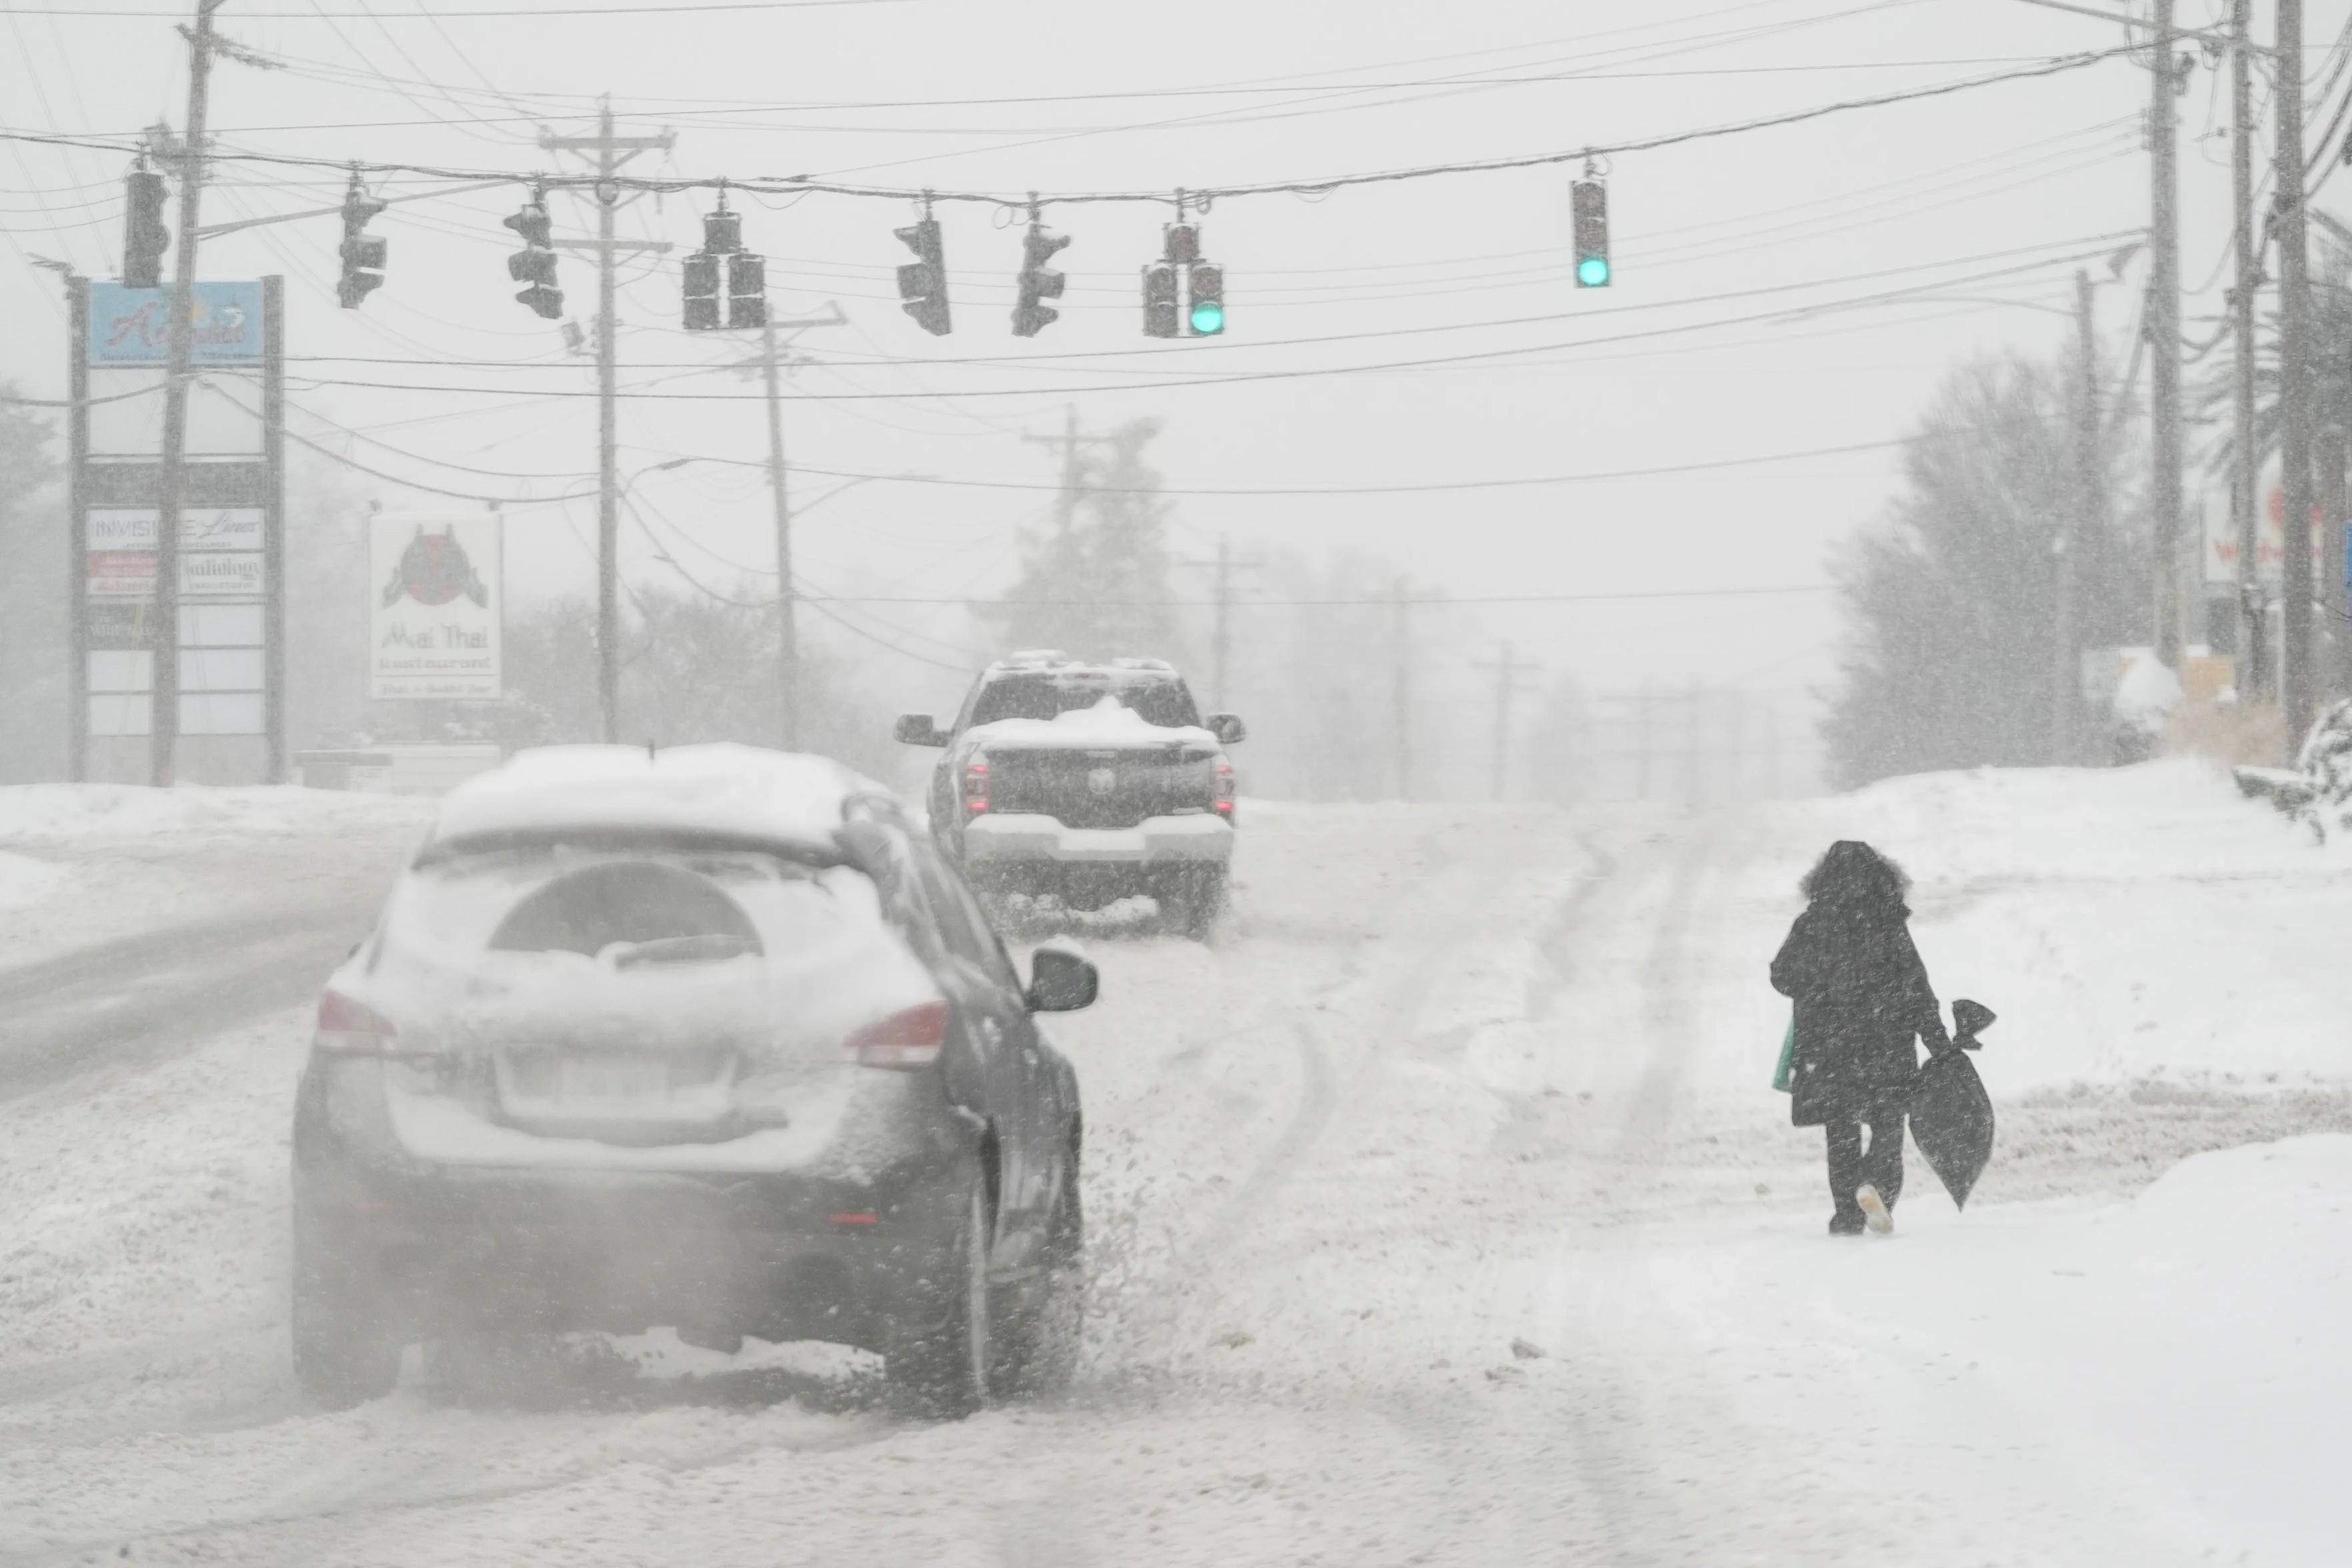
NASA Satellite Captures Stunning Snow-Covered Midwest After Polar Vortex Blast
--
https://gizmodo.com/nasa-satellite-captures-stunning-snow-covered-midwest-after-polar-vortex-blast-2000547530 <-- shared media article
--
https://worldview.earthdata.nasa.gov/ <-- NASA WorldView
--
#GIS #spatial #mapping #snow #winter #weather #MidWest #polarvortex #NASA #WorldView #remotesensing #MODIS #aqua #satellite #GEOS #GEOS5 #EOSDIS #LANCE #EarthObservatory
@nasa
Due to #Eaton #WildFire mandatory evacuation orders at the Jet Propulsion Laboratory (#JPL) in #Pasadena, #California, processing of certain visualization products have been halted. This includes visualization products from #SMAP, #MLS, #GHRSST, #OSCAR sea surface currents, and some #MODIS Terra and Aqua Sea Surface Temperature products.
Next month at #AGU24.
A multi-scale study assessing snow albedo variability in mountain terrain.
Using #MODIS satellite data, AVIRIS-NG airborne spectroscopy, and ground-based measurements, they aim to improve the characterization of snow surface properties and albedo in complex environments, addressing limitations in coarse #satellite observations.

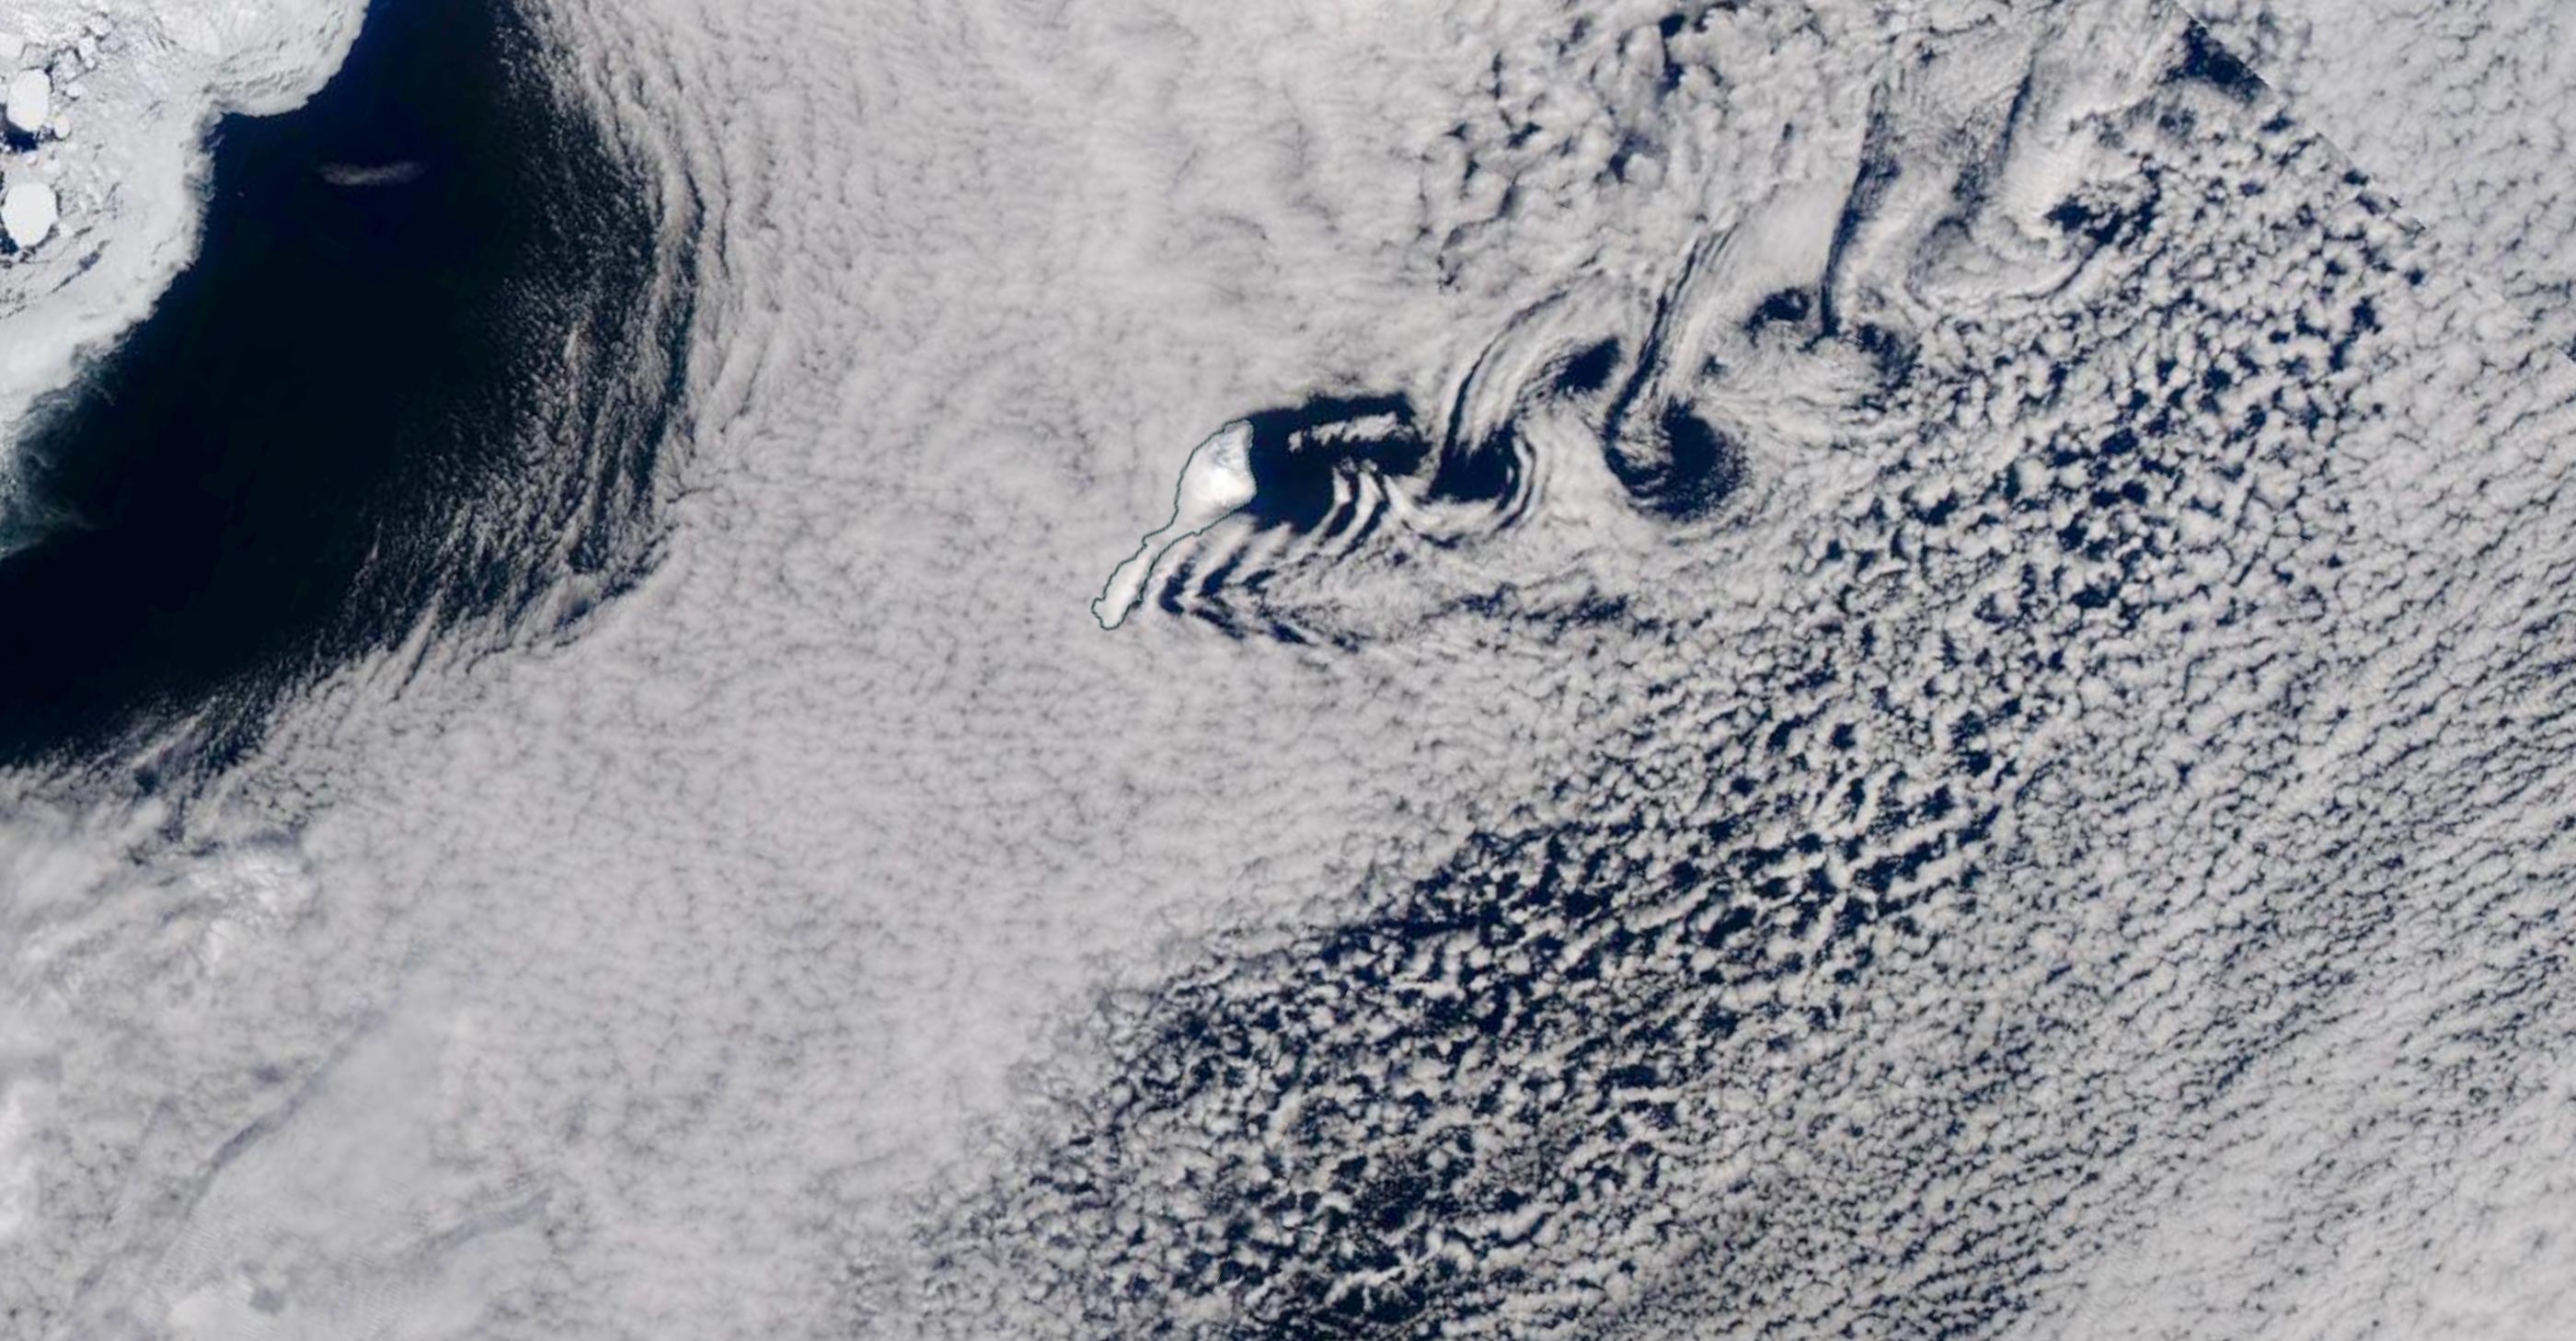
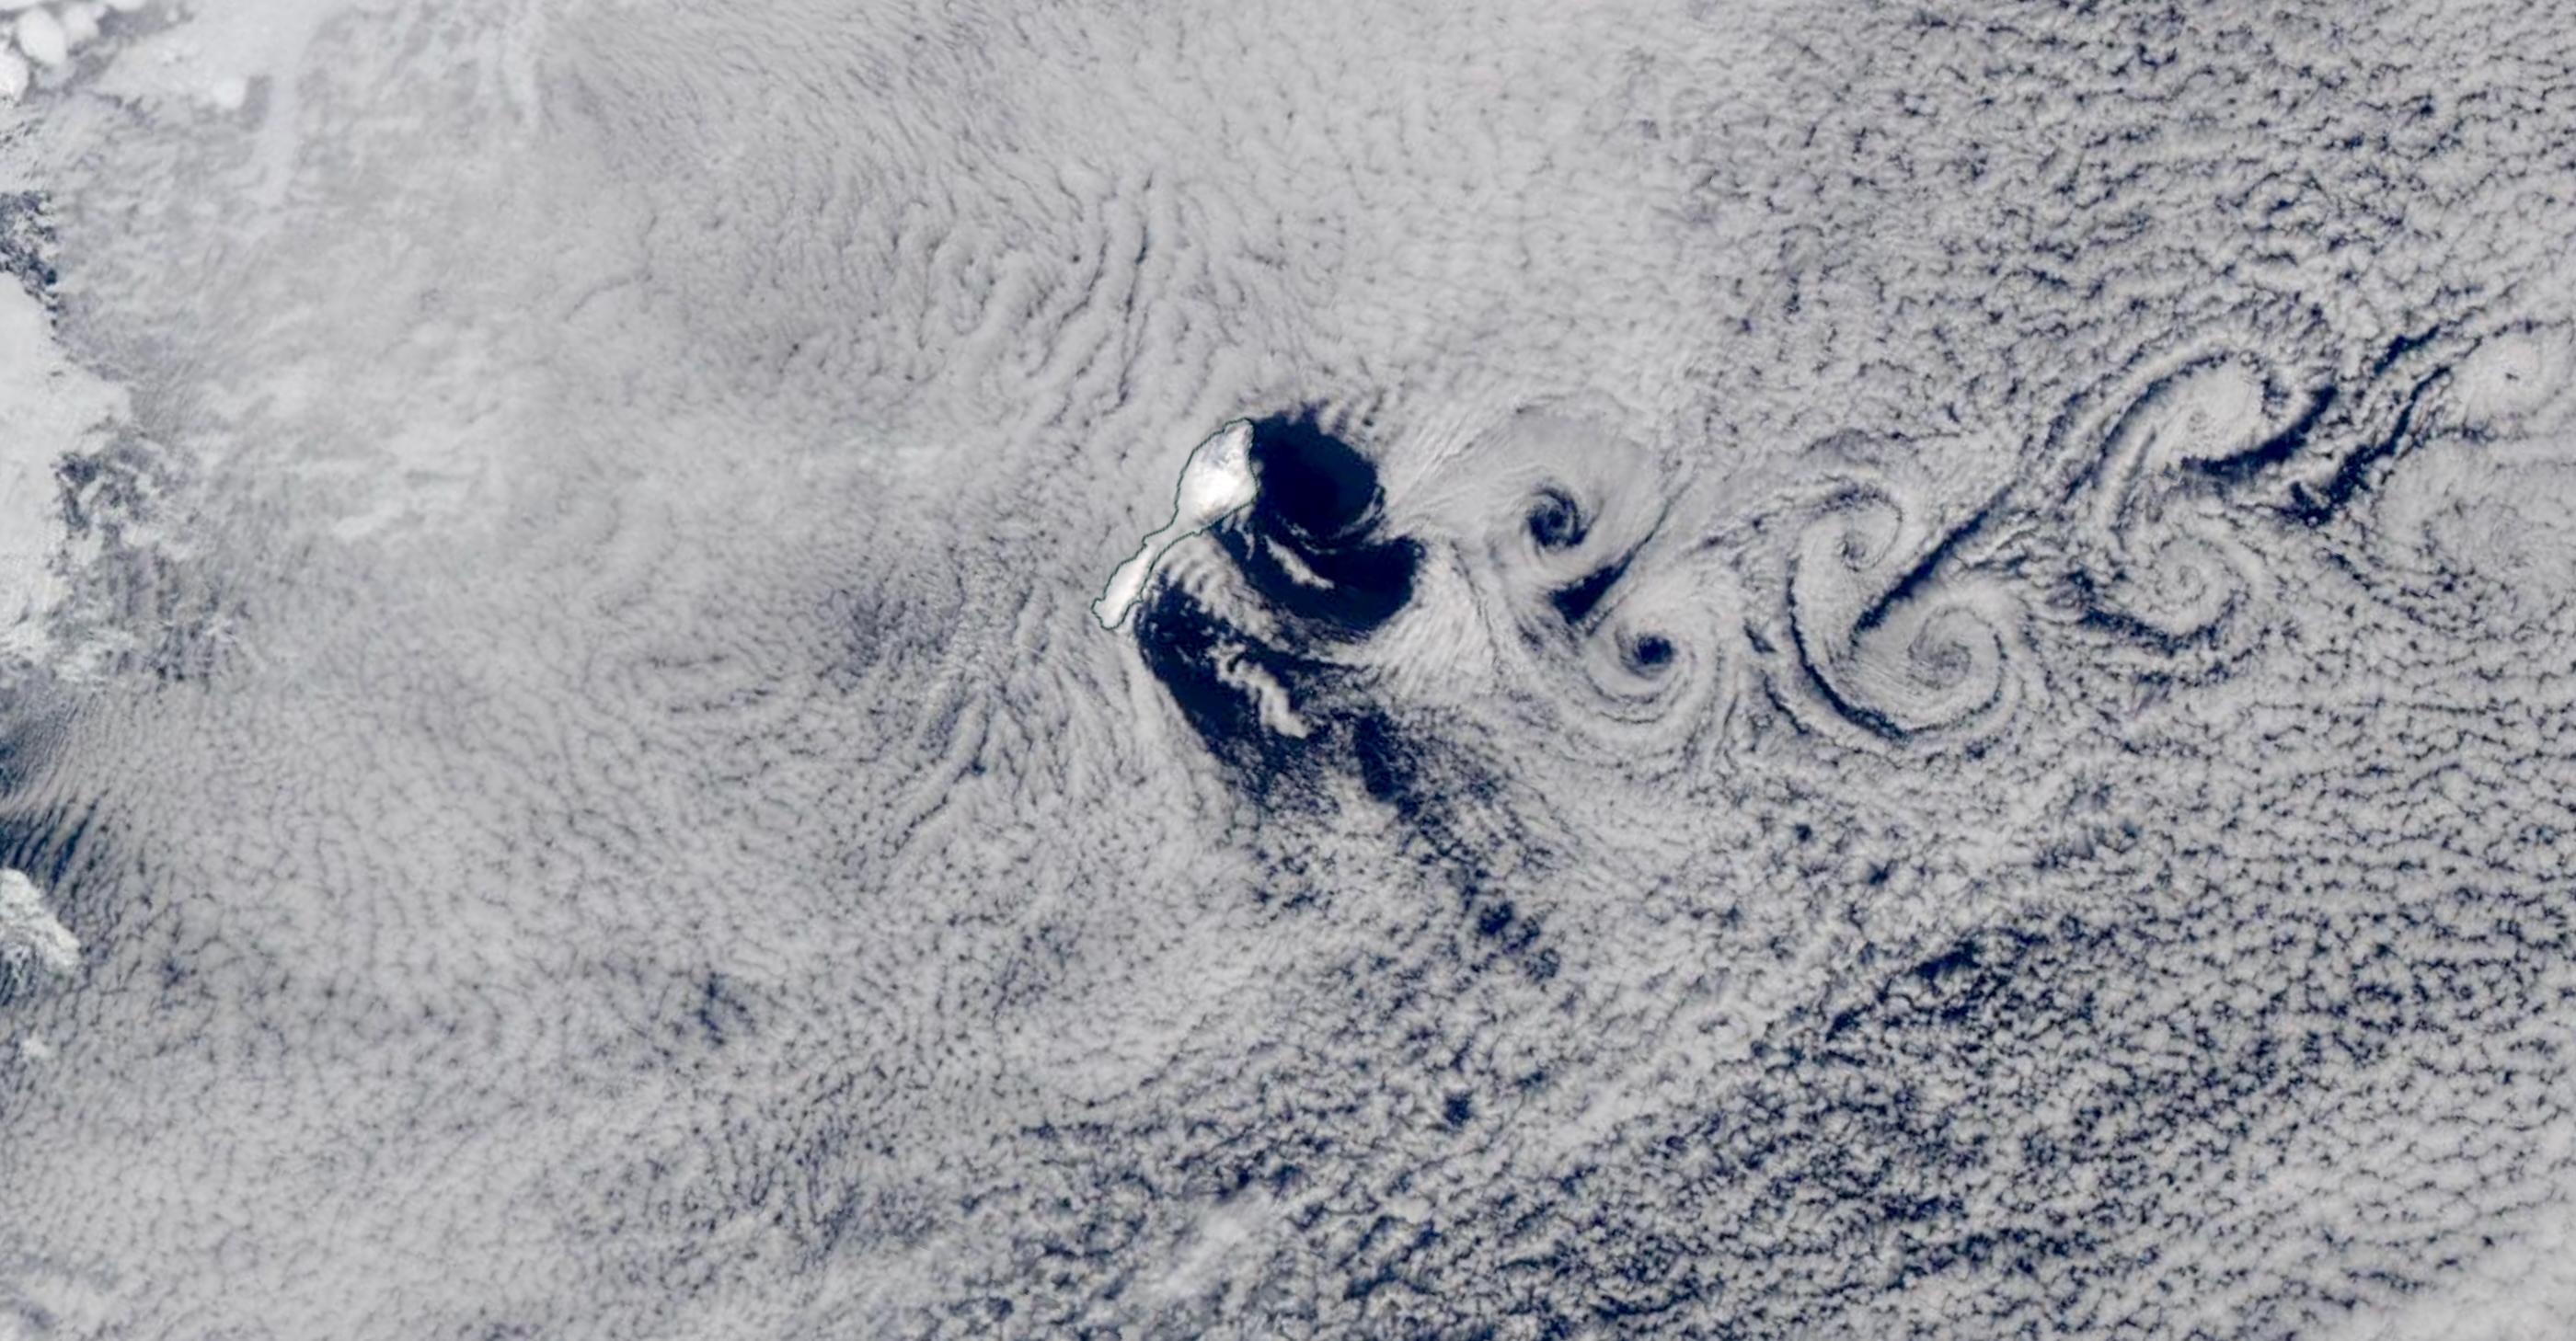
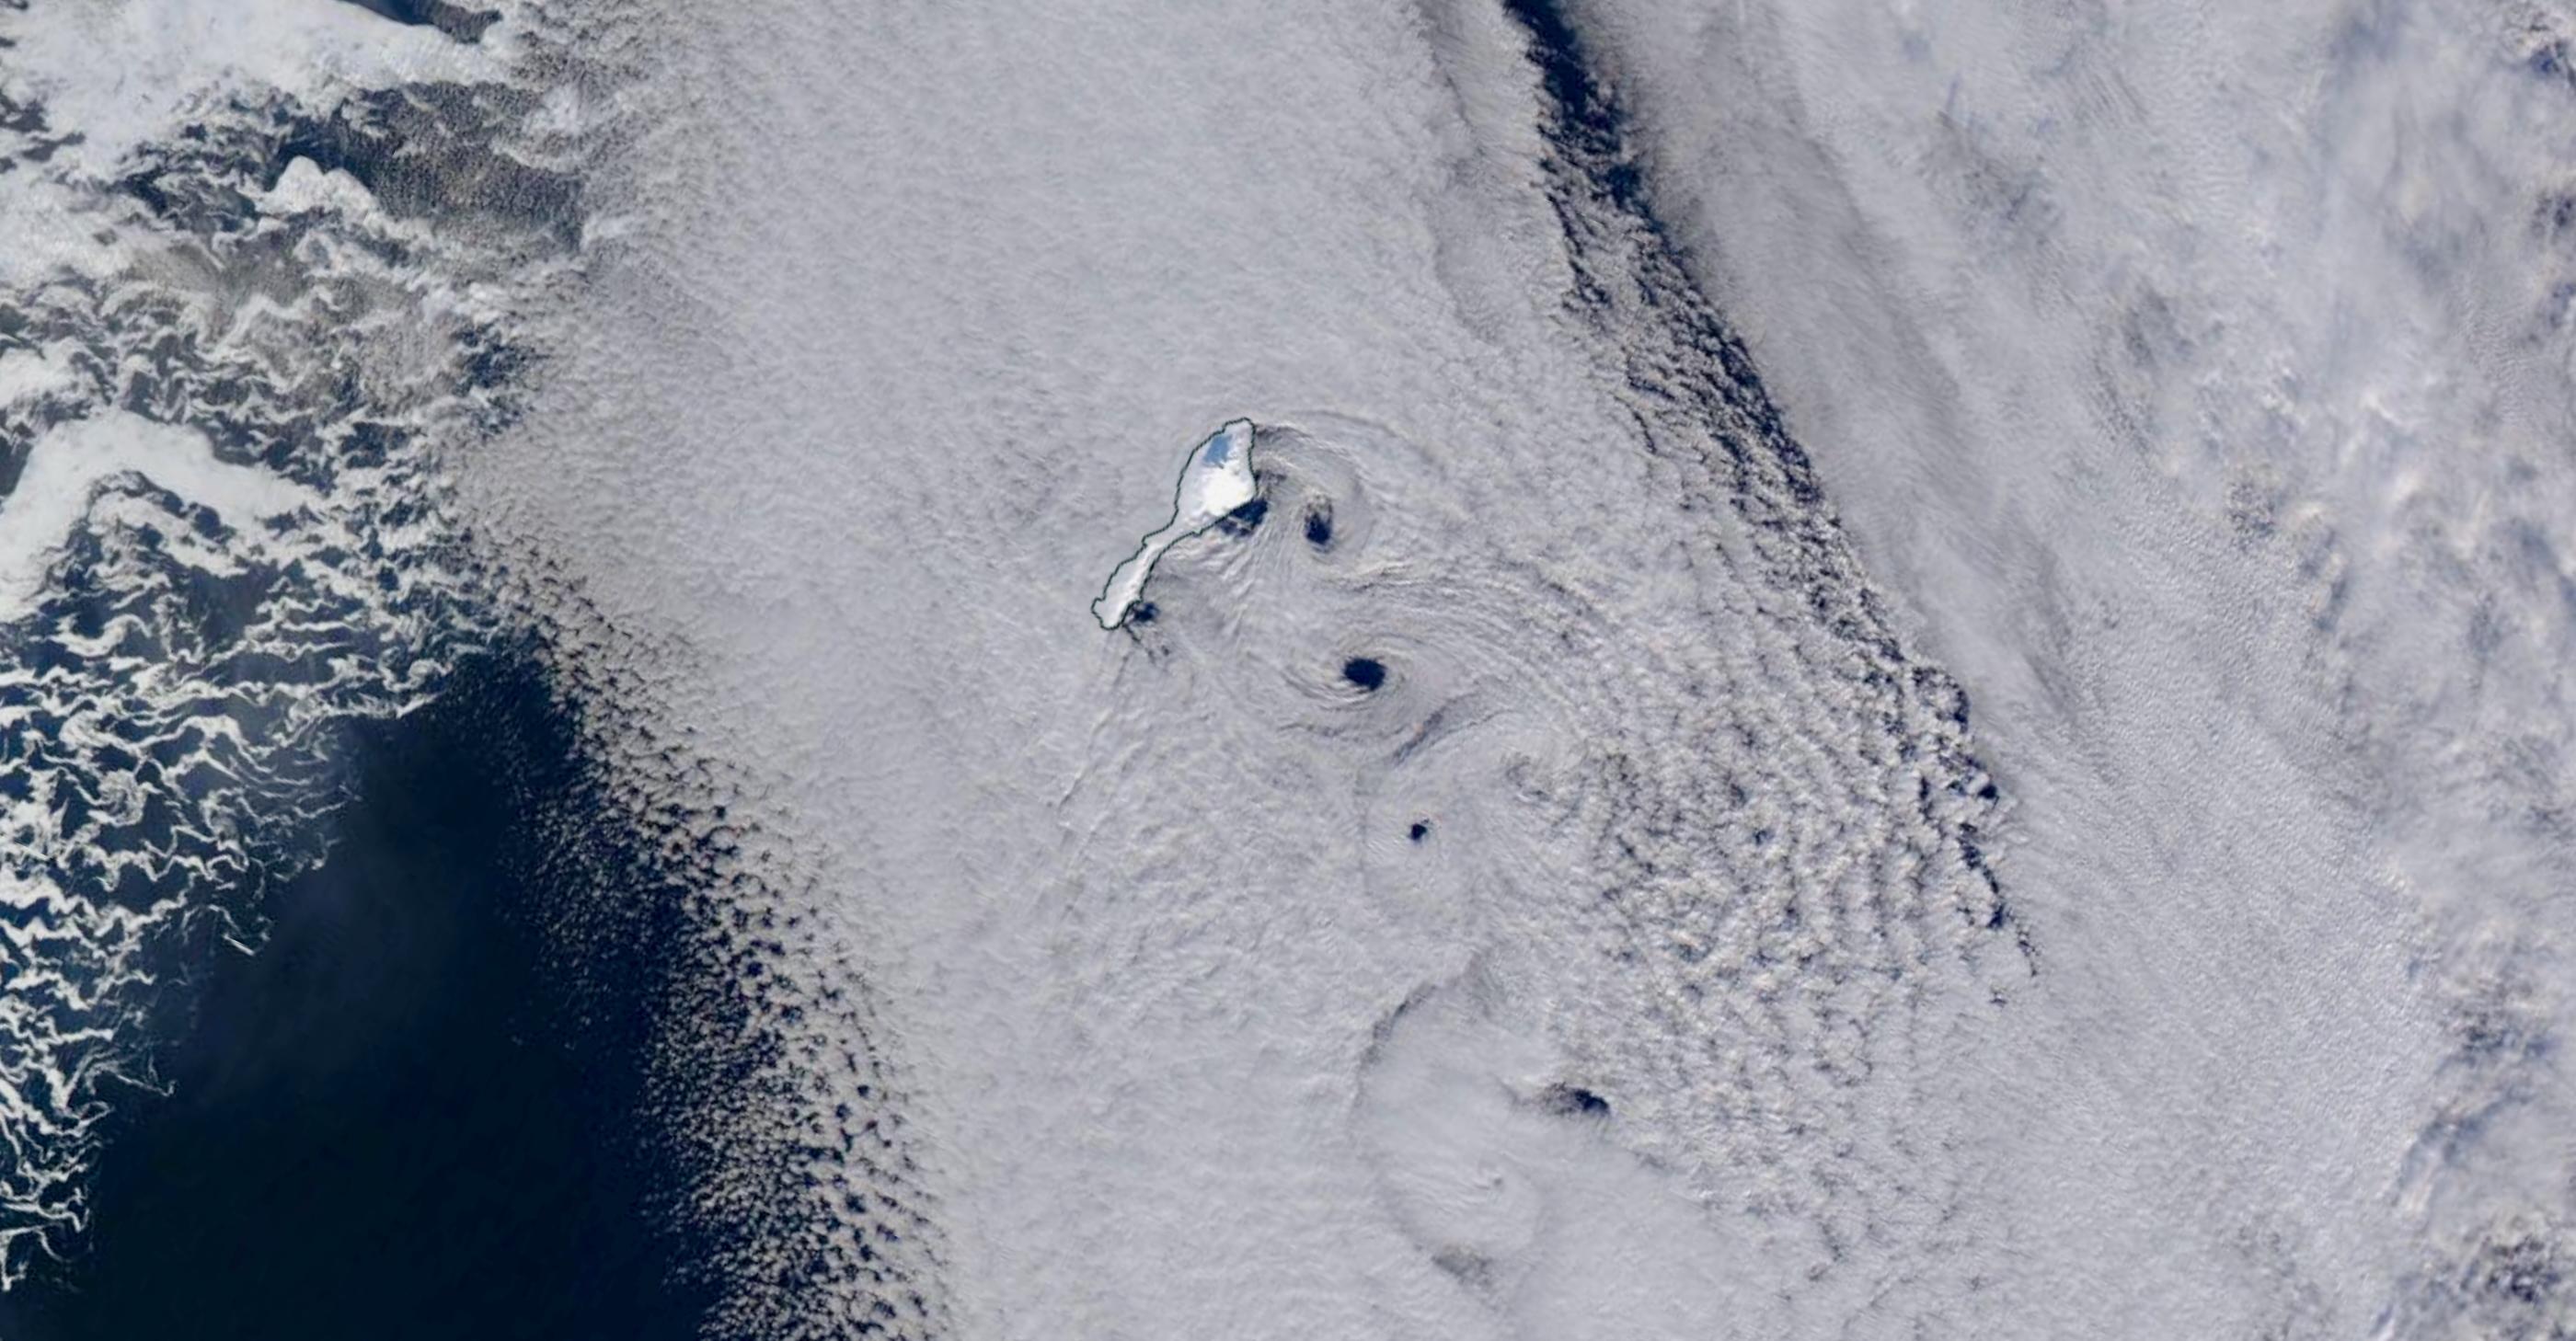
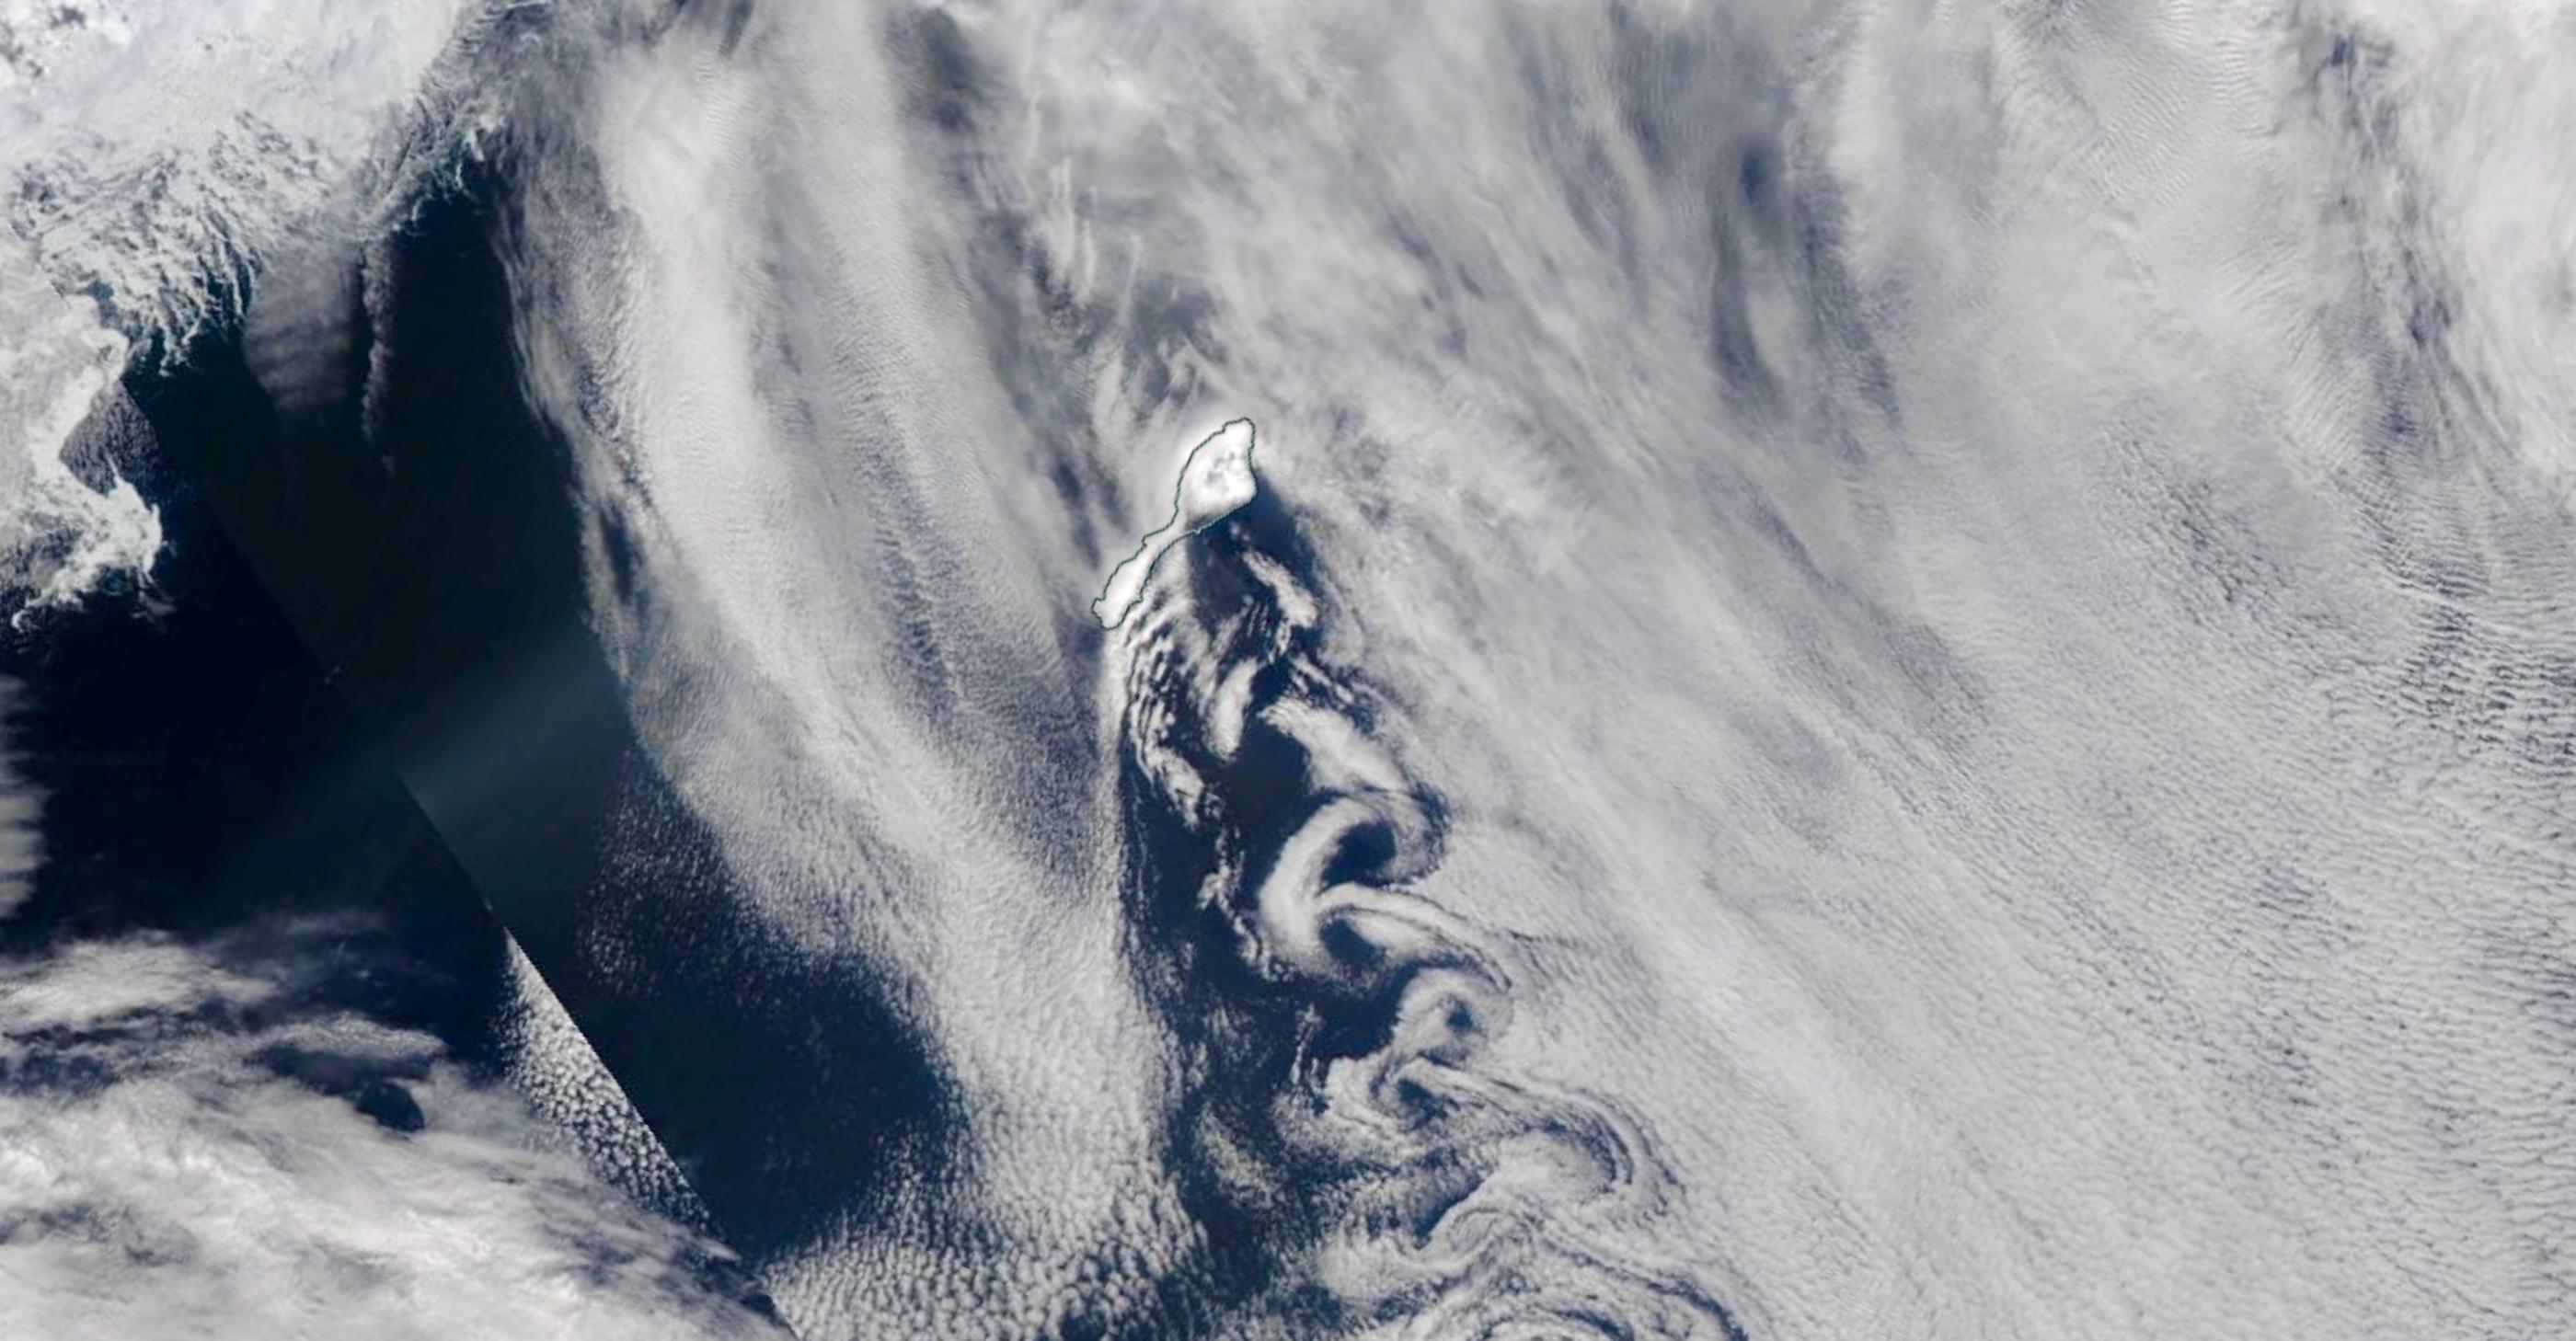
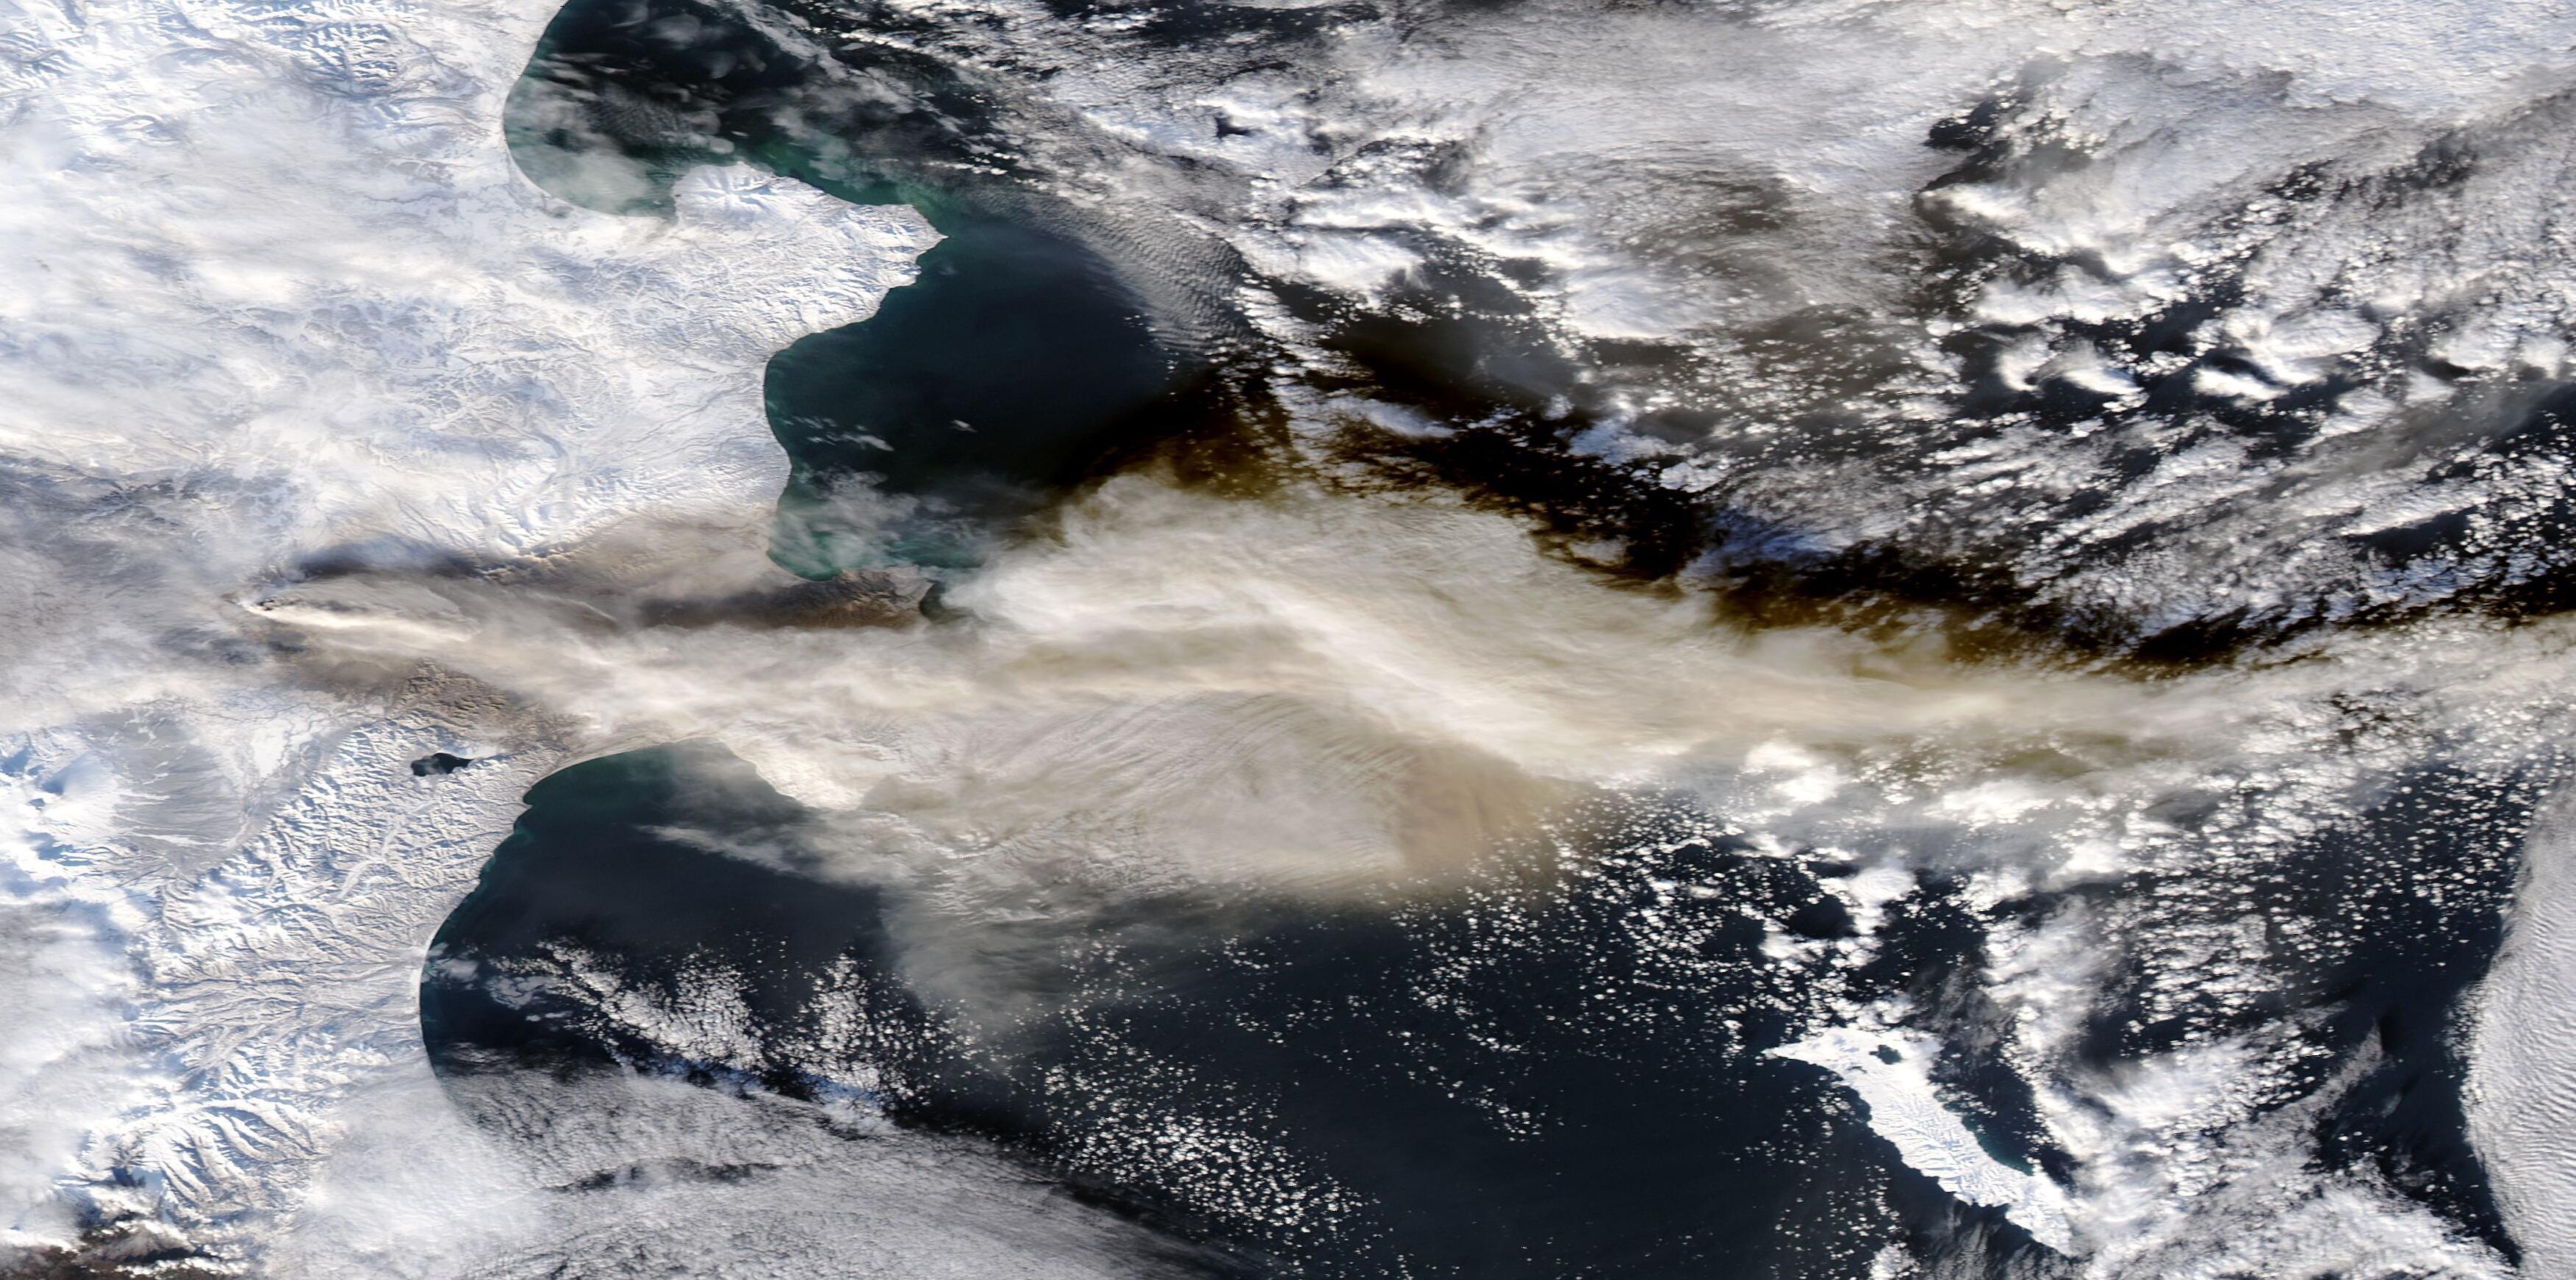
Four of my favorite #MODIS images of Jan Mayen with a von Kármán vortex streets this year. This phenomenon forms when a steady flow of becomes separated by an obstacle (like a huge stratovolcano in the middle of the ocean) and sheds vortices. Named after the engineer and fluid dynamicist Theodore von Kármán.
🚀 New Paper Alert! Introducing **modisfast**, an #RStats package for quick and easy downloads of key #EarthObservation (EO) data 🌍📈. Access #MODIS, VIIRS, and GPM products with custom filters and parallelized downloads ! @ptaconet.bsky.social
[lance-modis] Unavailability of SNPP L2+ EDR data products until further notice -- Update
The eruption cloud of #Shiveluch 🌋 #Kamchatka seen today by the Aqua #MODIS 🛰️polar orbiting satellite. The thick plume at the time of this image is about 400 km long
Laut Beamtem steckt ein Mitglied von #Modis innerem Zirkel hinter einem kanadischen Kriminalkomplott | CBC
https://www.cbc.ca/news/politics/india-murder-extortion-canada-csis-rcmp-1.7365853
#Hindunationalismus #hindutva #india #canada
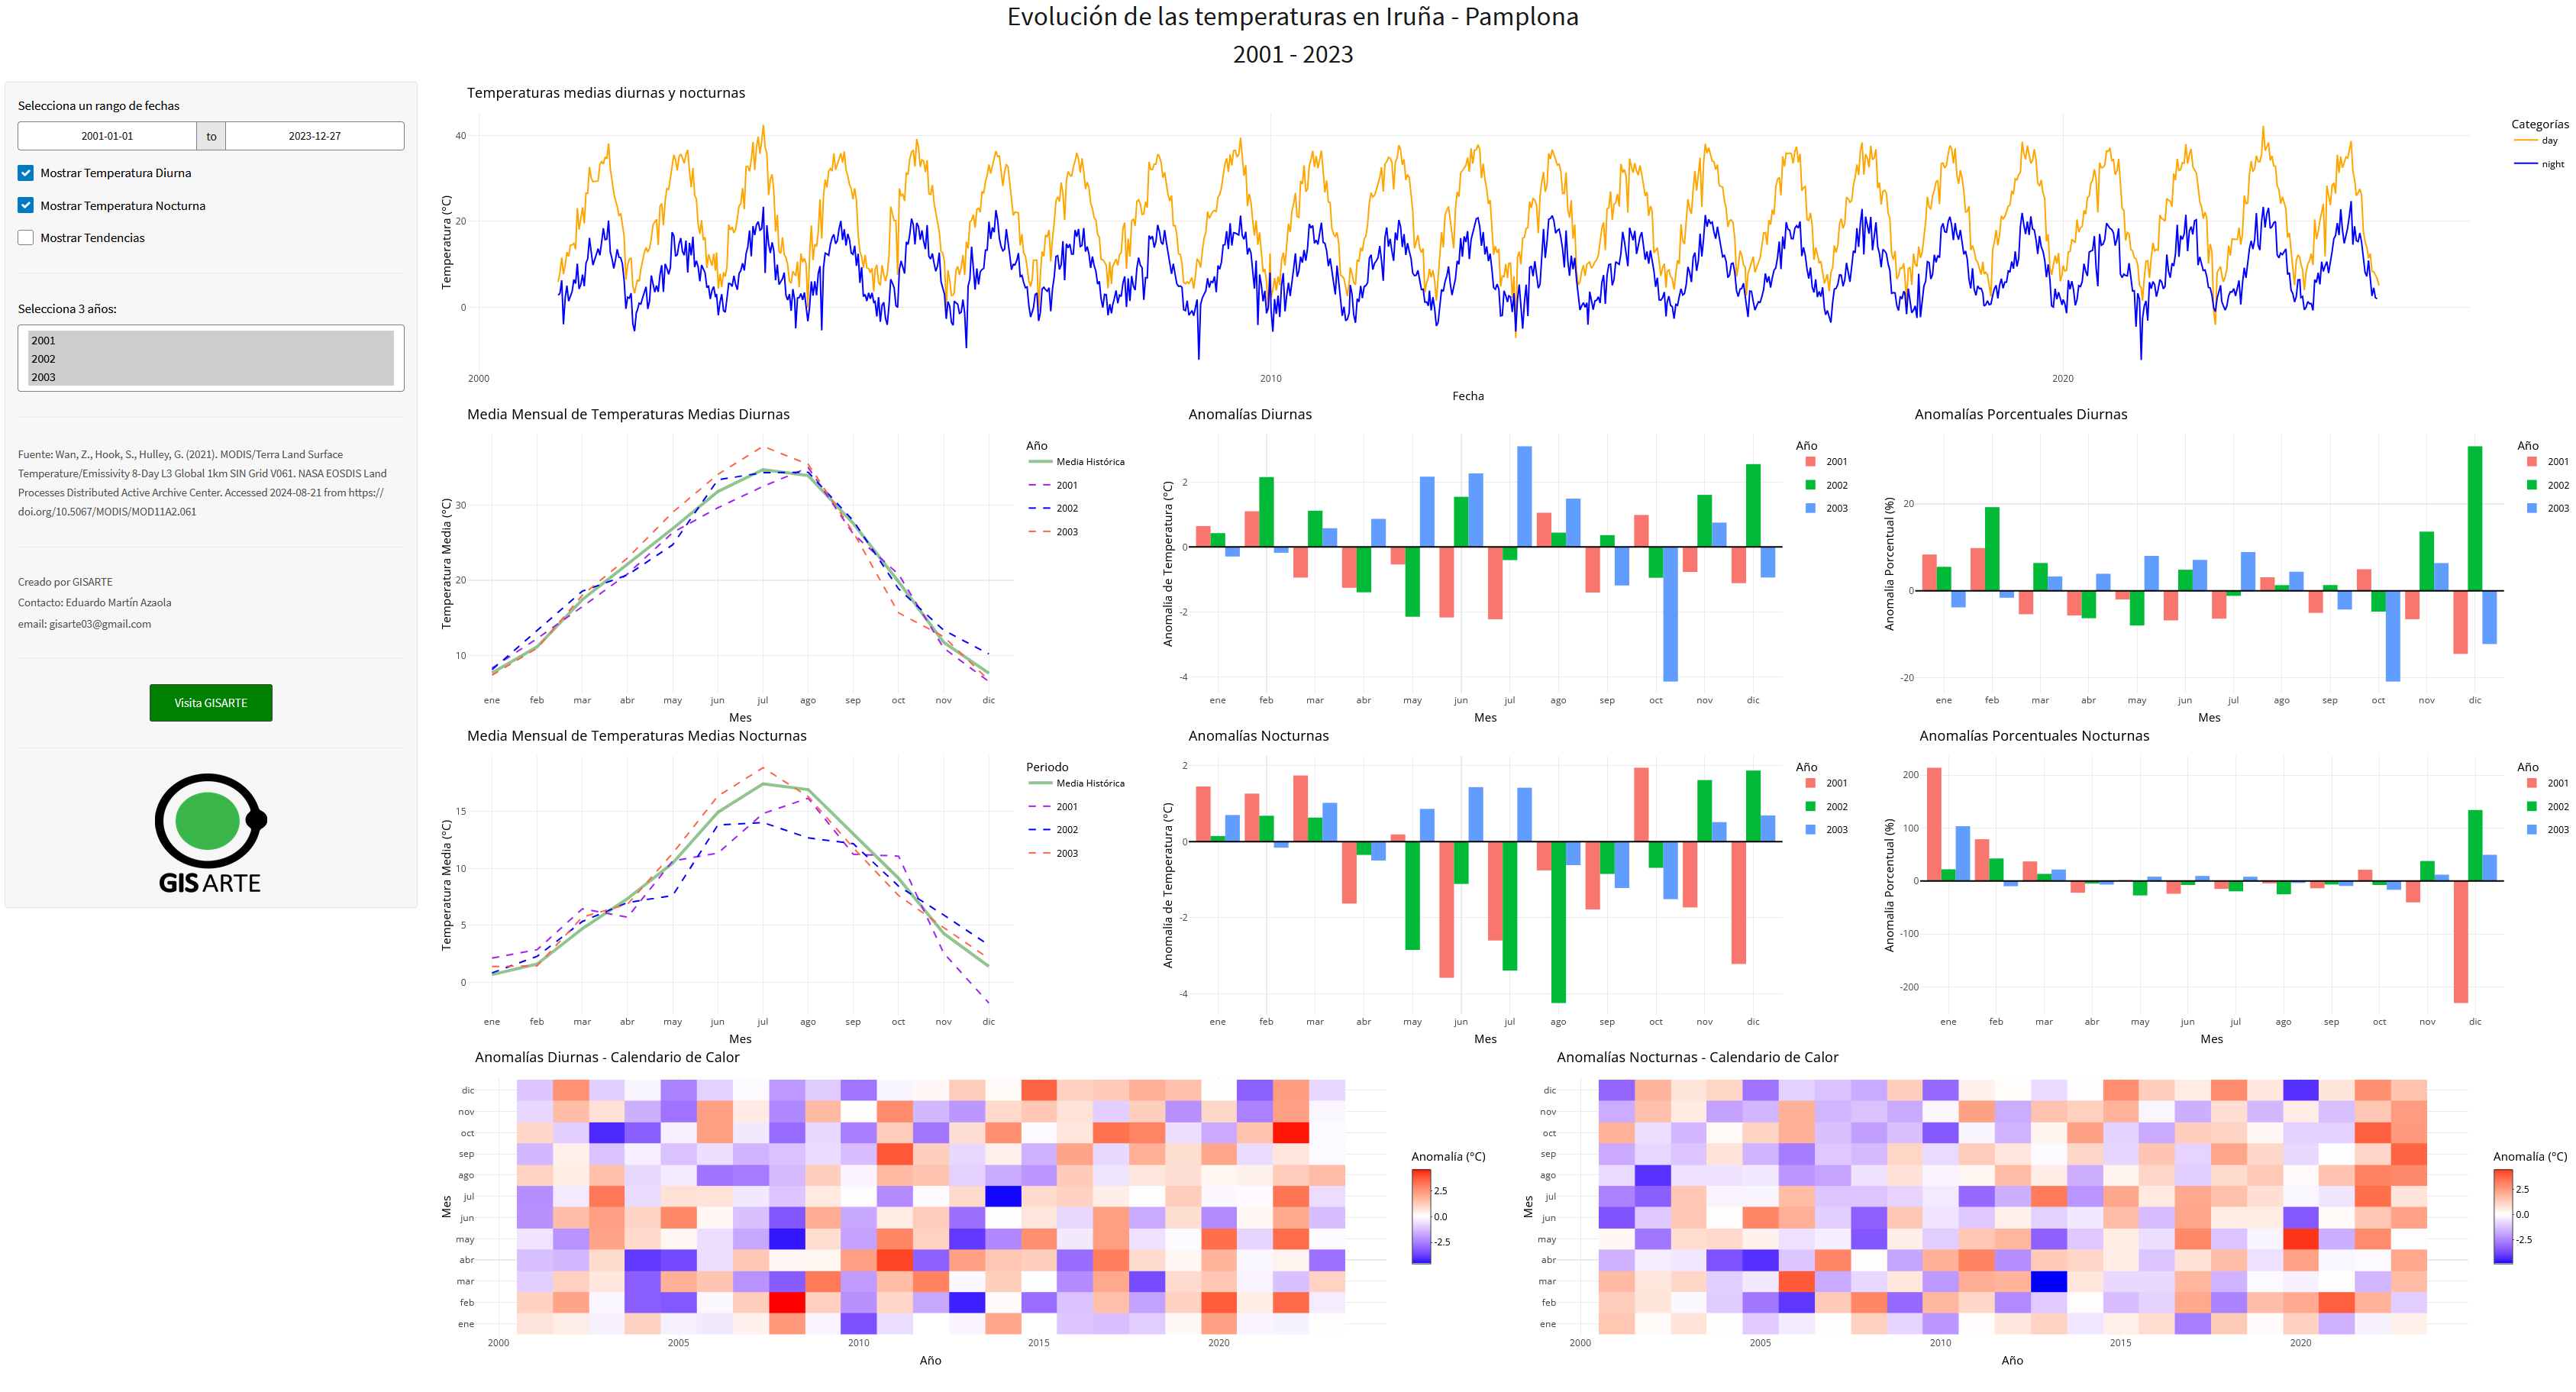
Now the interactive application
Daytime and nighttime temperature between 2001 and 2023, we compare the behavior with the monthly averages and see the anomalies
https://corta.es/90xj6
#shinyapp #r #rstudio #Iruña #Pamplona #Modis #Climatechange #dataviz
Hurricane Helene has "significantly impacted operations at NOAA National Centers for Environmental Information (NCEI)." -- now impacting satellite operations for LANCE-MODIS.
#HurricaneHelene #NCEI #NOAA #SatelliteImaging #MODIS
Hmm, satellite hotspots in Southern Lebanon over the last 7 days 👀 #Lebanon #RemoteImaging #VIIRS #MODIS
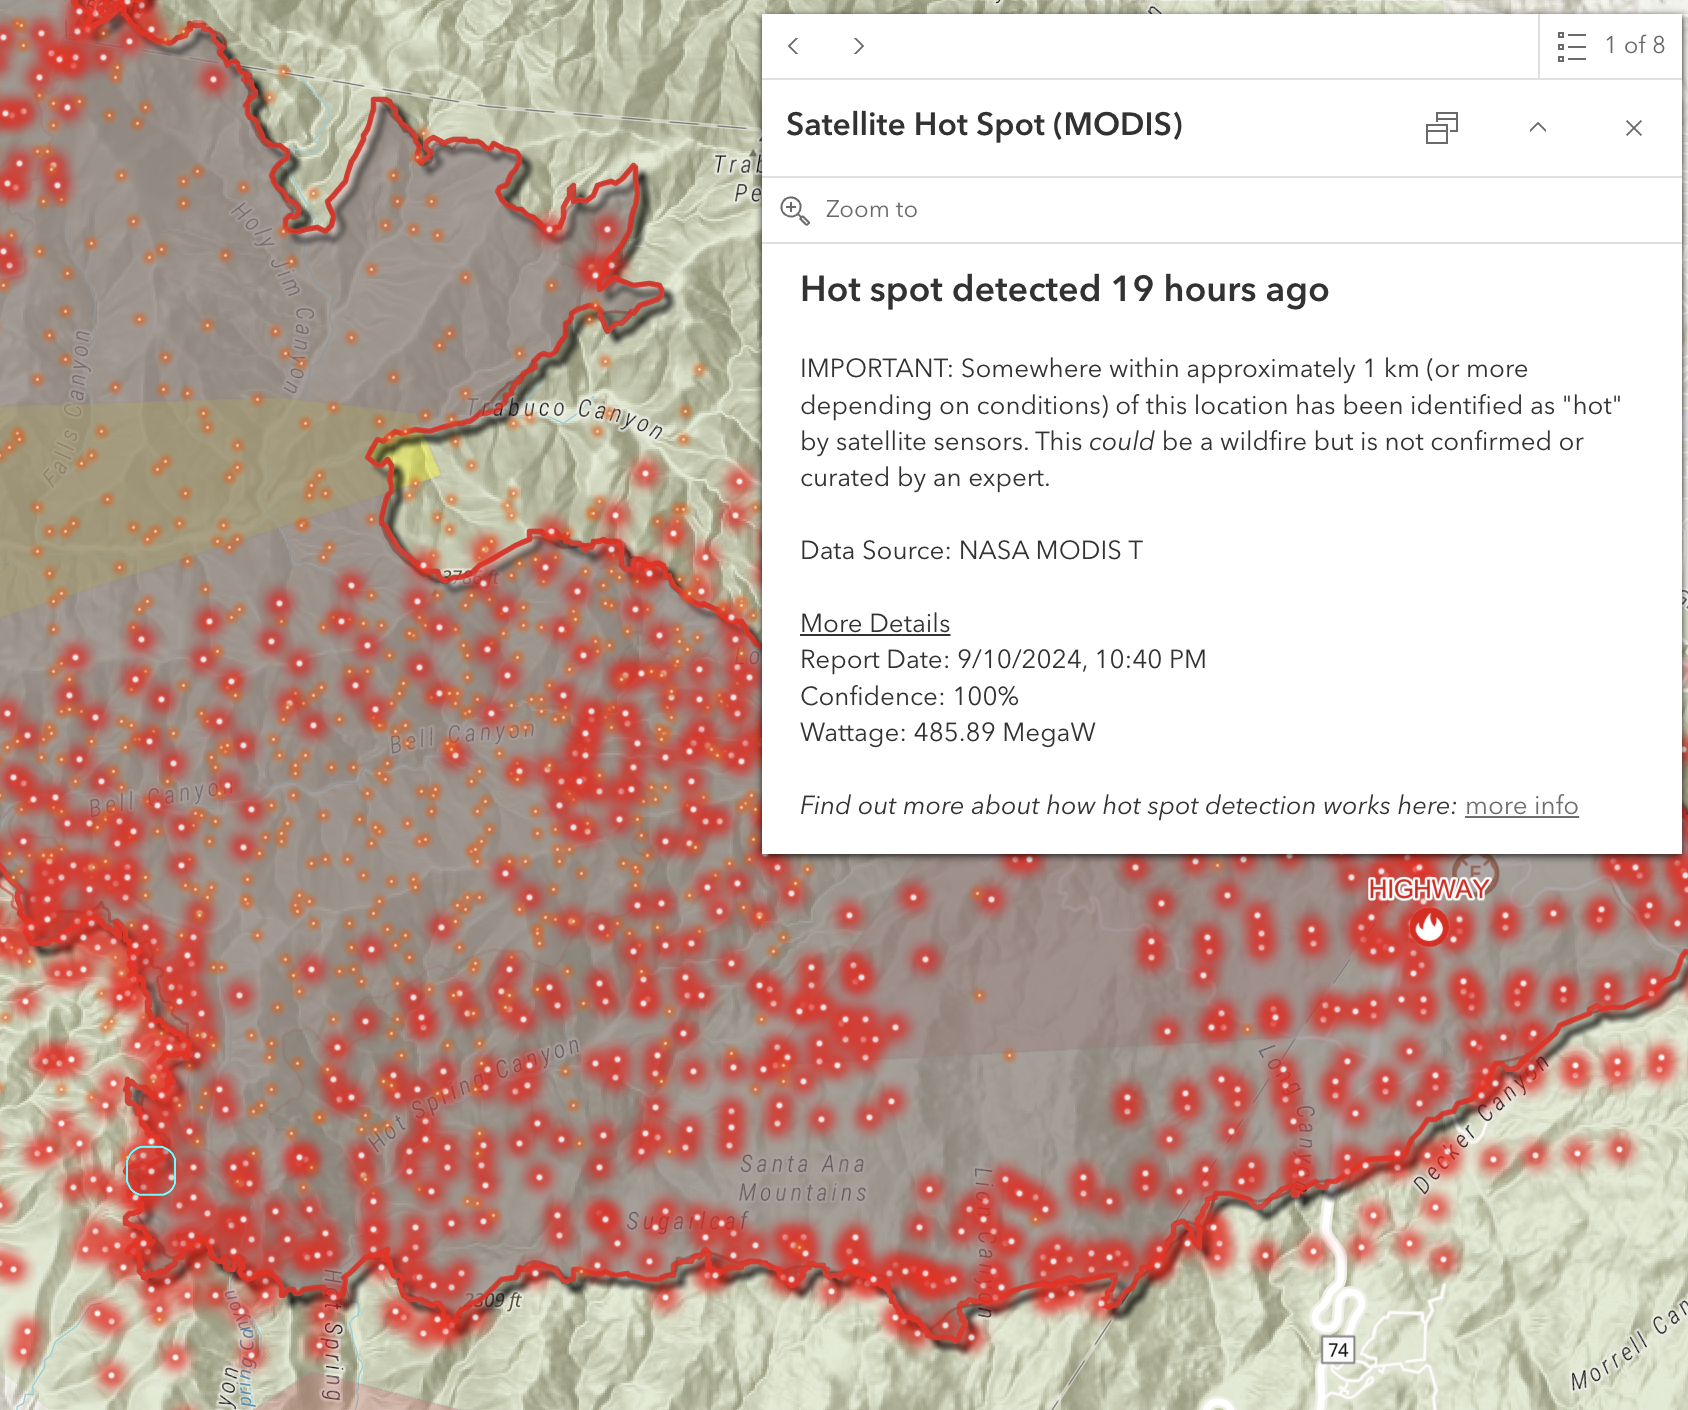
MODIS imaging is so cool but also jaw-dropping. This datapoint indicates that the 1km by 1km pixel grid point was estimated to be radiating almost 500 MW of power along the perimeter of the Airport fire (near Los Angeles) today.
I've seen MODIS datapoints up to 3.2 GW, so, again to the jaw-dropping part, do 1km squares of wildfires occasionally produce nuclear power station levels of thermal emissions? Is that right?
Client Info
Server: https://mastodon.social
Version: 2025.04
Repository: https://github.com/cyevgeniy/lmst