【EDITOR'S CHOICE】
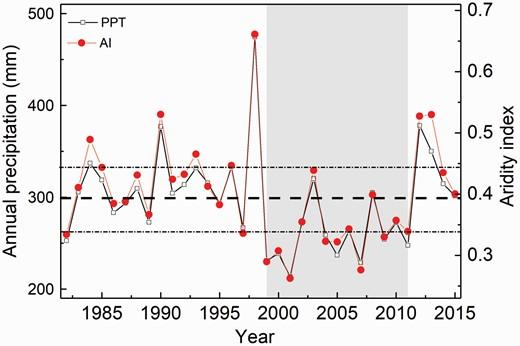
Are regional #Precipitation_productivityRelationships robust to decadal-scale dry period?
#Grassland | #NetPrimaryProductivity | #Drought | #ClimateChange | #NDVI
【EDITOR'S CHOICE】
Are regional #Precipitation_productivityRelationships robust to decadal-scale dry period?
#Grassland | #NetPrimaryProductivity | #Drought | #ClimateChange | #NDVI
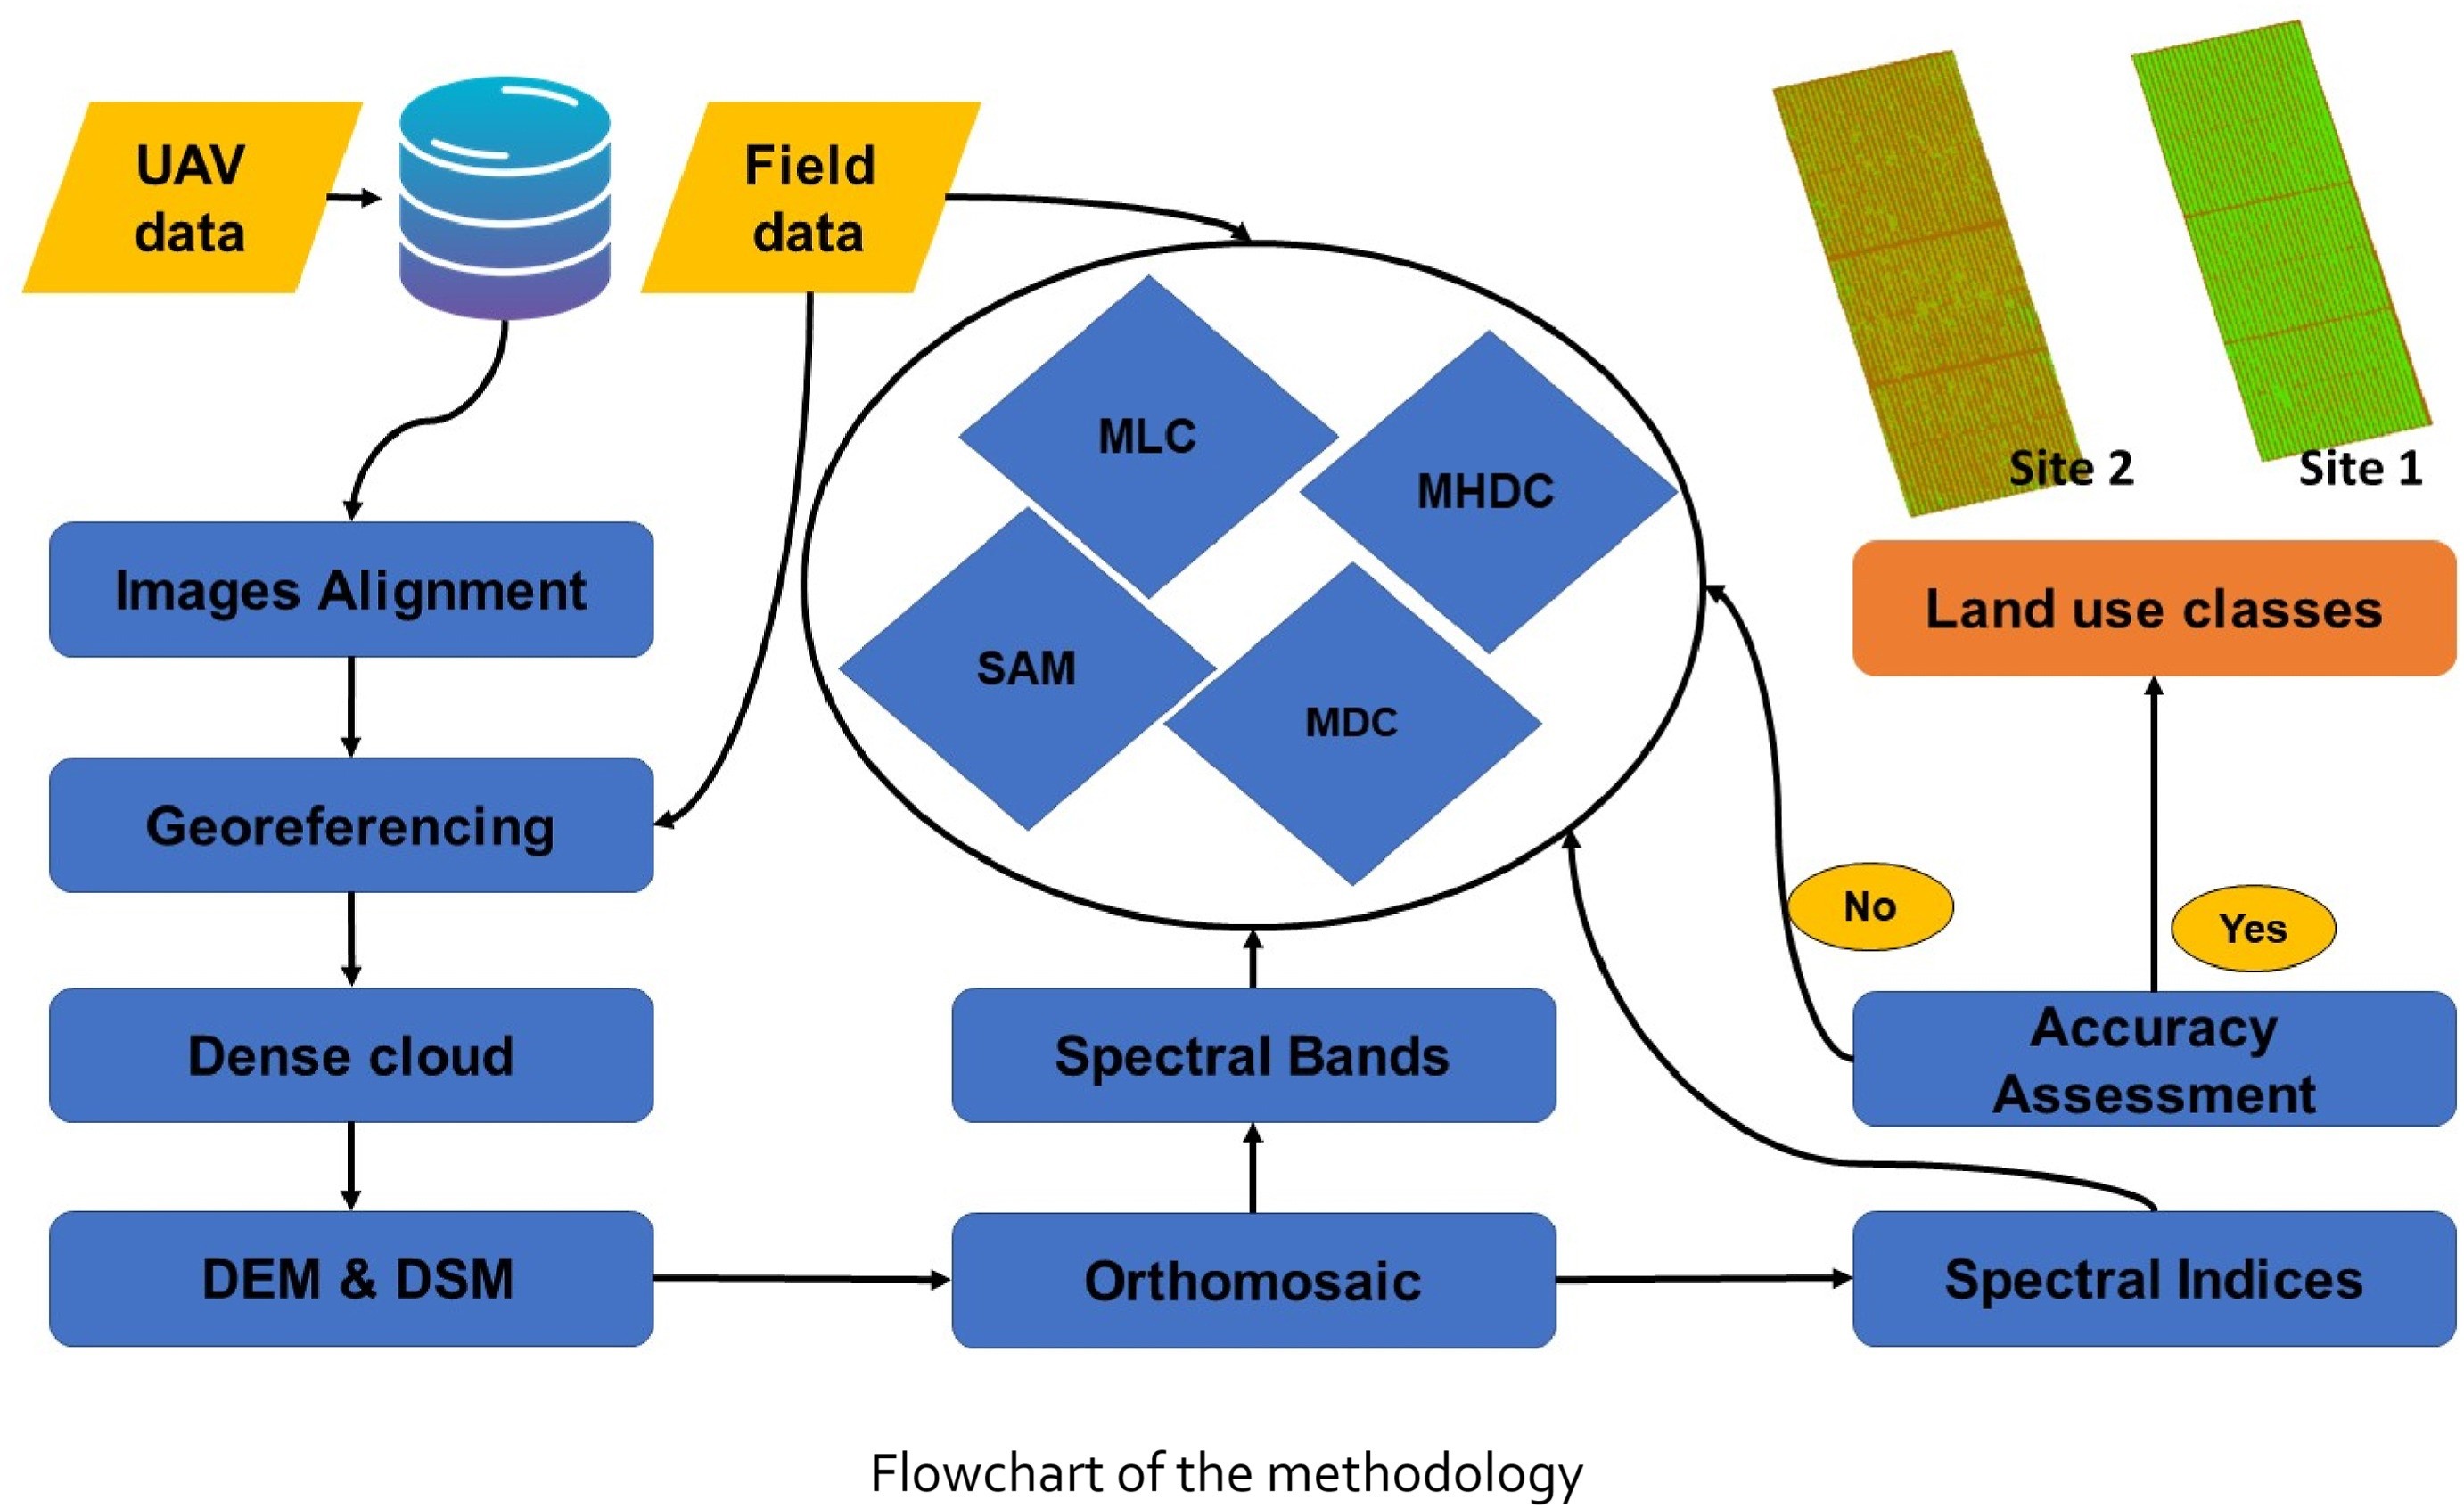
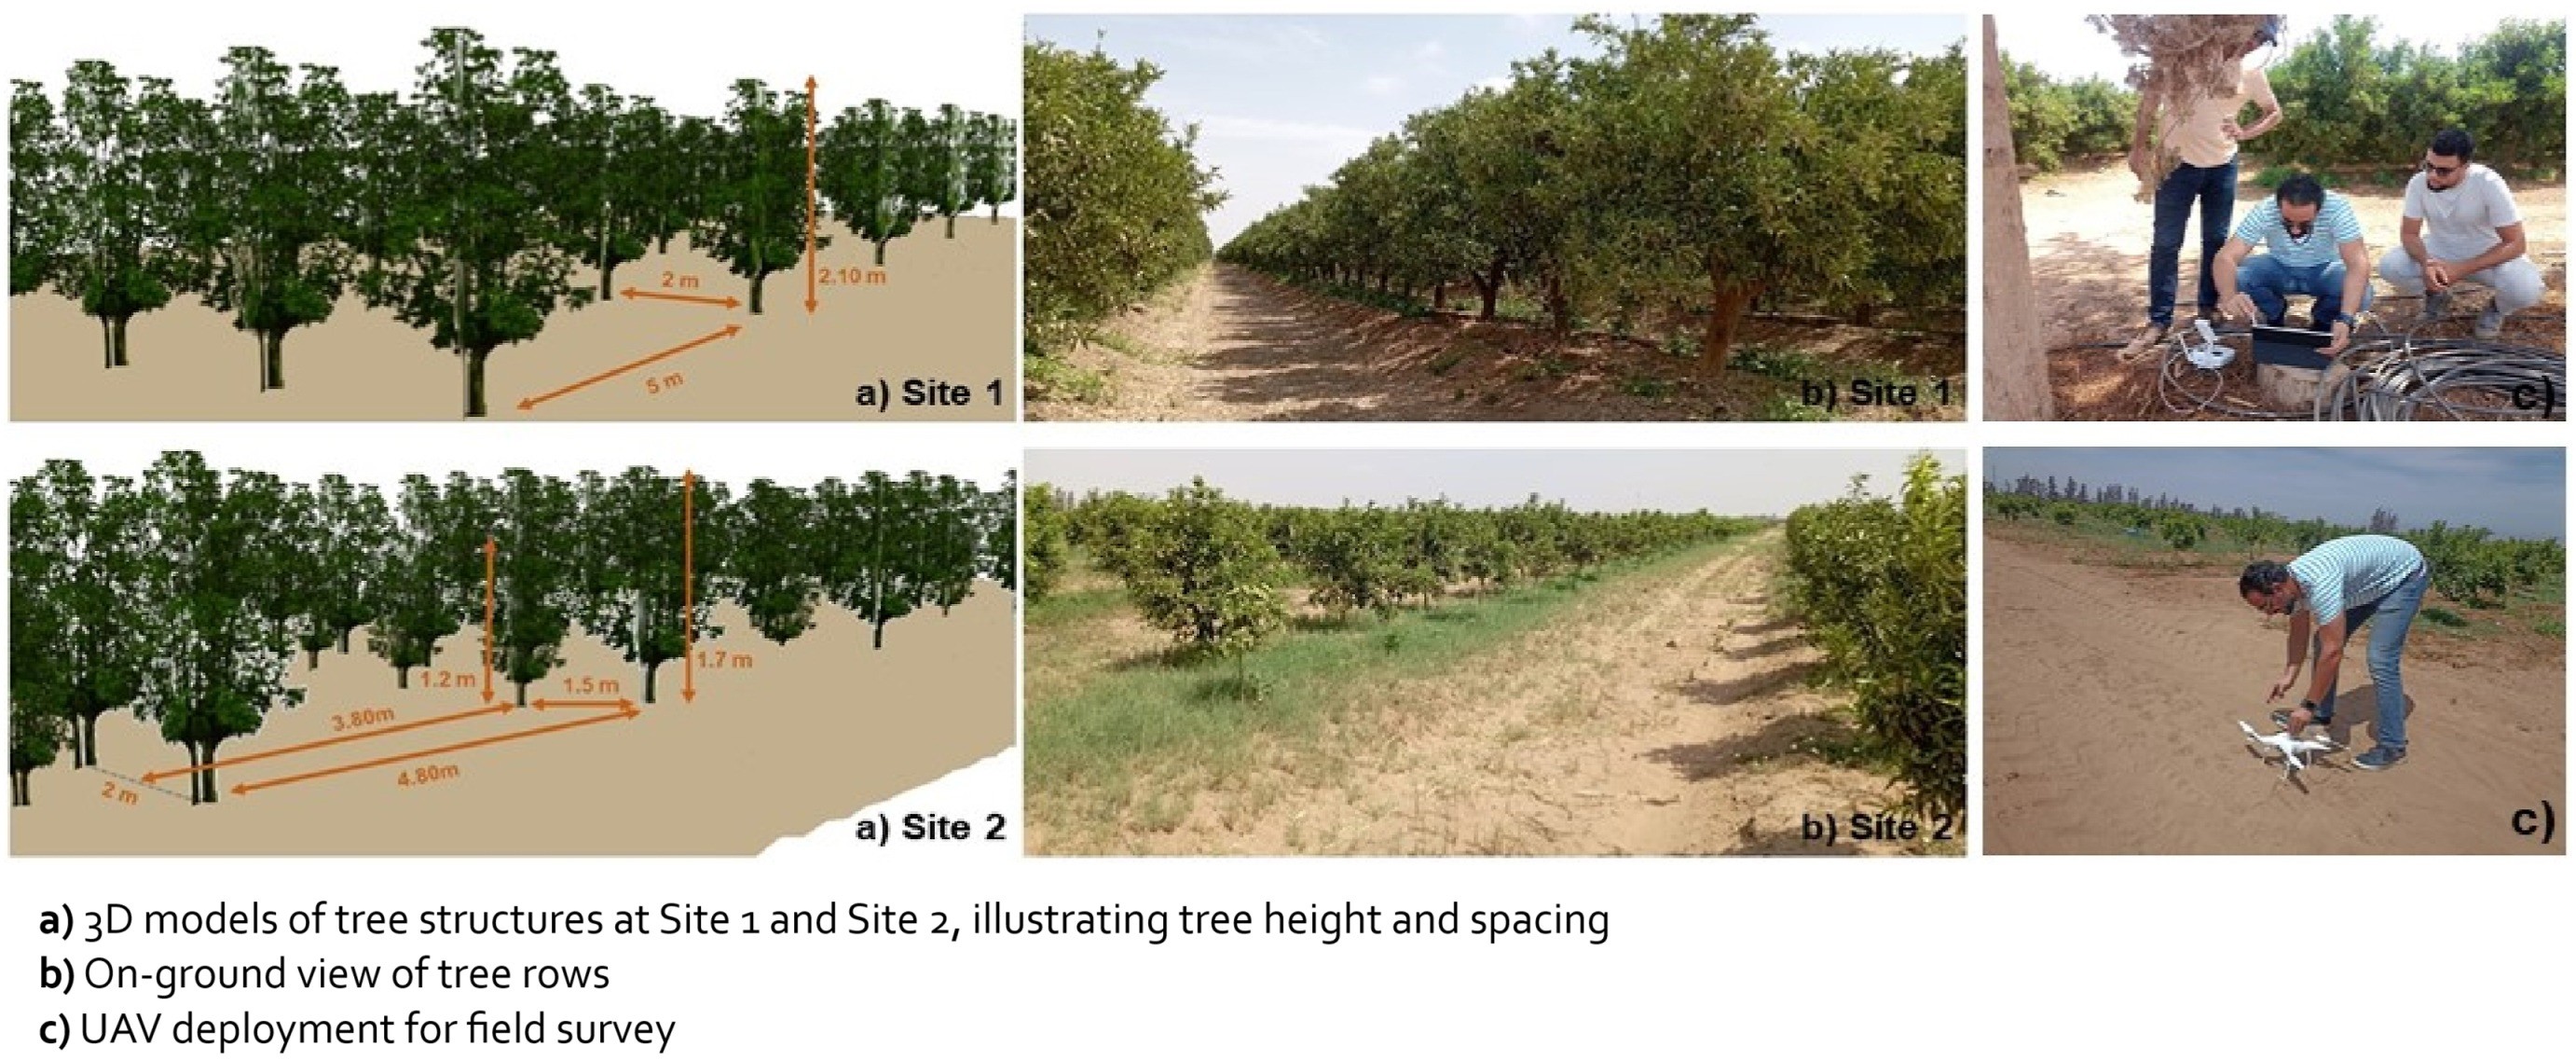
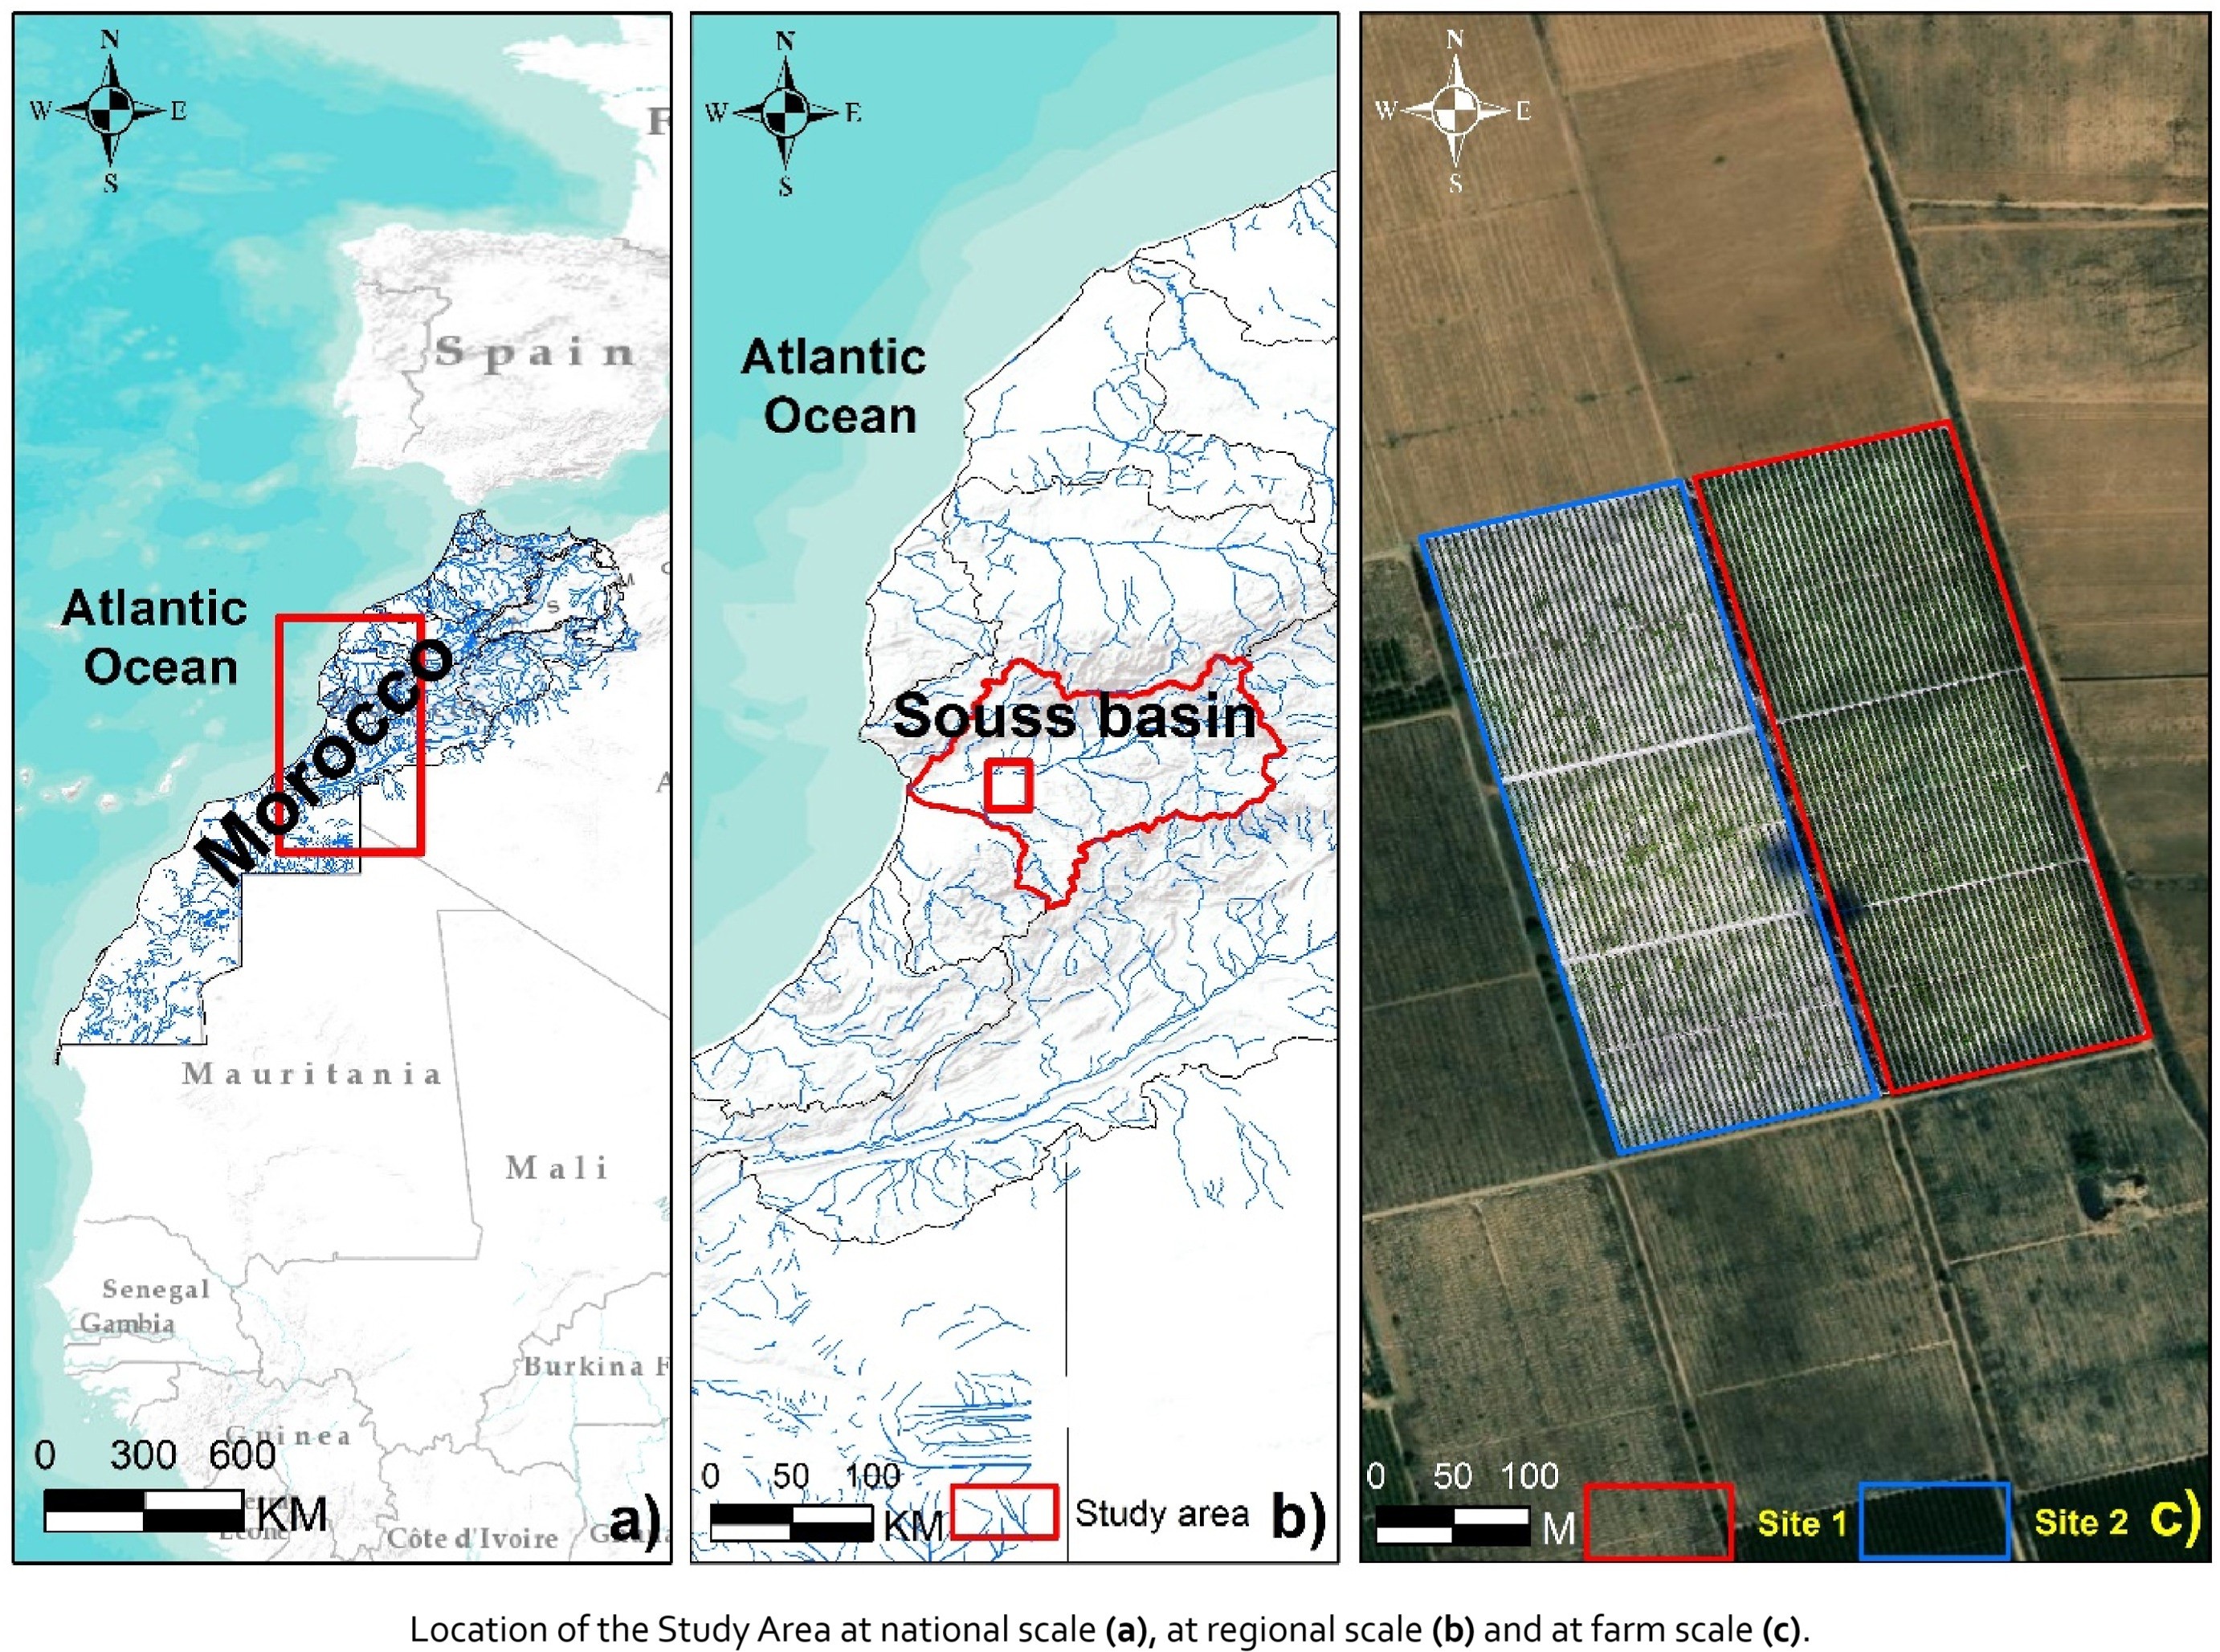
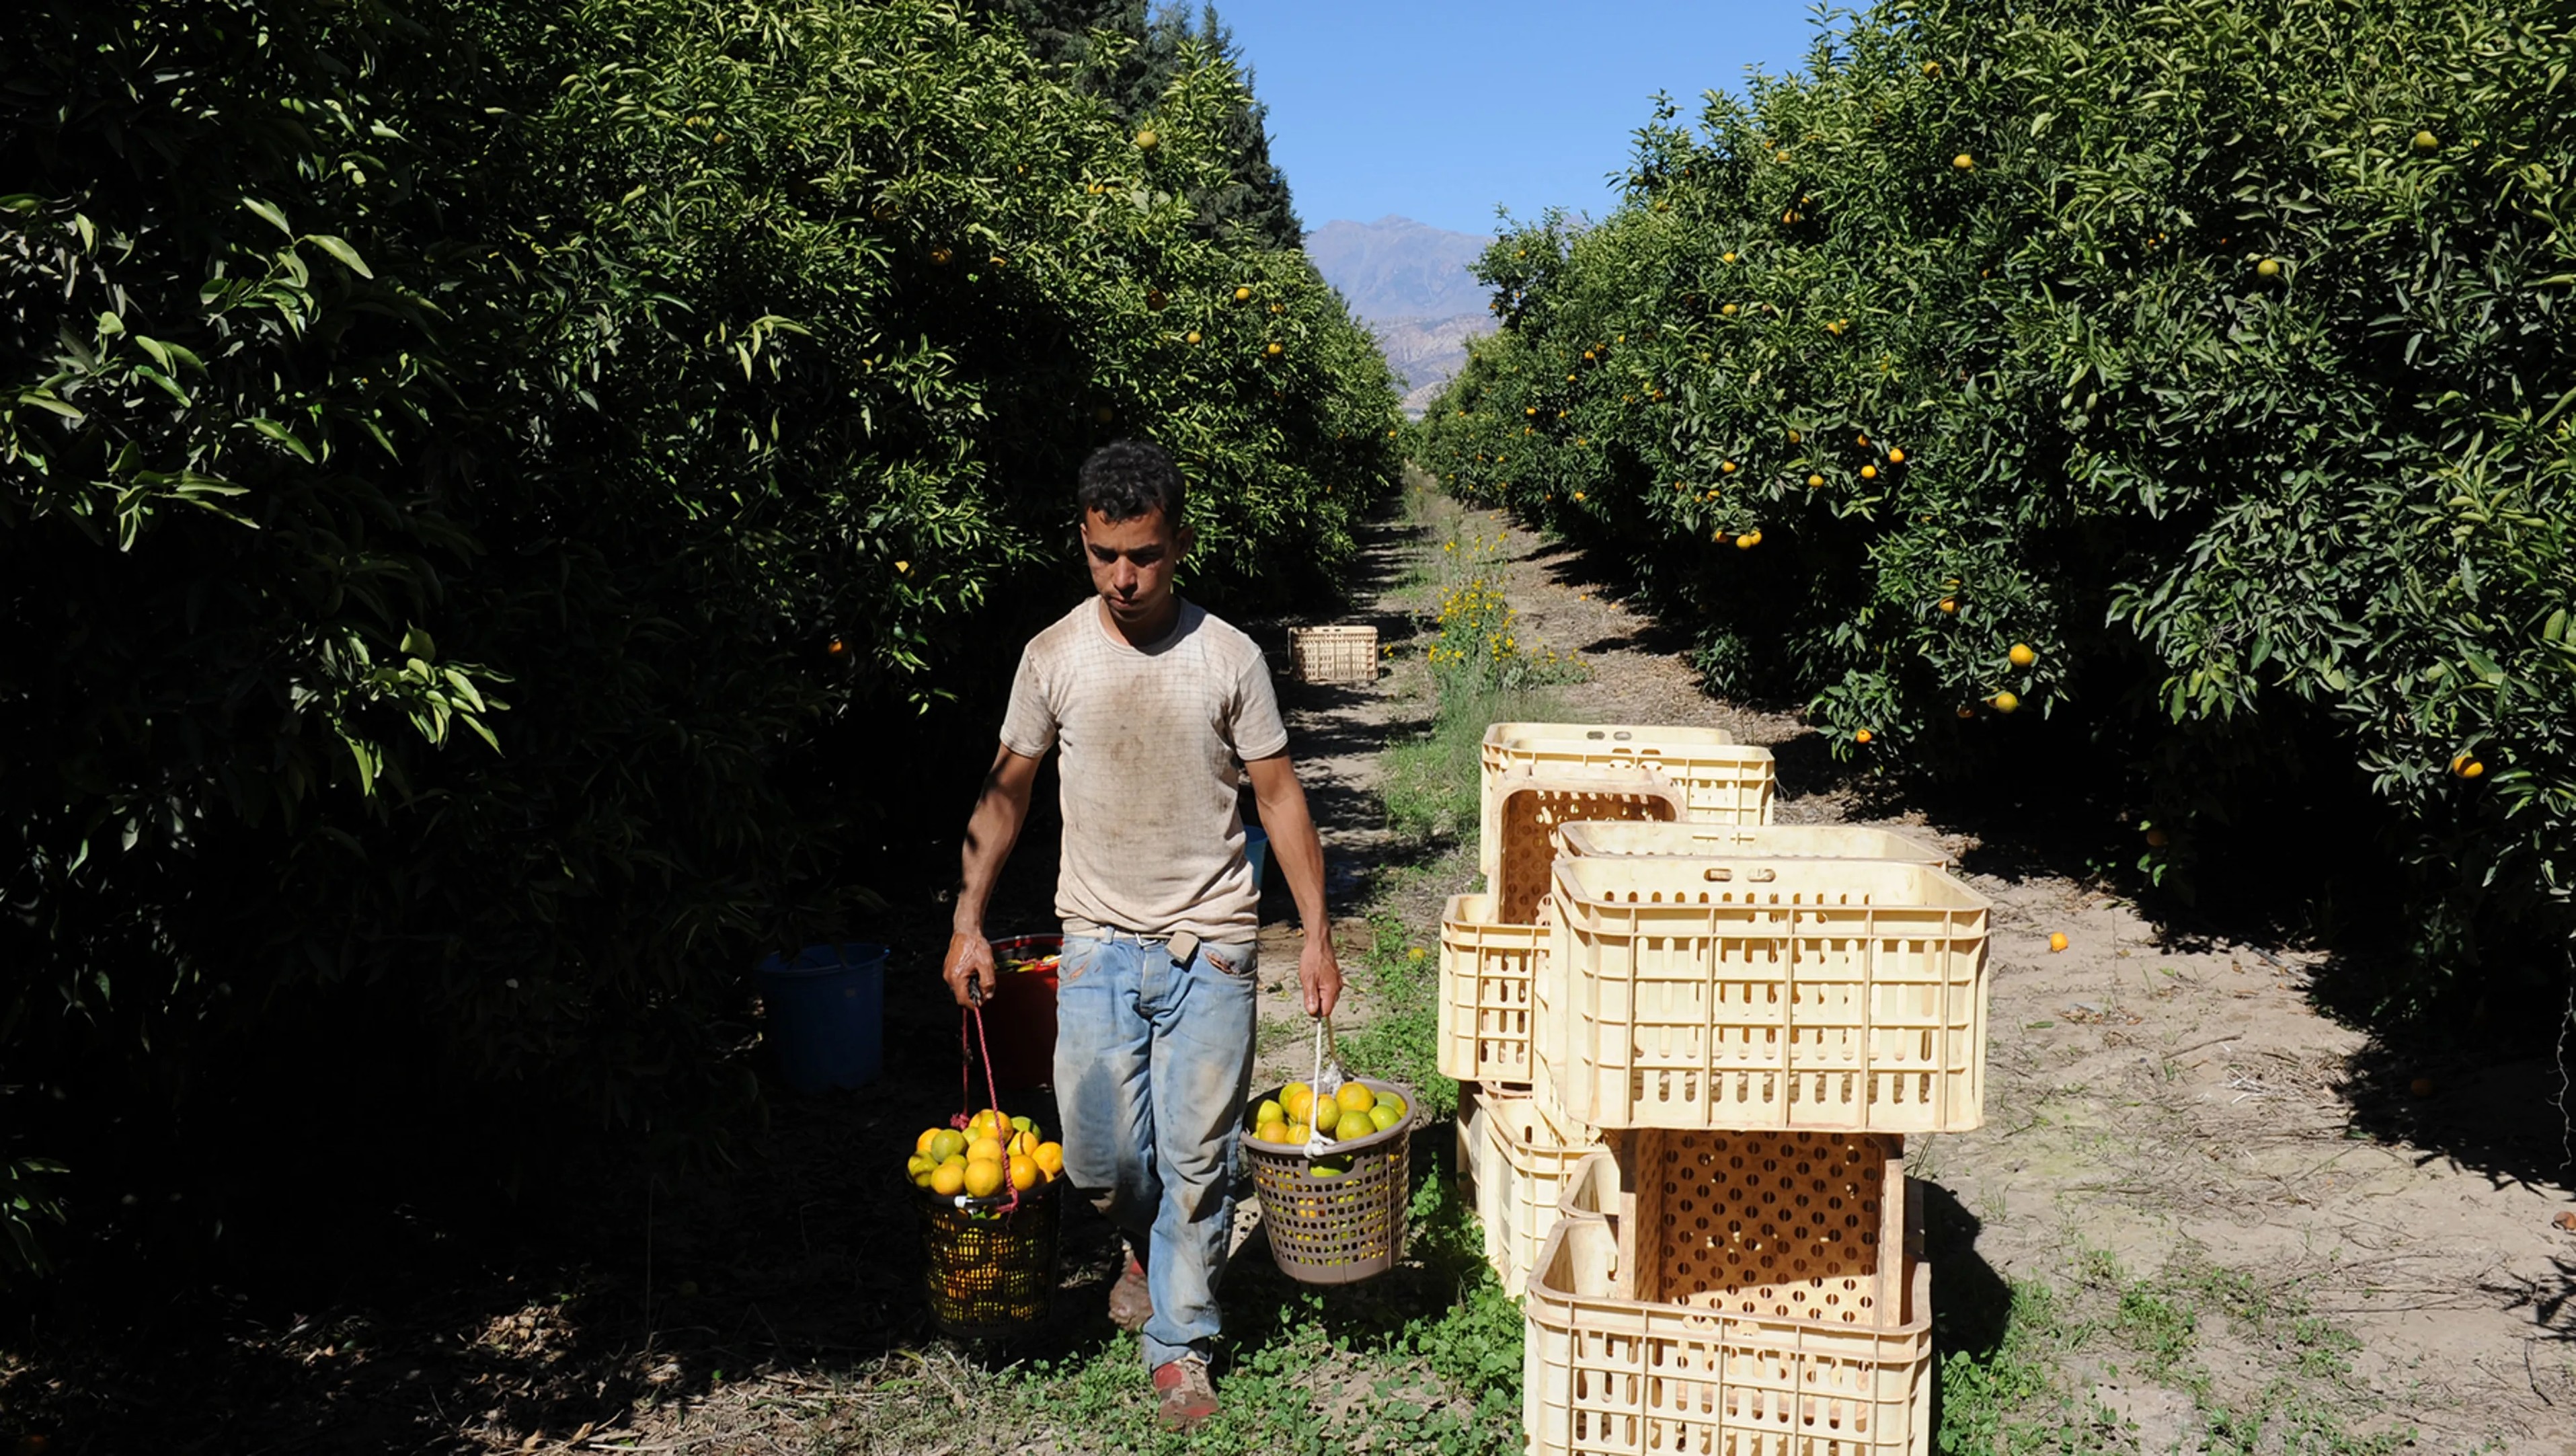
Weeds Detection In A Citrus Orchard Using Multispectral UAV Data And Machine Learning Algorithms - A Case Study From Souss-Massa Basin, Morocco
--
https://doi.org/10.1016/j.rsase.2025.101553 <-- shared paper
--
#GIS #spatial #mapping #seedsdetection #citrusorchard #unmannedaerialvehicle #UAV #multispectralsensors #machinelearning #AI #modeling #model #deeplearning #agriculture #orchard #SoussMassa #Morocco ##citrus #groundcontrol #pointcloud #DSM #imagery #NDVI #NDWI #MLC #data #production #food #management #water #hydrology #fertiliser
IMAP Testing and Integration at NASA's Marshall Space Flight Center
#Agriculture #Crop/PlantYields #Heliosphere #Imap #Iowa #LandSurface/agricultureIndicators #NDVI #PlantCharacteristics
⏩ 1 new picture and 2 new videos from NASA (SVS) https://commons.wikimedia.org/wiki/Special:ListFiles?limit=13&user=OptimusPrimeBot&ilshowall=1&offset=20250412125831
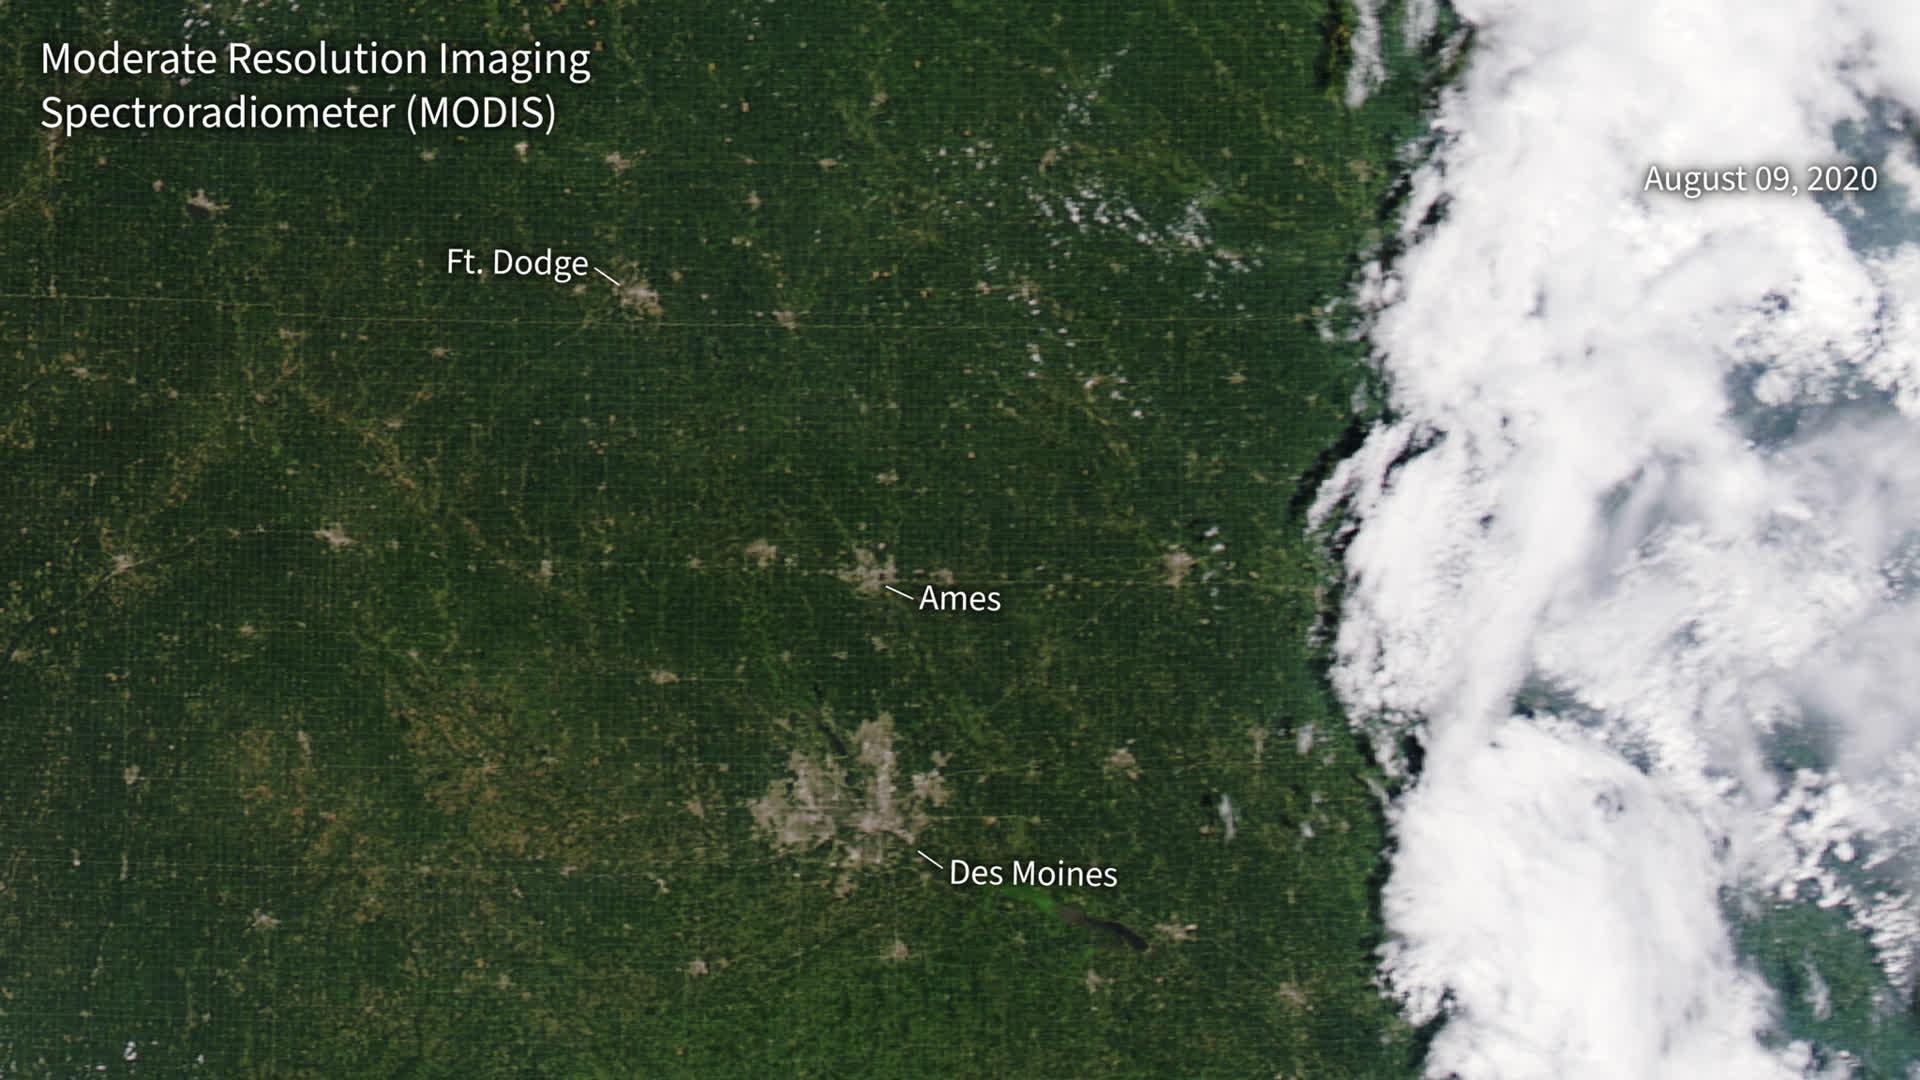
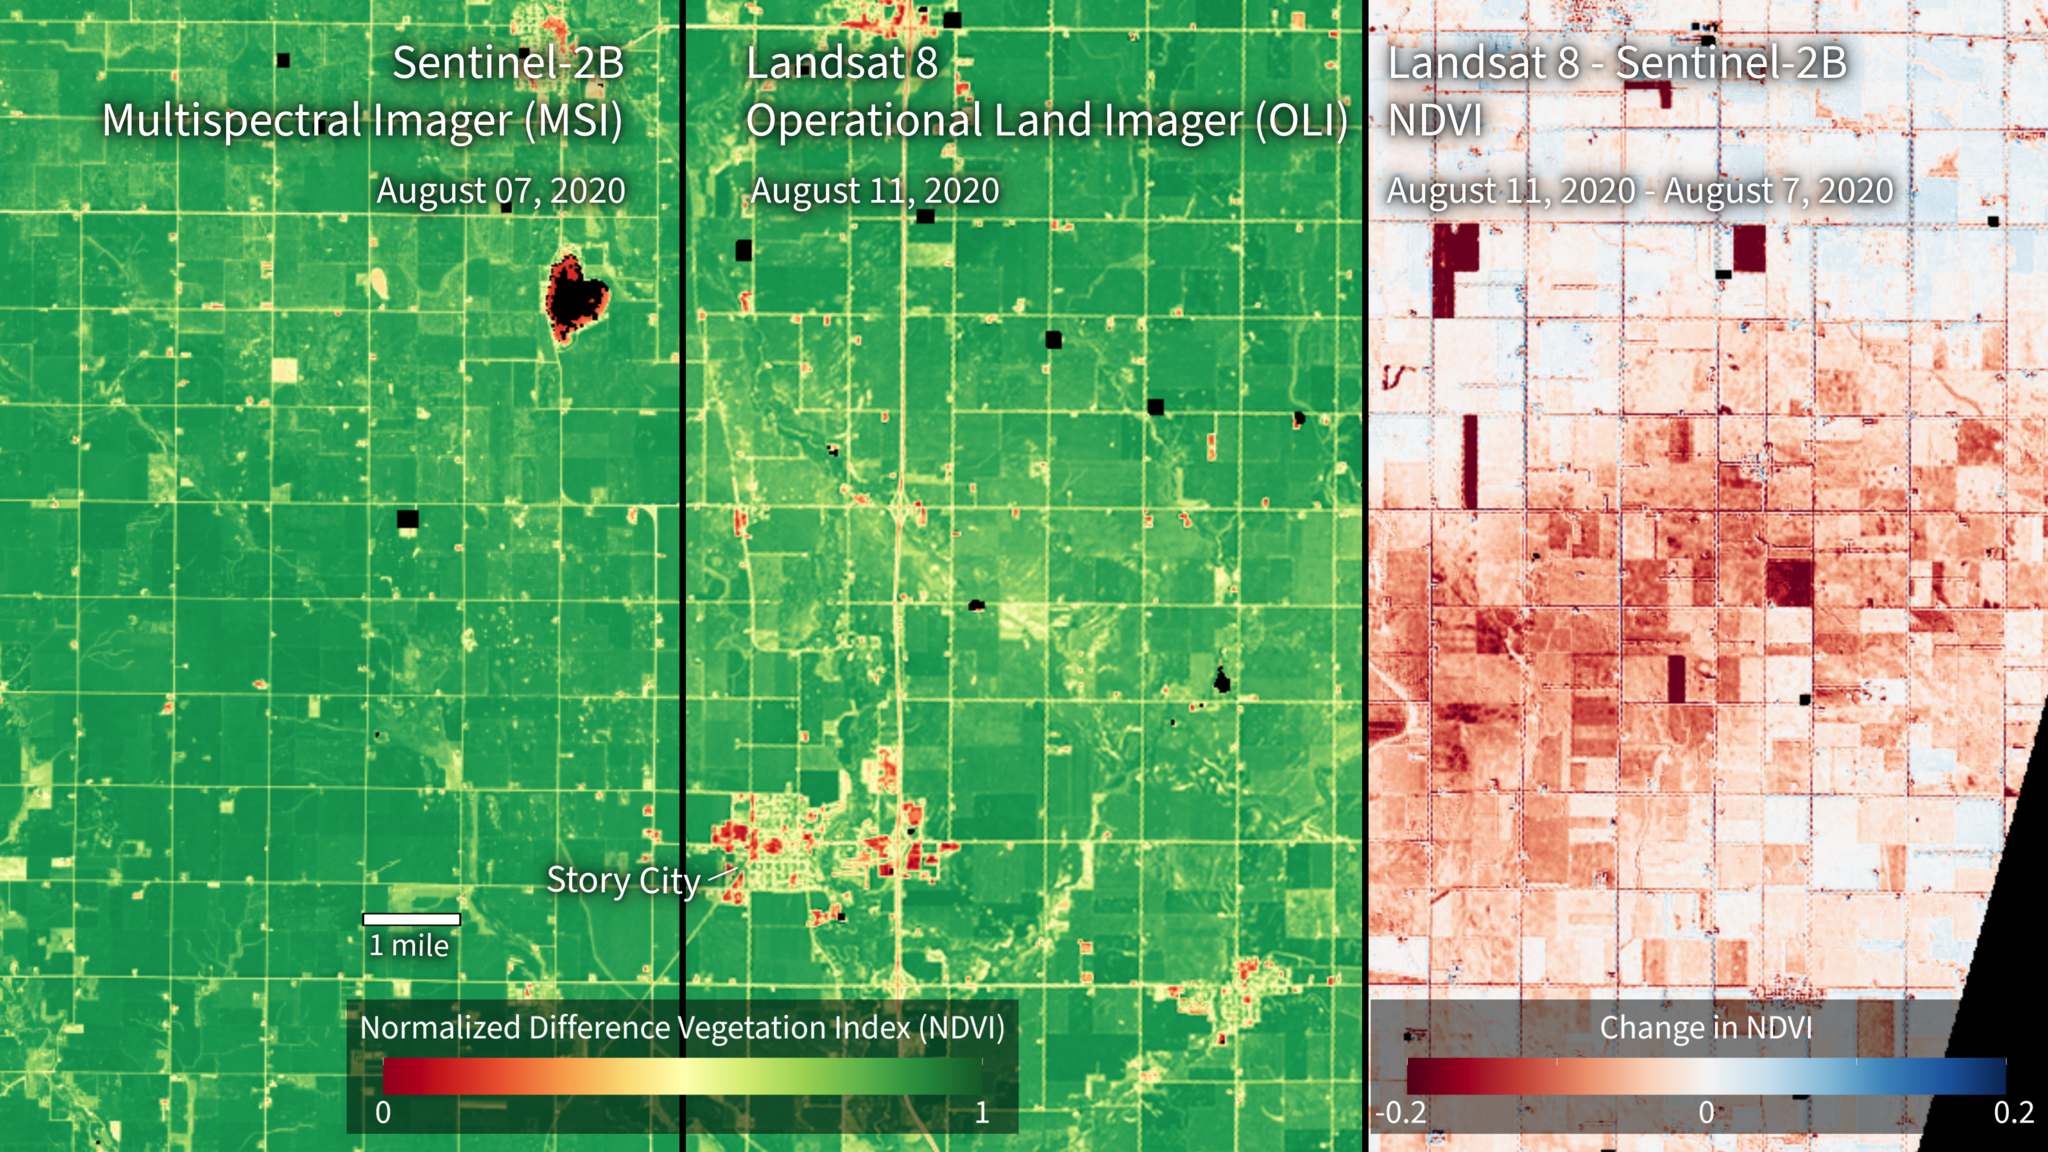
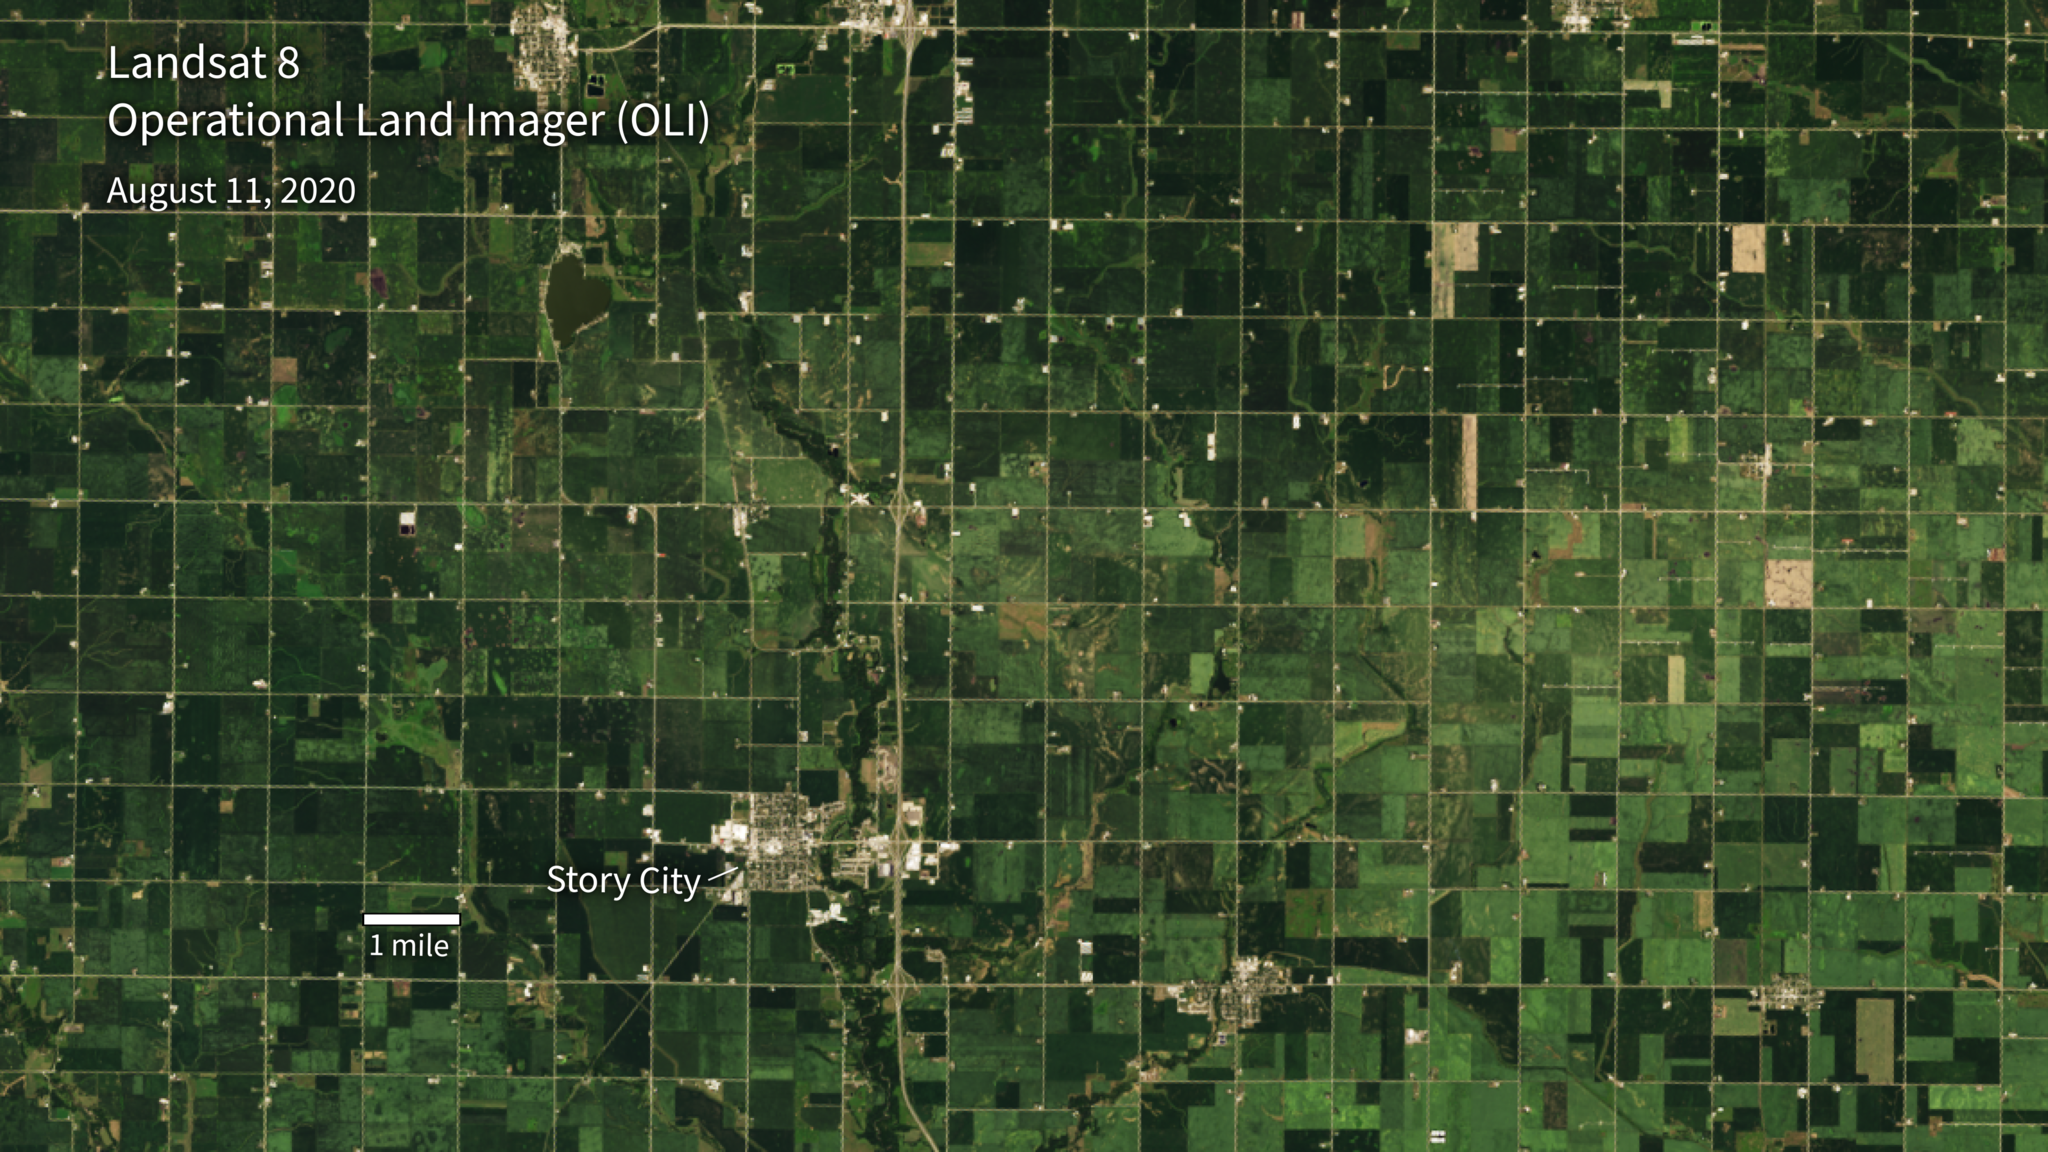
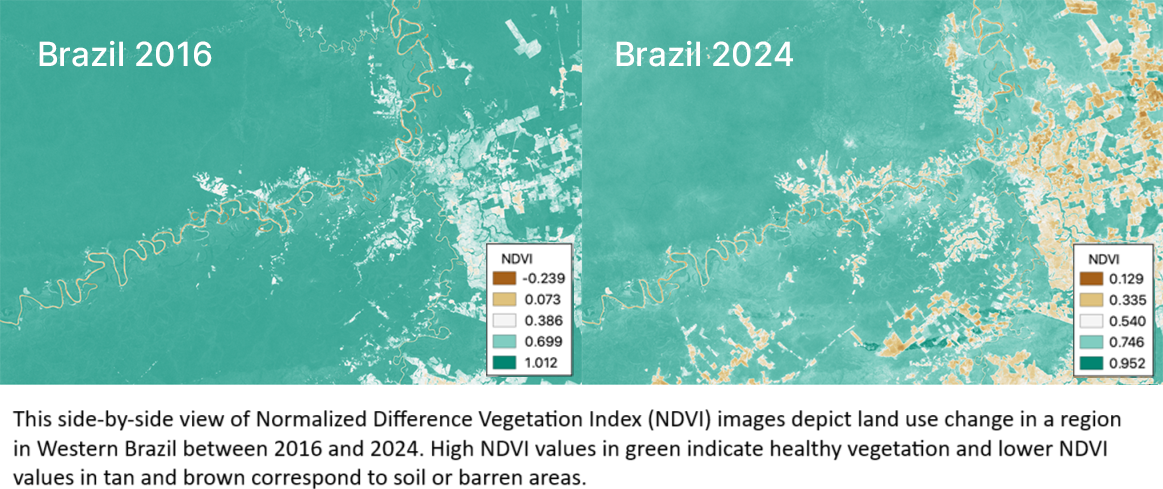
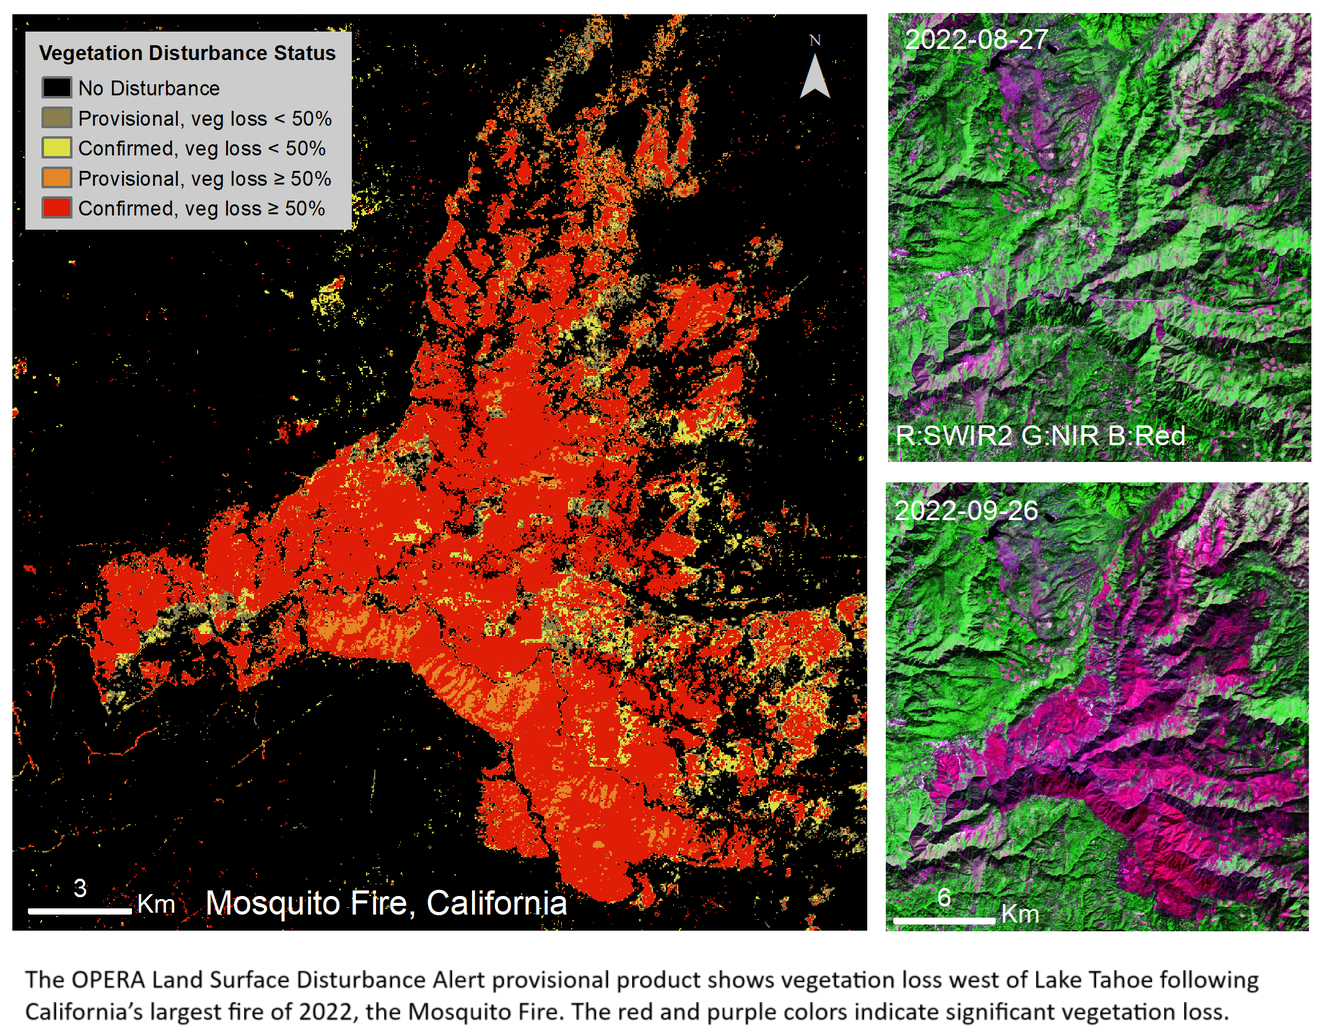
The Harmonized Landsat Sentinel-2 Project Releases Vegetation Indices
--
https://www.earthdata.nasa.gov/news/harmonized-landsat-sentinel-2-project-releases-vegetation-indices <-- shared technical article
--
https://hls.gsfc.nasa.gov/ <-- shared NASA Harmonized Landsat Sentinel-2 Project page
--
https://youtu.be/63ljR84c85M?si=3Q0PDOuFgKG8nIrA <-- shared NASA overview video
--
#GIS #spatial #mapping #fedscience #OPERA #remotesensing #earthobservation #satellite #opendata #global #vegetation #indices #HLS #Landsat #Sentinel #HLSL30VI #HLSSS30VI #greenness #moisturecontent #burned #change #OLI #MultiSpectral #NDVI
@nasa | @ESA
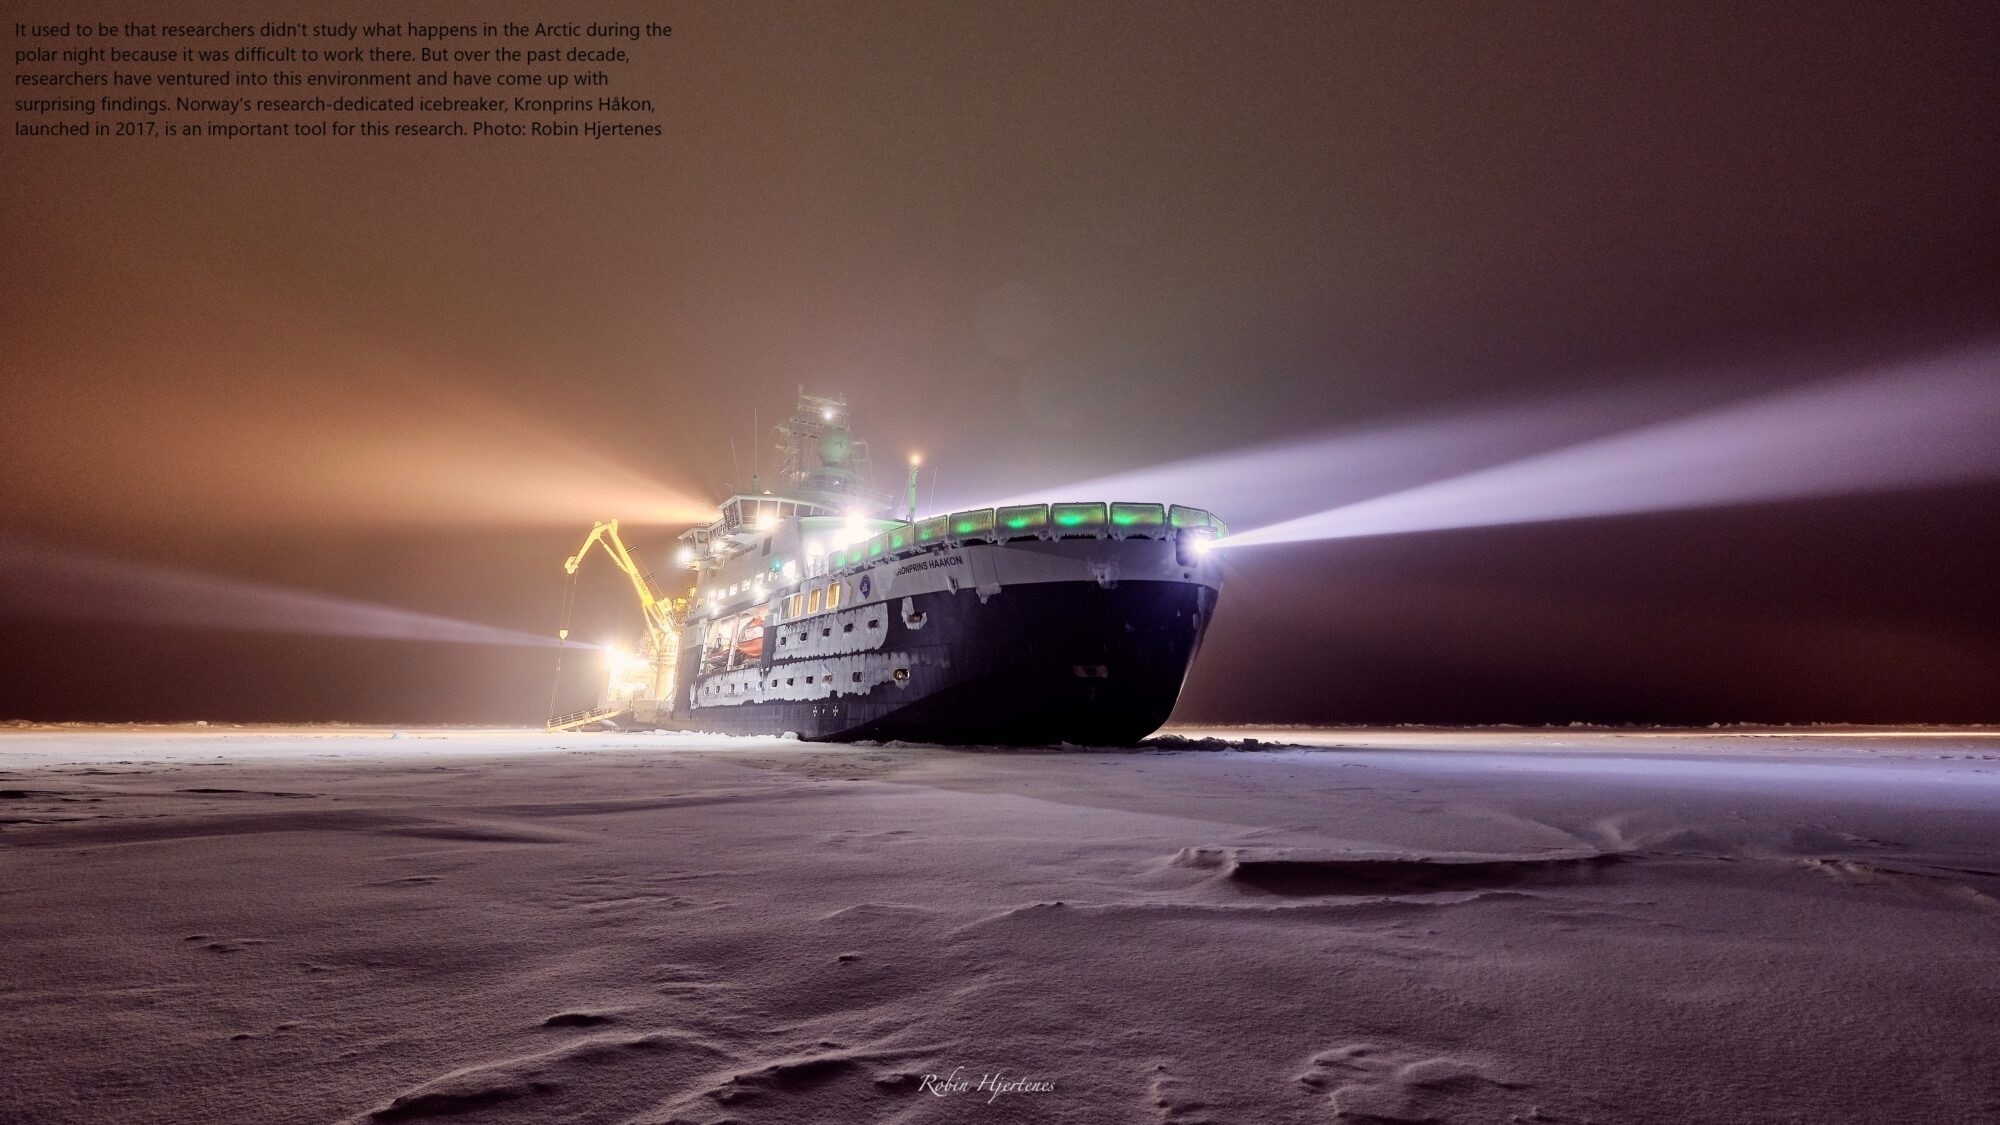
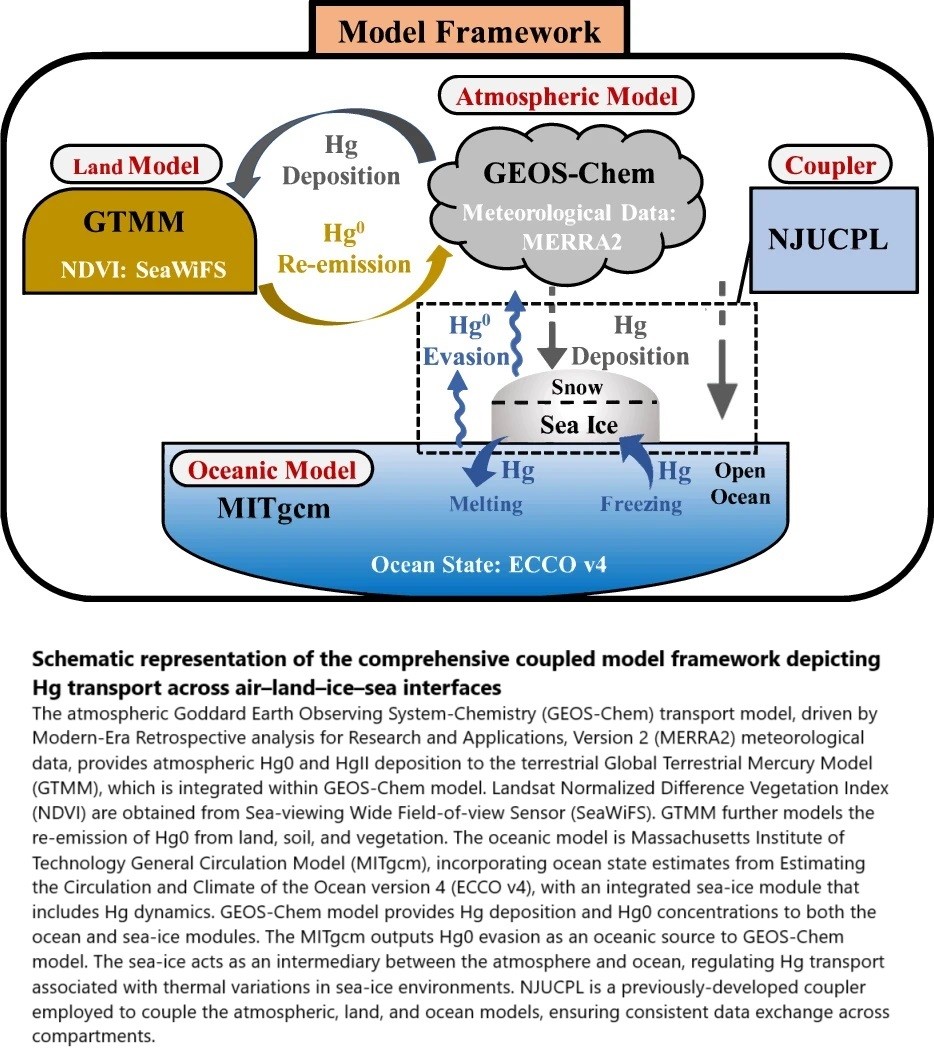
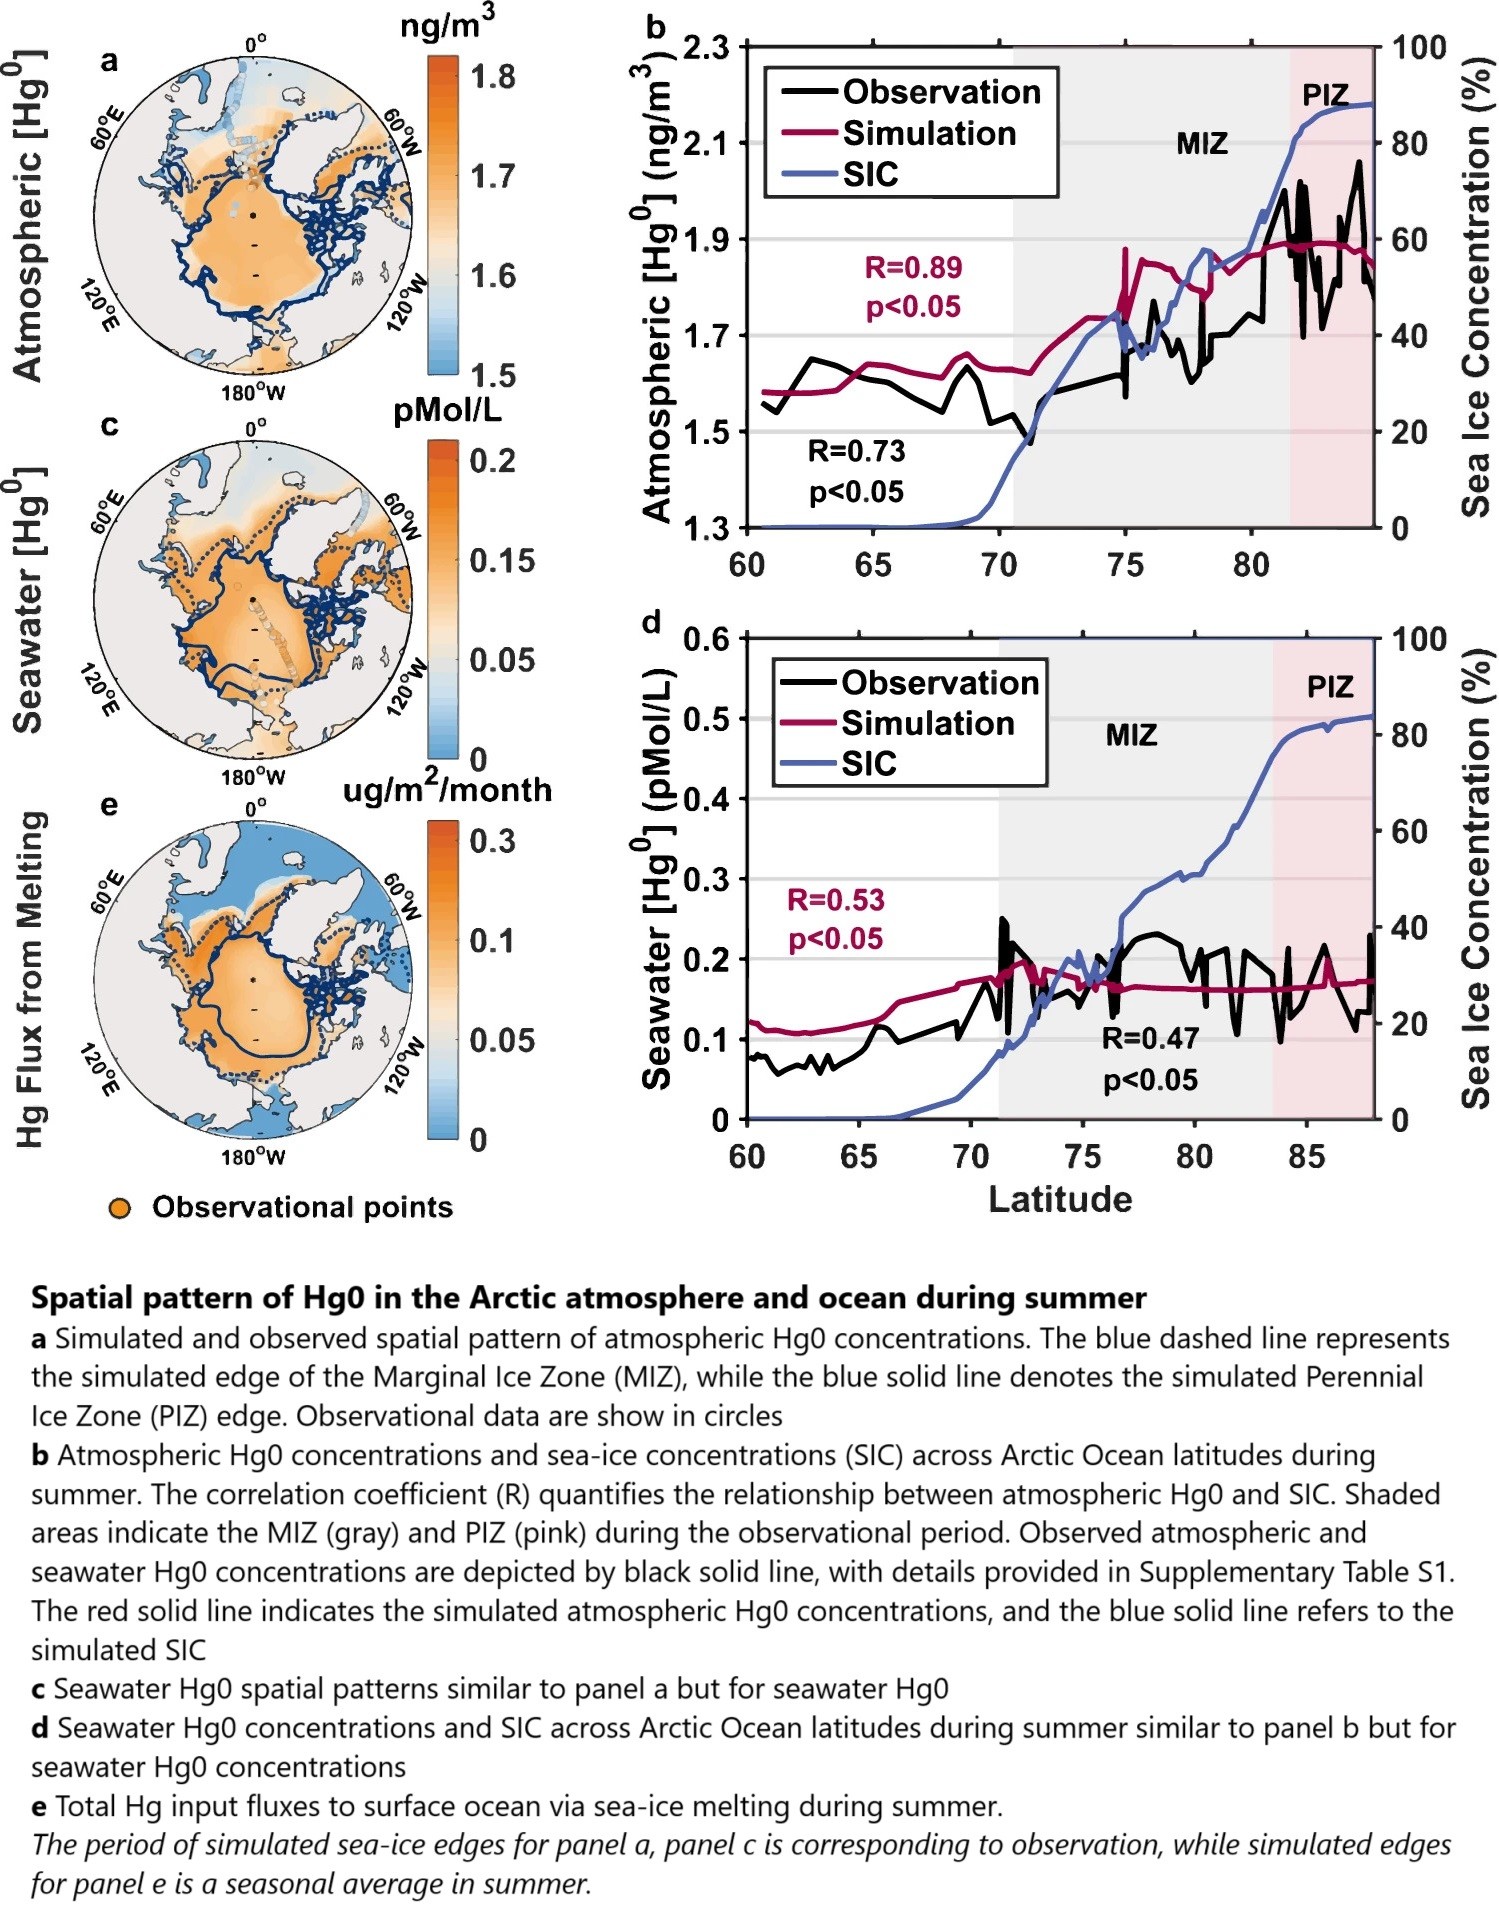
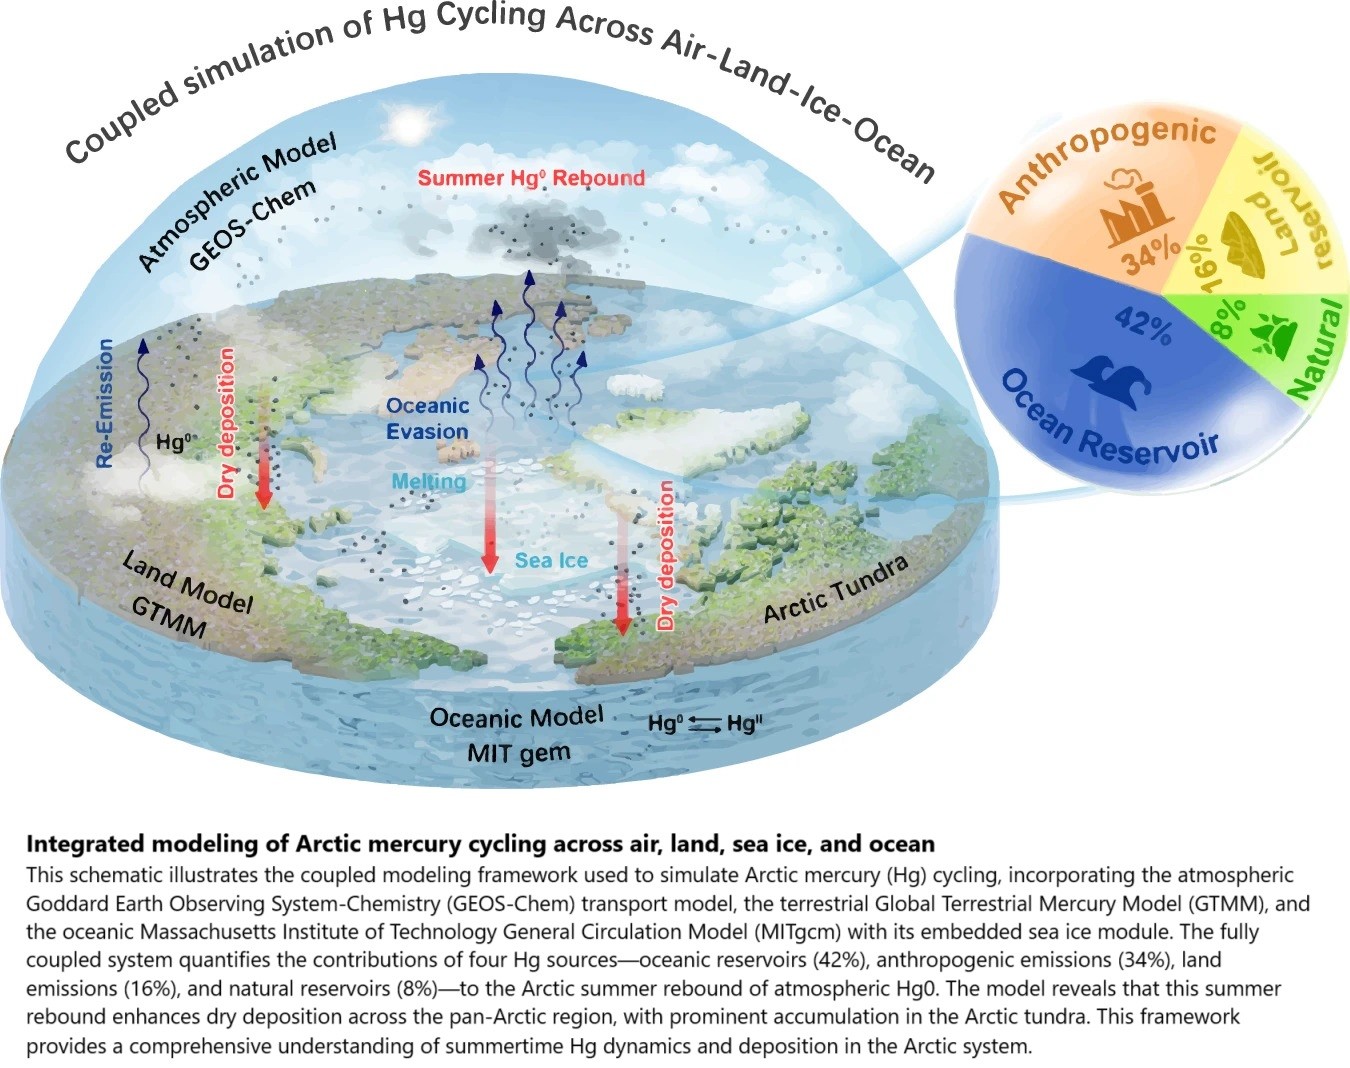
Oceanic Evasion Fuels Arctic Summertime Rebound Of Atmospheric Mercury And Drives Transport To Arctic Terrestrial Ecosystems
--
https://doi.org/10.1038/s41467-025-56300-3 <-- shared paper
--
#GIS #spatial #mapping #mercury #Hg #contamination #summerrebound #arctic #summertime #atmospheric #transport #contaminate #terrestrial #ecosystems #Hg0 #model #modeling #framework #spatialanalysis #spatiotemporal #concentrations #seaice #atmosphere #river #riverine #GDAS #GEOS #GEOSChem #MERRA2 #GTMM #global #NDVI #remotesensing #cycling #marine #ocean #water #hydrology #seawater #icemelt #anthropogenic #coast #coastal #tundra #permafrost #climatechange #evasion #vegetation #uptake #mitigation
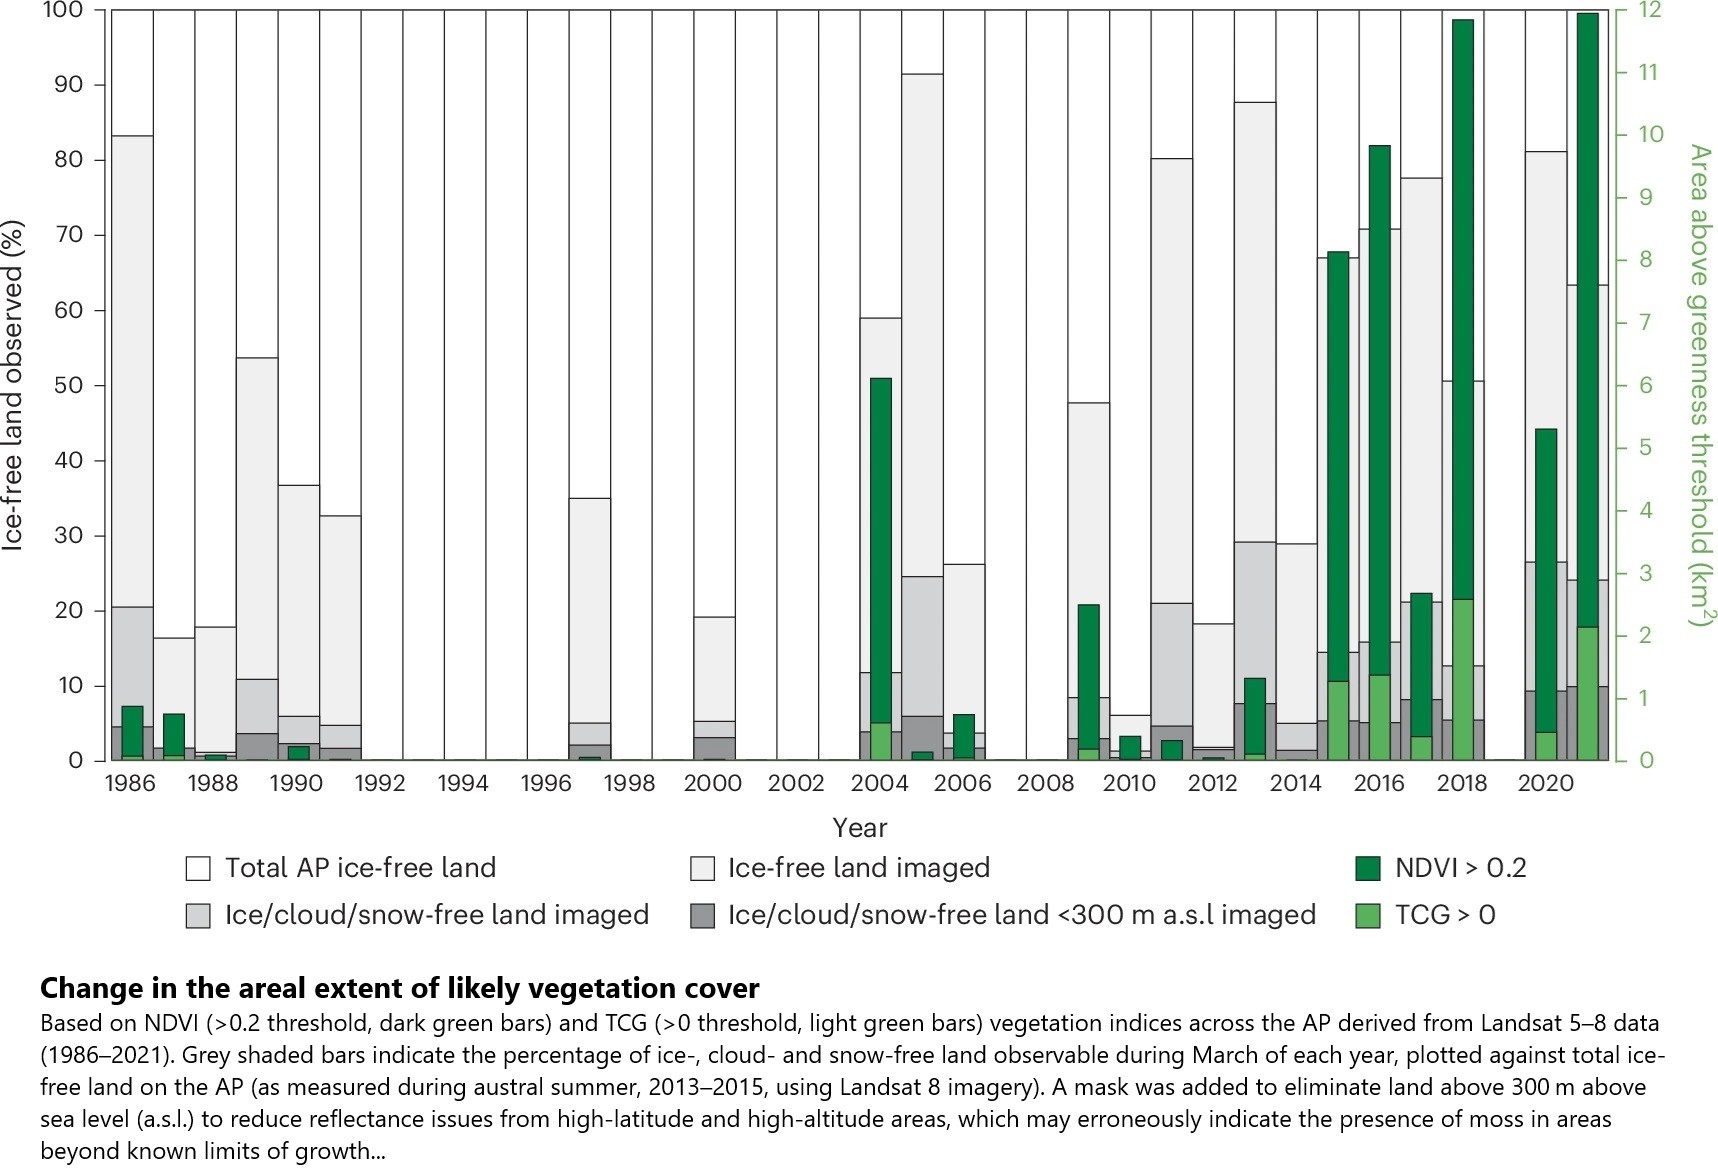
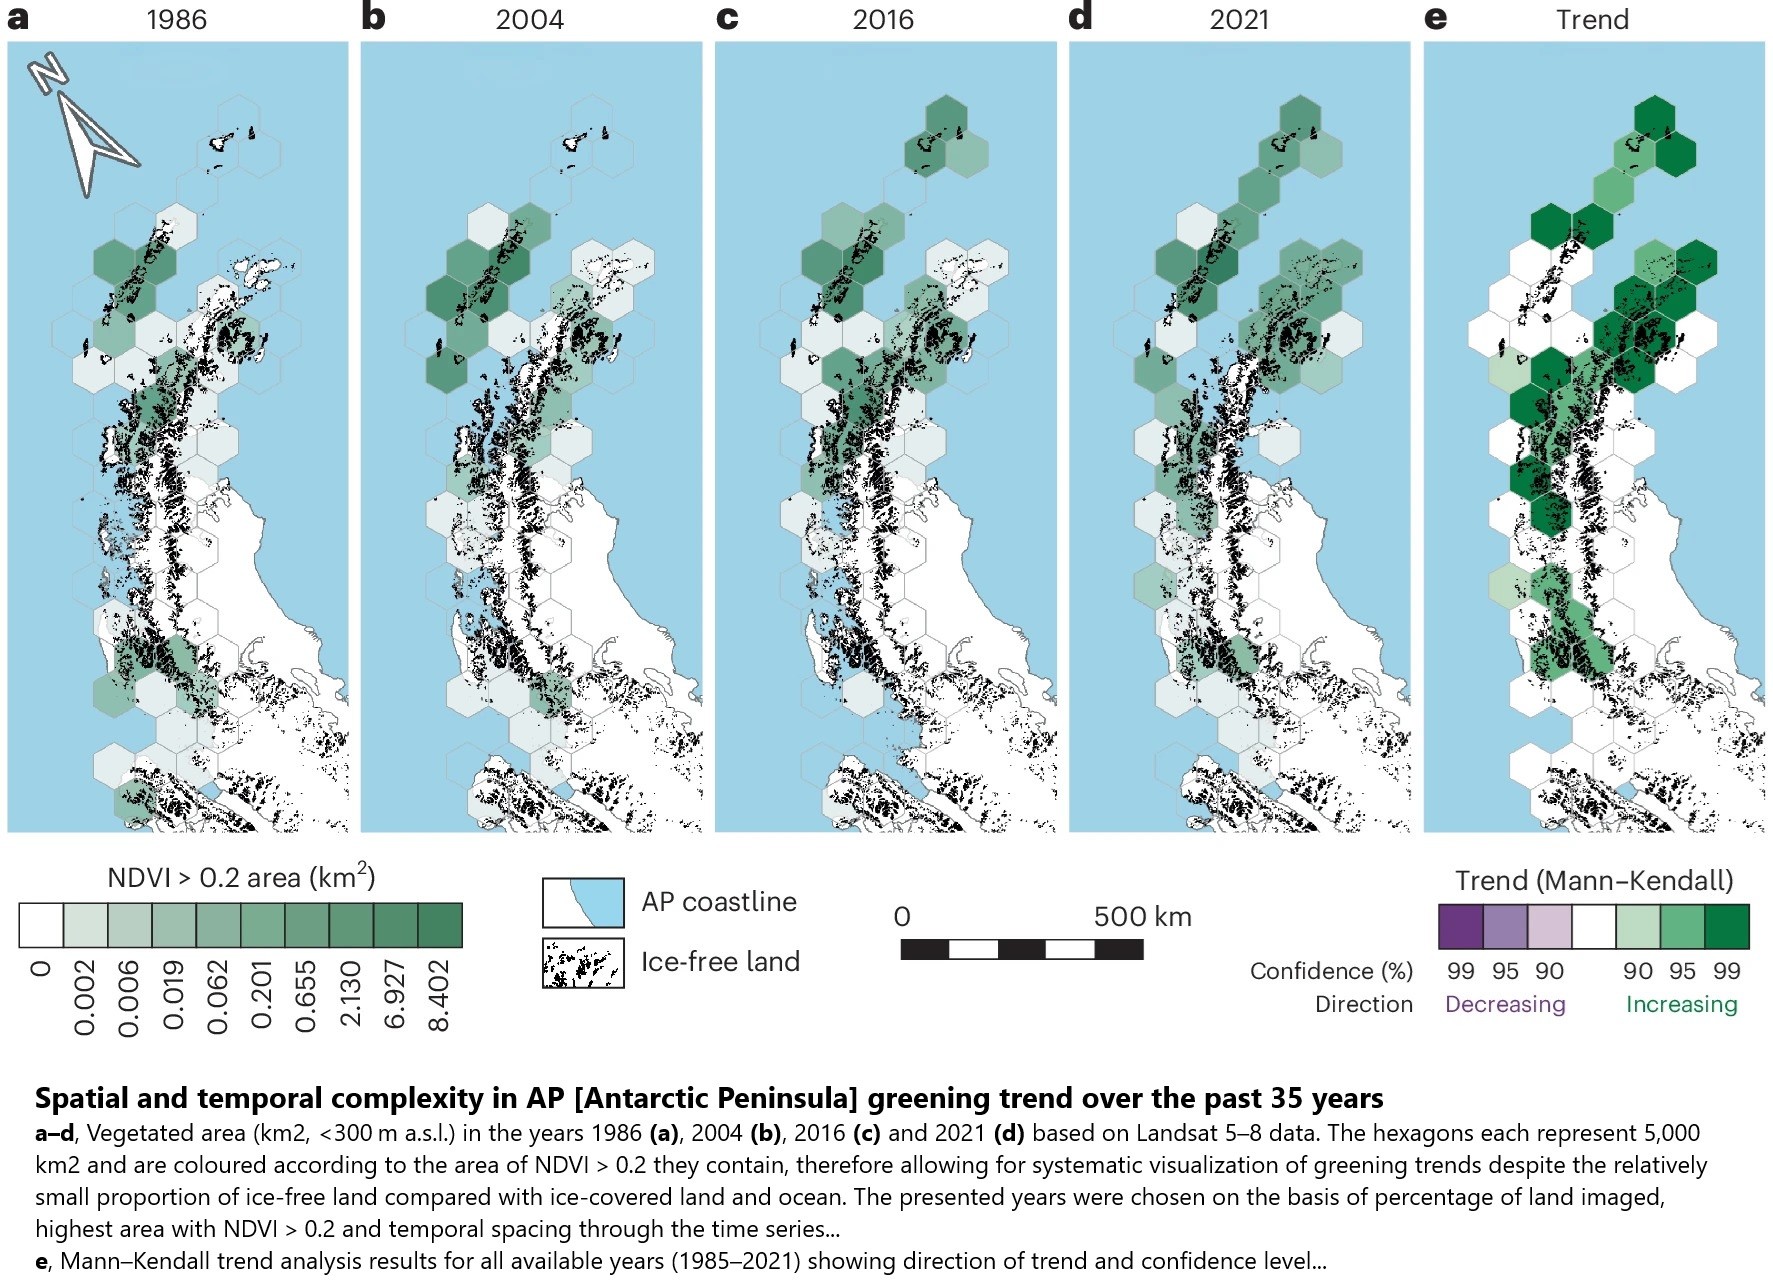
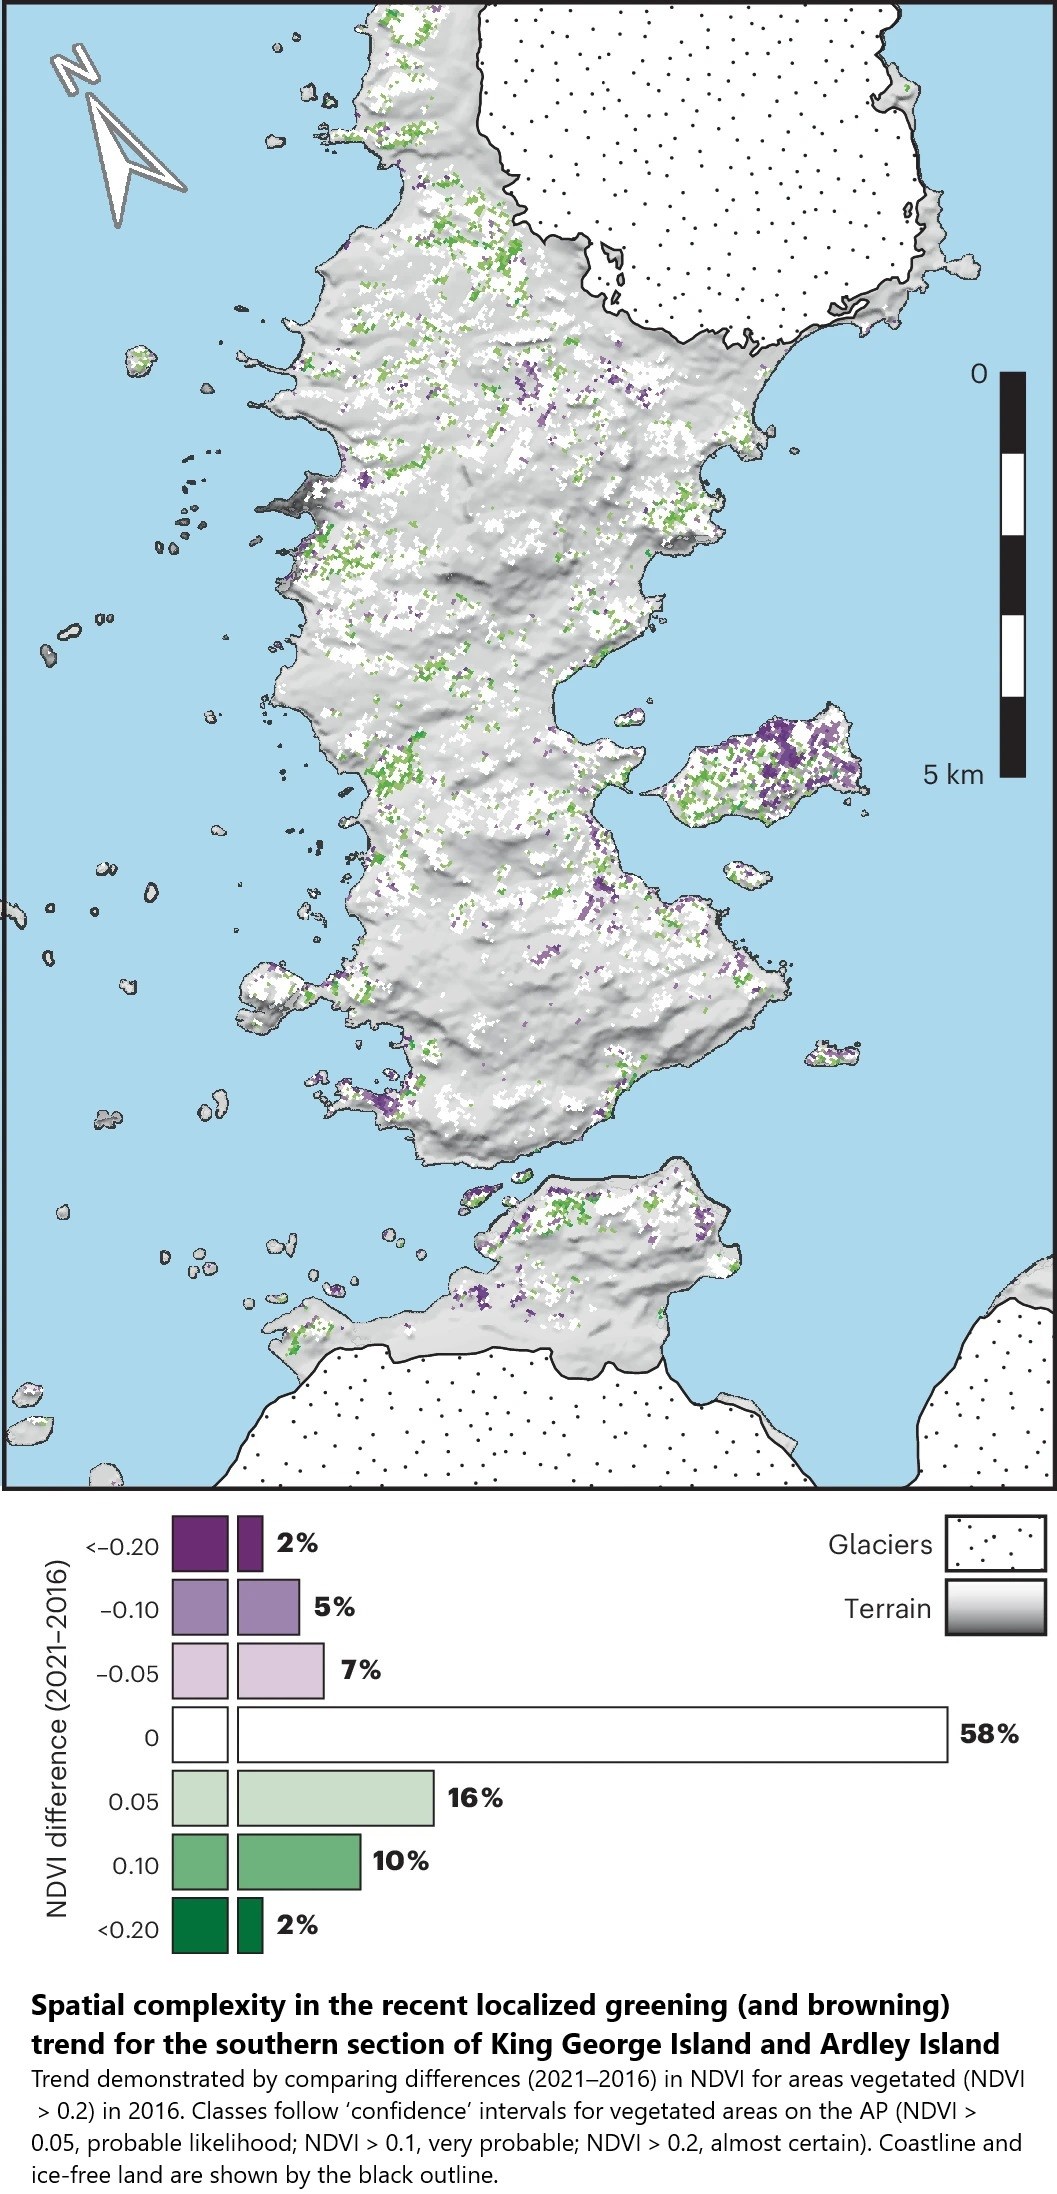
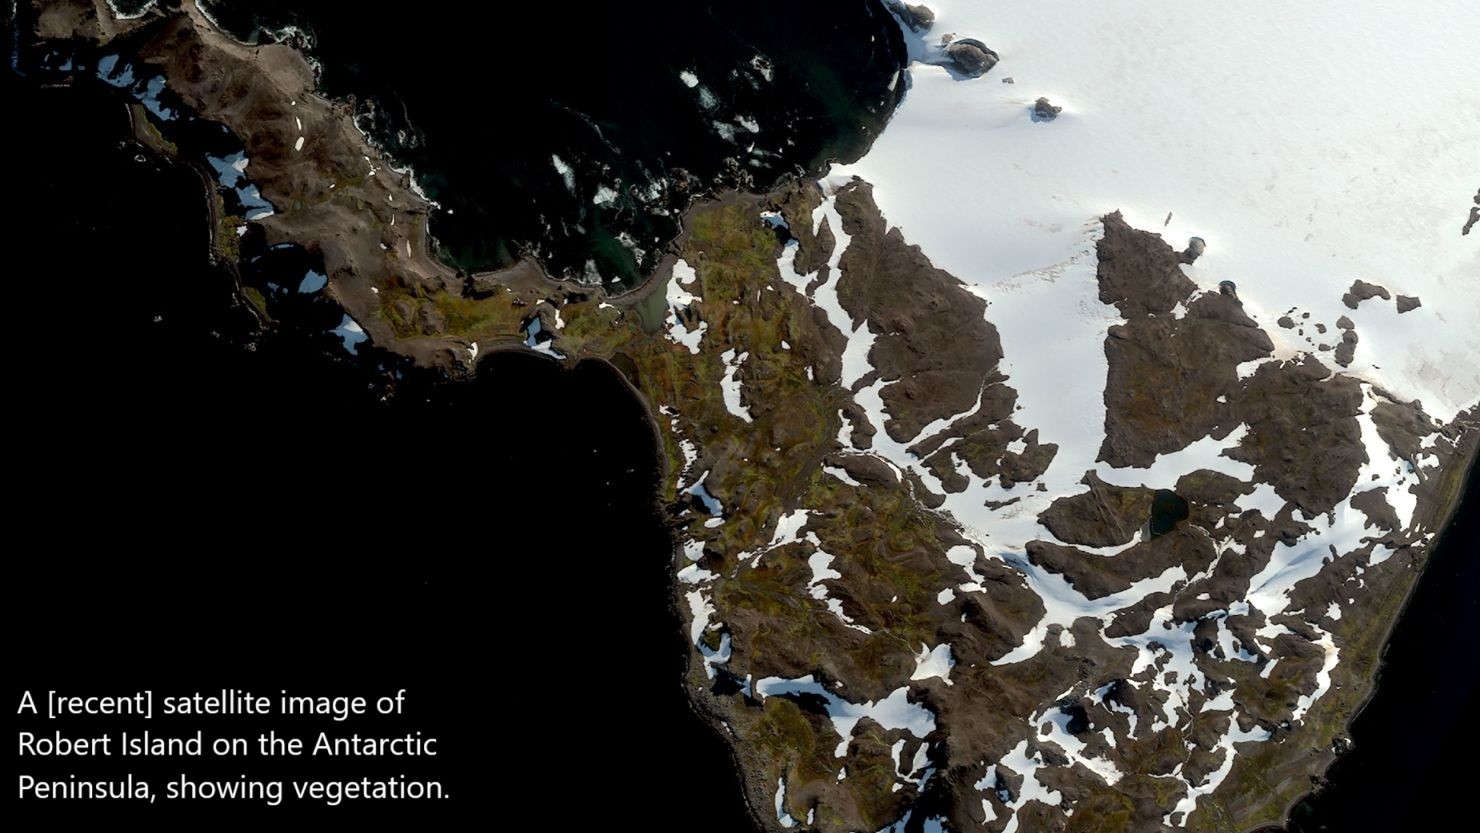
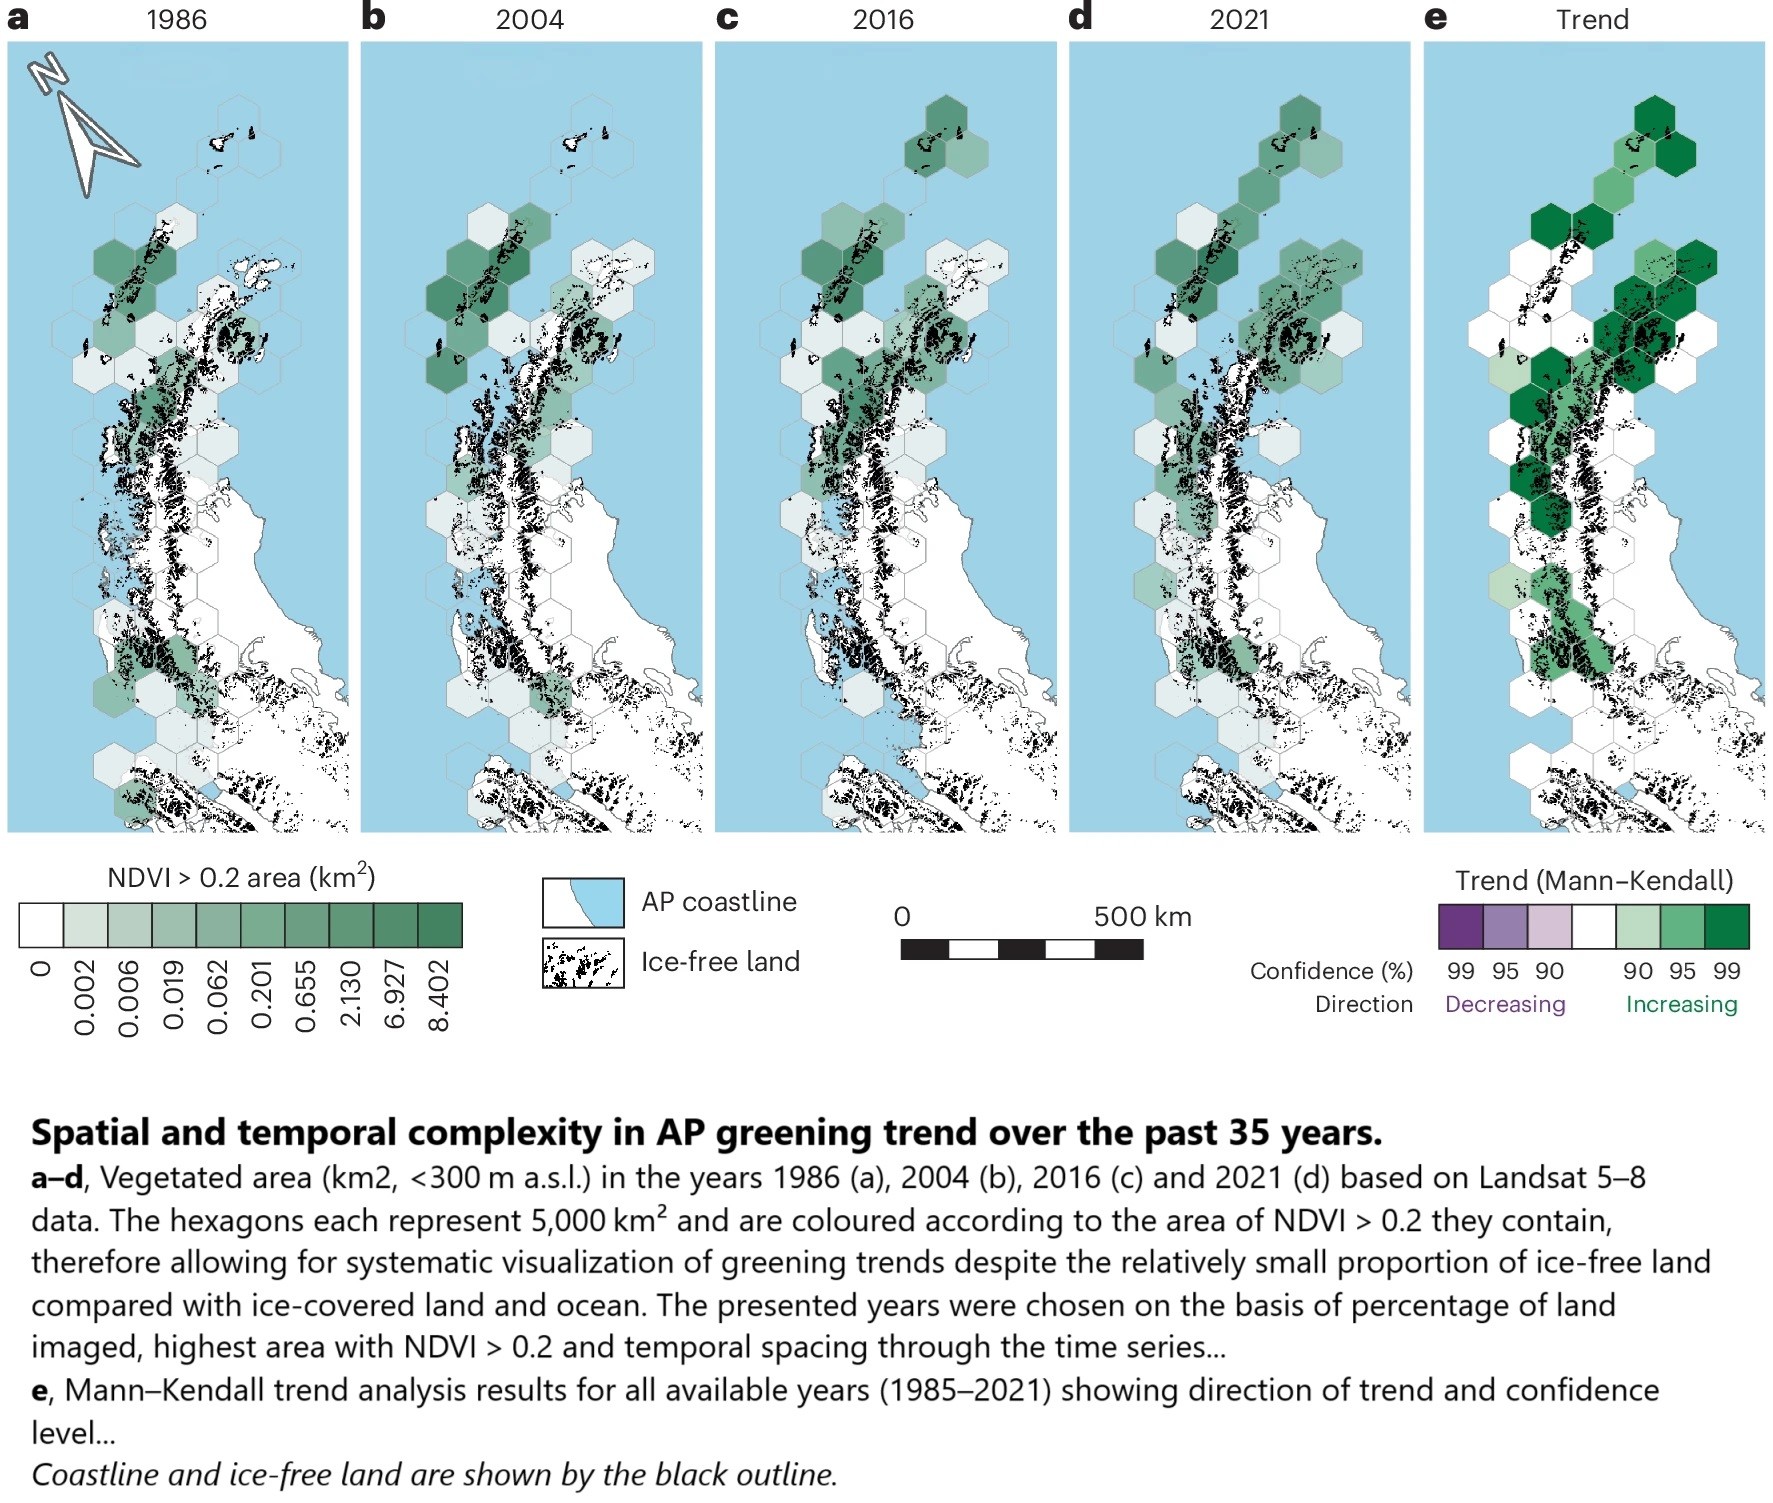
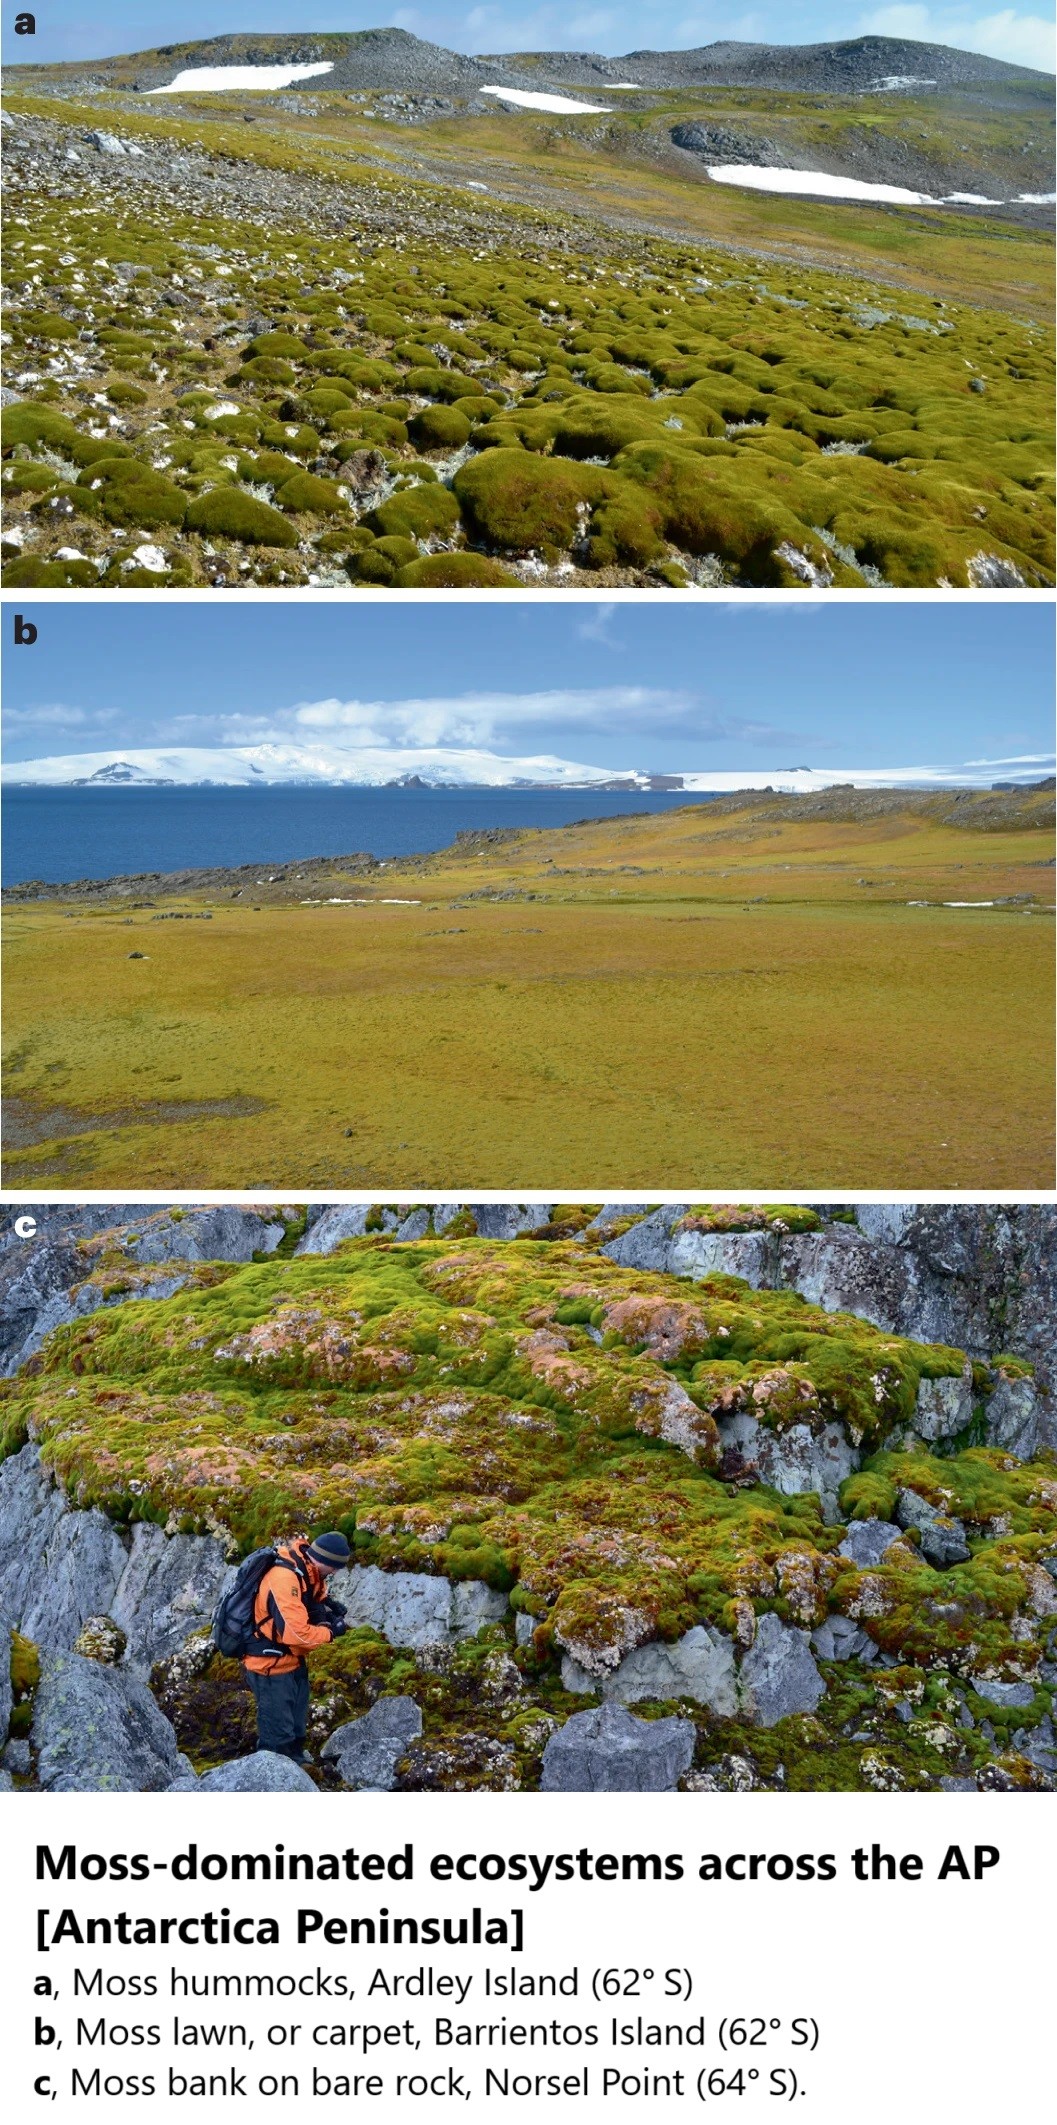
Striking Satellite Images Reveal Antarctica Is 10 Times Greener Than 35 Years Ago
--
https://www.sciencealert.com/striking-satellite-images-reveal-antarctica-is-10-times-greener-than-35-years-ago <-- shared technical article
--
https://doi.org/10.1038/s41561-024-01564-5 <-- shared paper
--
#GIS #spatial #mapping #remotesensing #landsat #change #Antarctic #AntarcticPeninsula #spatialanalysis #spatiotemporal #climatechange #greening #vegetation #change #warming #satellite #browning #cryosphere #anthropogenic #warming #moss #terrestrial #ecosystems #GoogleEarthEngine #NDVI #TCG #icefree #model #modeling
![photos - Moss-dominated ecosystems across the AP [Antarctic Peninsula]](https://files.mastodon.social/cache/media_attachments/files/113/632/144/276/548/722/original/a83884f3f568b270.jpg)
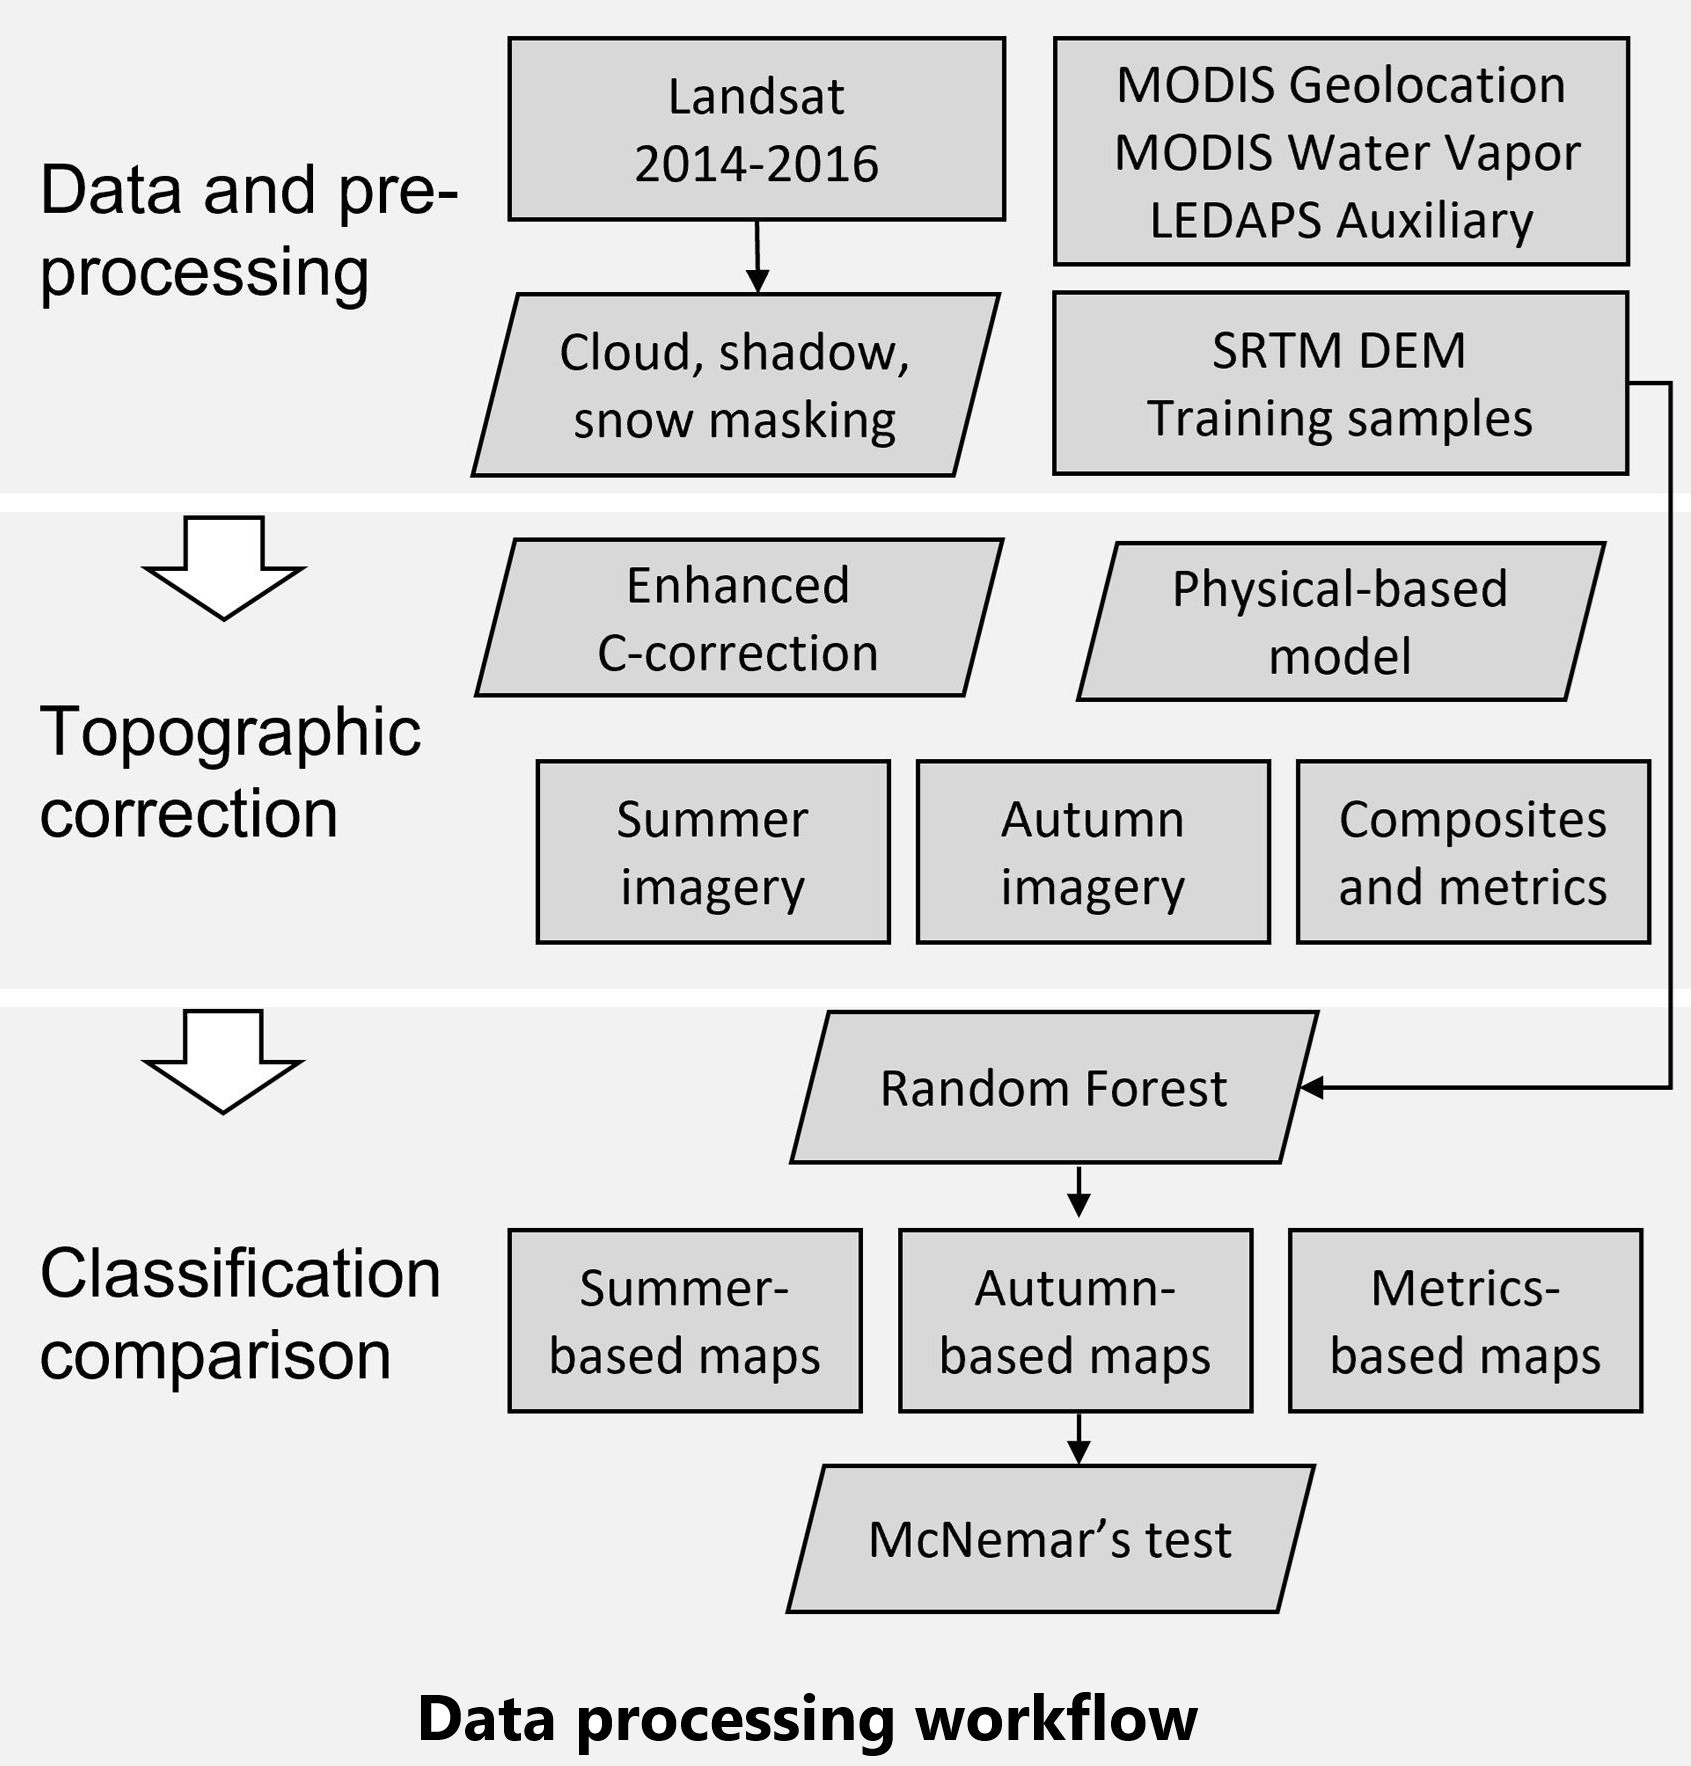
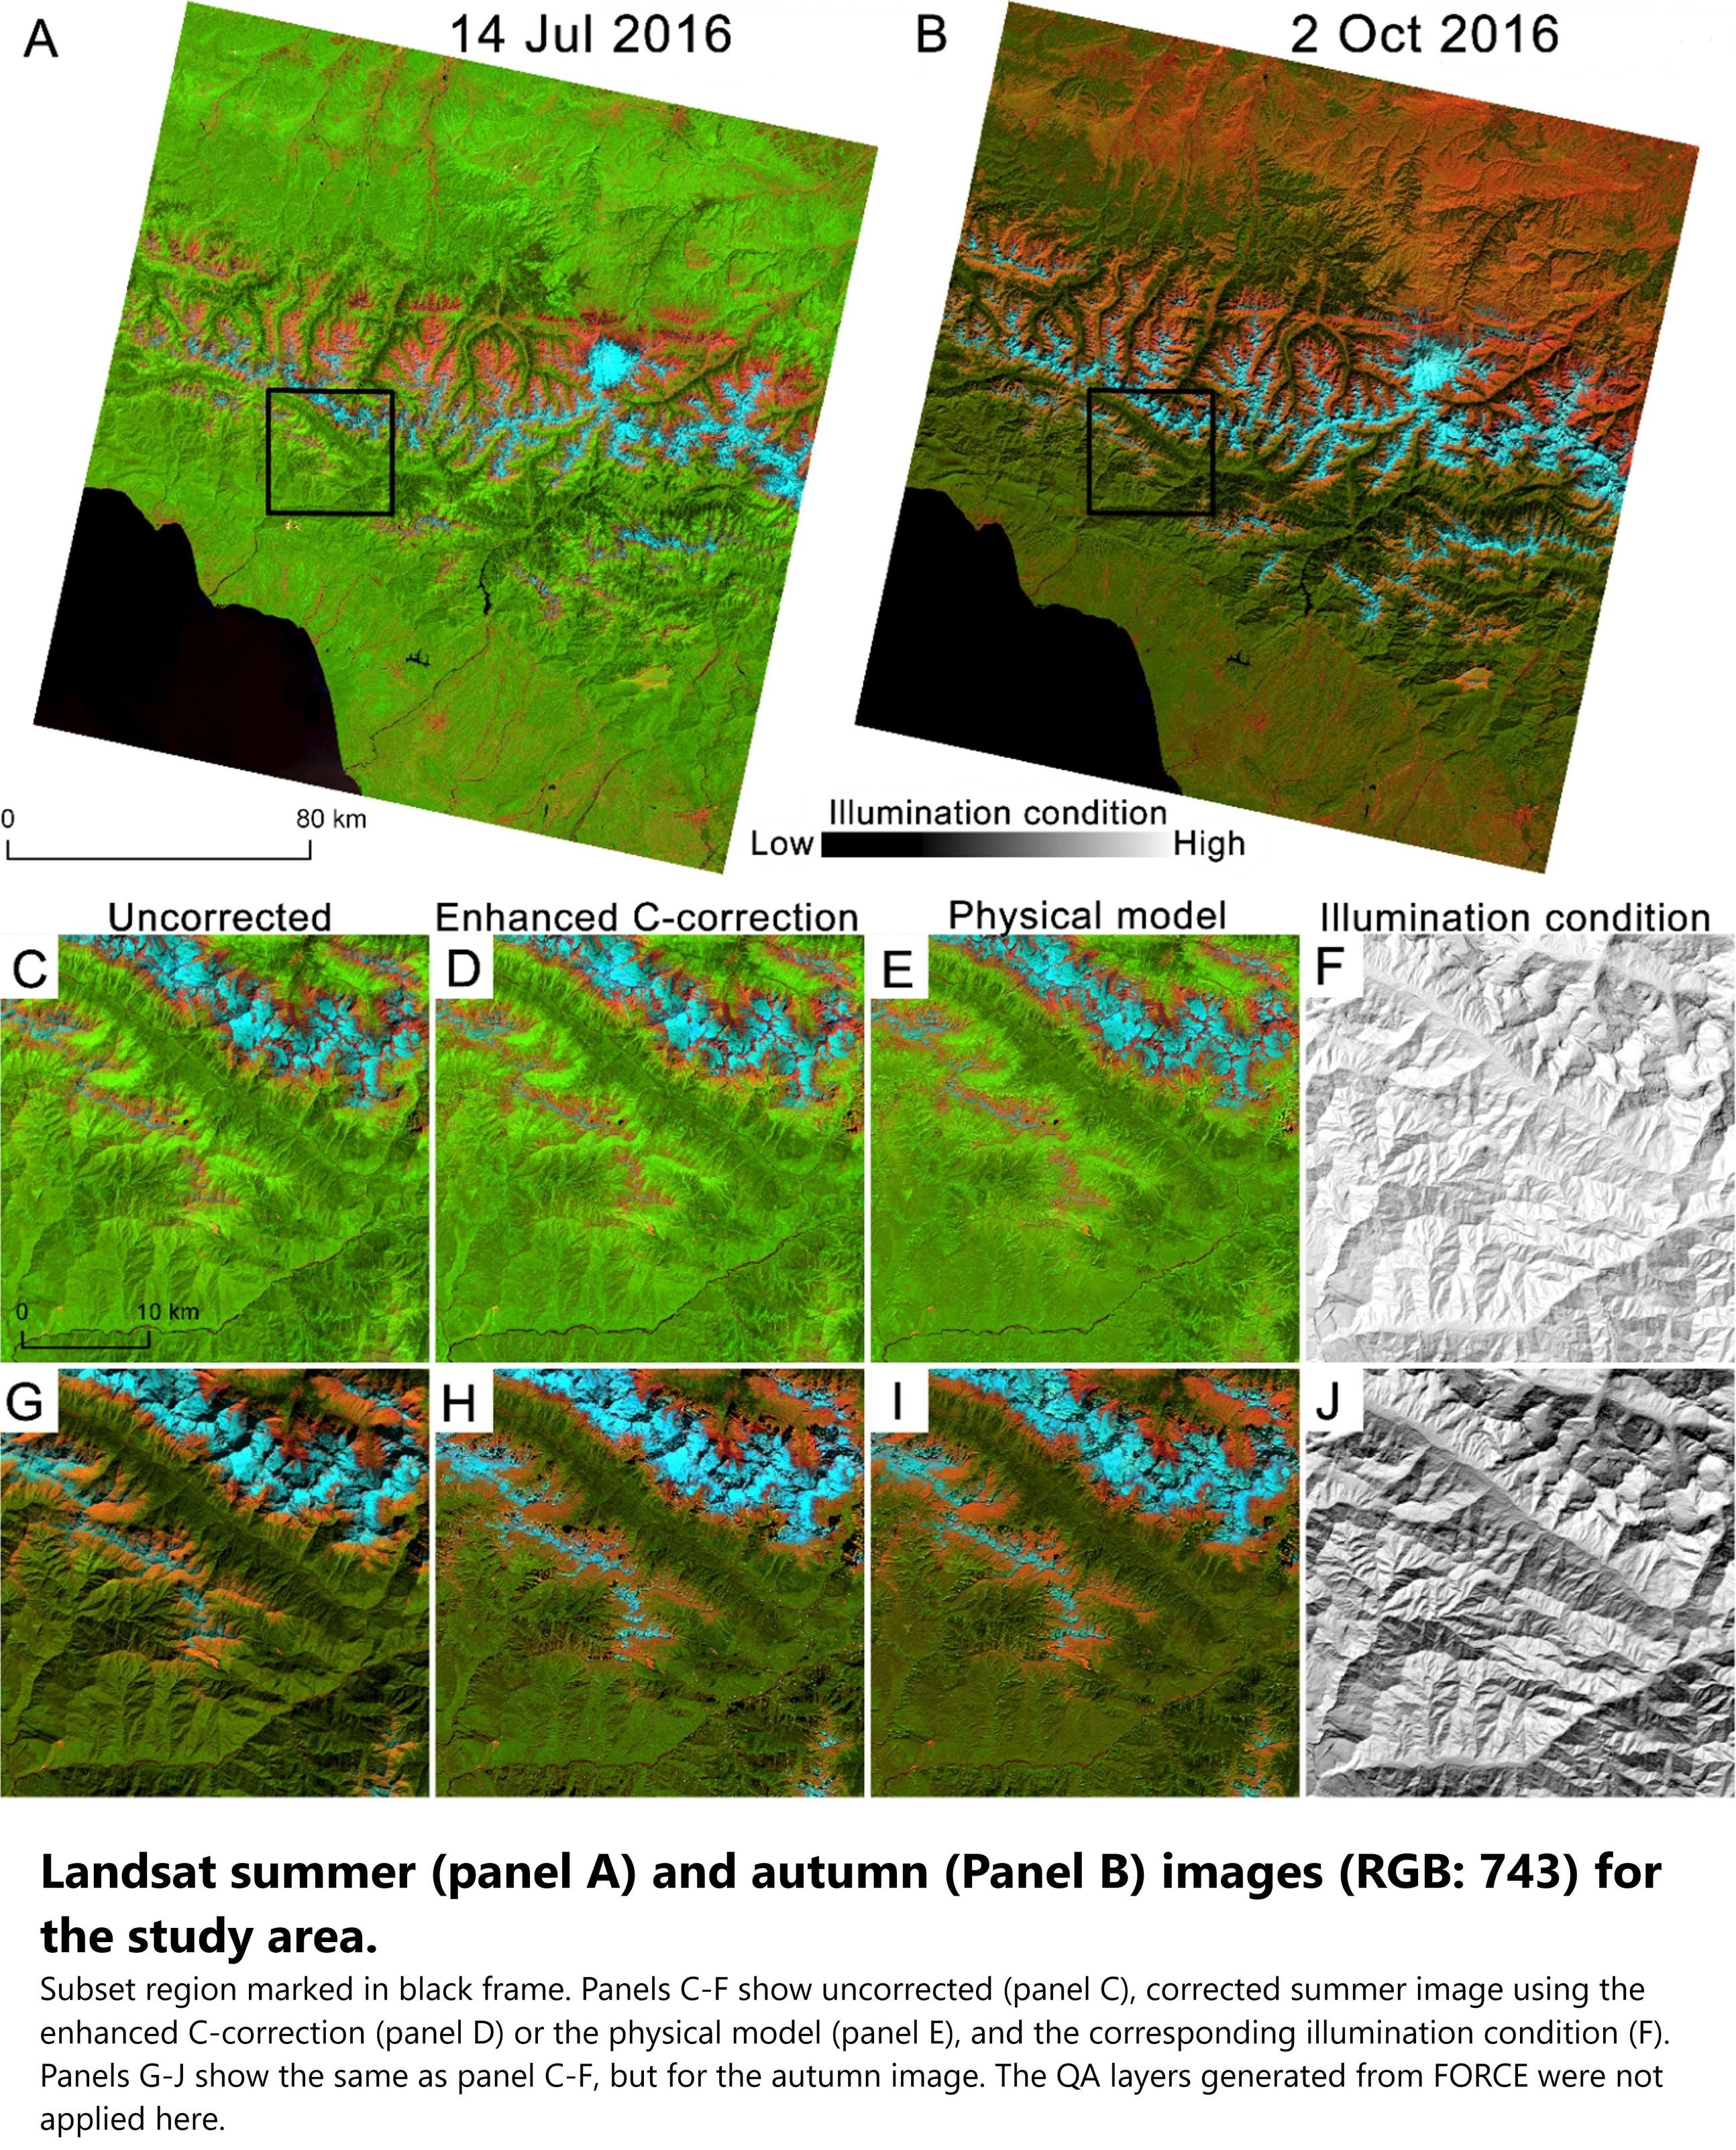
Integrated Topographic Corrections Improve Forest Mapping Using Landsat Imagery
--
https://doi.org/10.1016/j.jag.2022.102716 <-- shared 2022 paper
--
“HIGHLIGHTS:
• [They] evaluated the impacts of topographic correction on forest mapping in the mountains.
• The enhanced C-correction and the physical model reduced topographic effects.
• The corrected Landsat imagery time series resulted in higher accuracy.
• Terrain information improved classification but not as much as topographic correction.
• [They] recommend using topographic correction for forest cover mapping..."
#GIS #spatial #AtmosphericCorrection #IlluminationCondition #LandCover #ModelComparison #TimeSeries #TopographicCorrection #remotesensing #comparasion #topographic #correction #NDVI #forest #vegetation #model #modeling #spatialanalyis #accuracy #forestcover #Russia #Georgia #CaucasusMountains #spatiotemporal #landsat #elevation #DEM
![map - Forest cover classification agreement among the 18 sets of input variables. Pixels in red color were classified by all sets of input variables as coniferous, in green color as broadleaf forest, and in blue color as mixed forest. Black color indicates that no forest was predicted by any set of input variables. Two subsets A and B which are marked in white frames were zoomed in for a detailed map comparison in [another figure]](https://files.mastodon.social/cache/media_attachments/files/113/587/533/215/723/867/original/052c2a4ce1a6e92b.jpg)
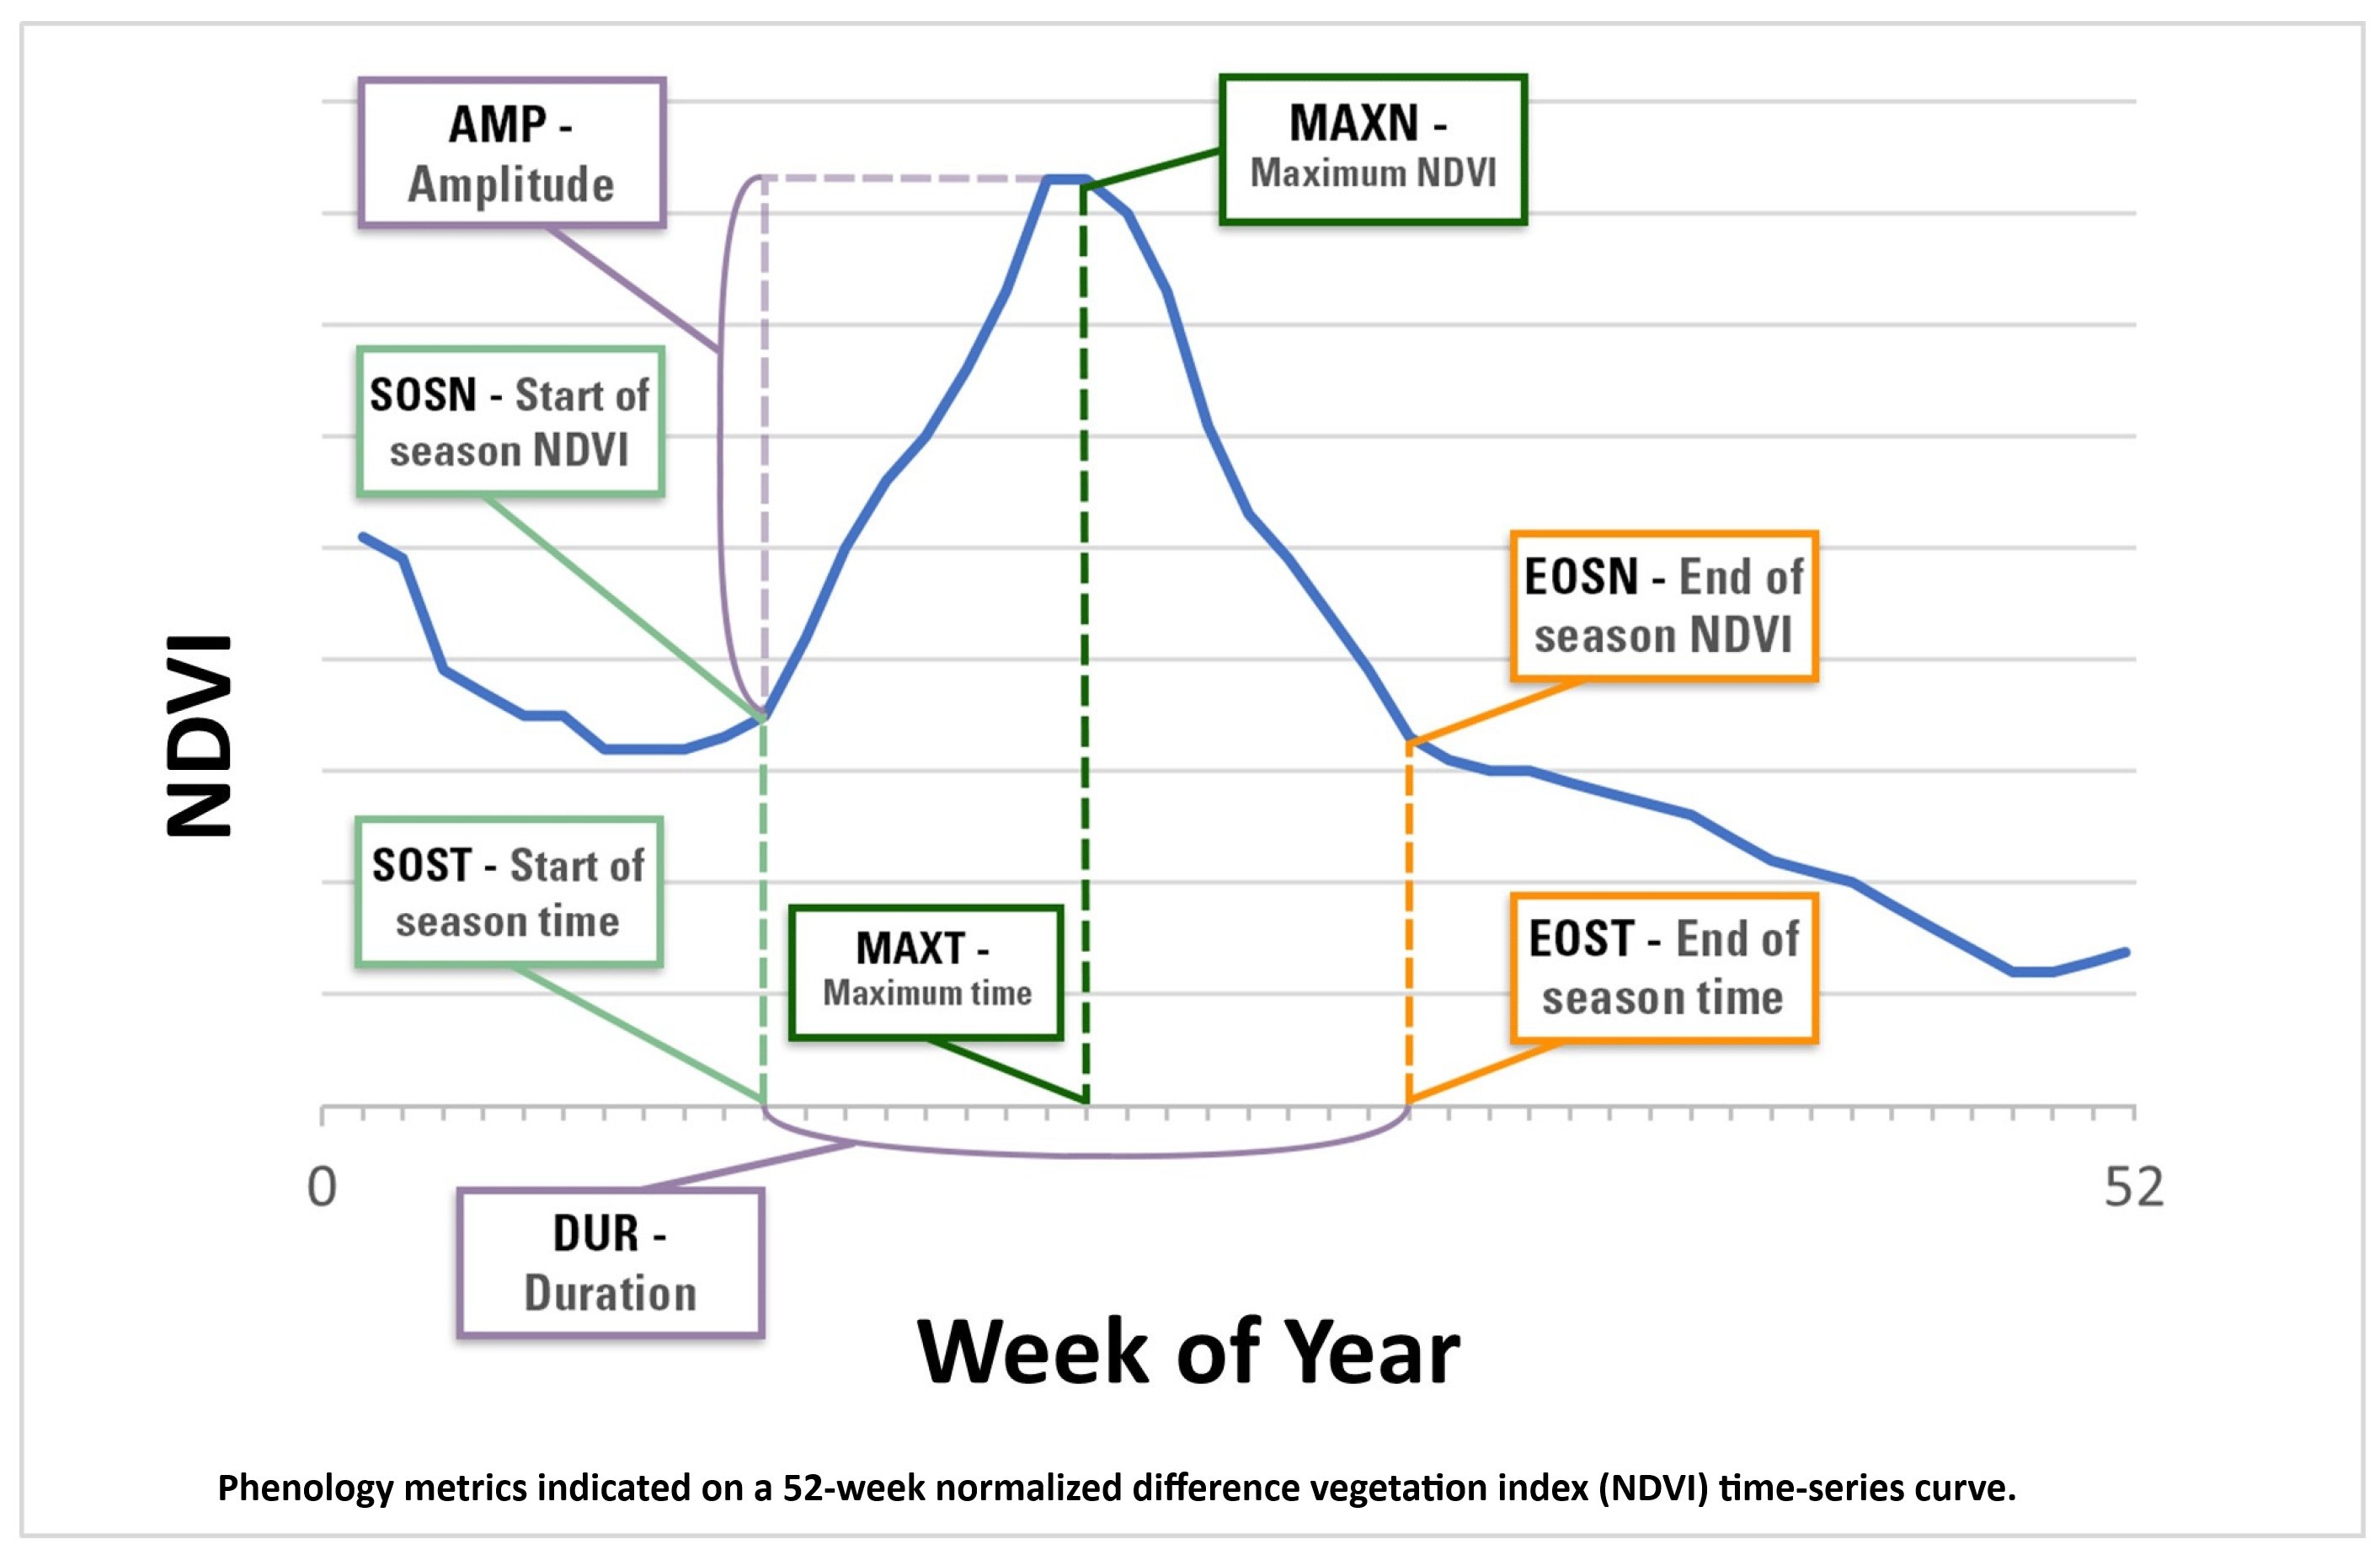
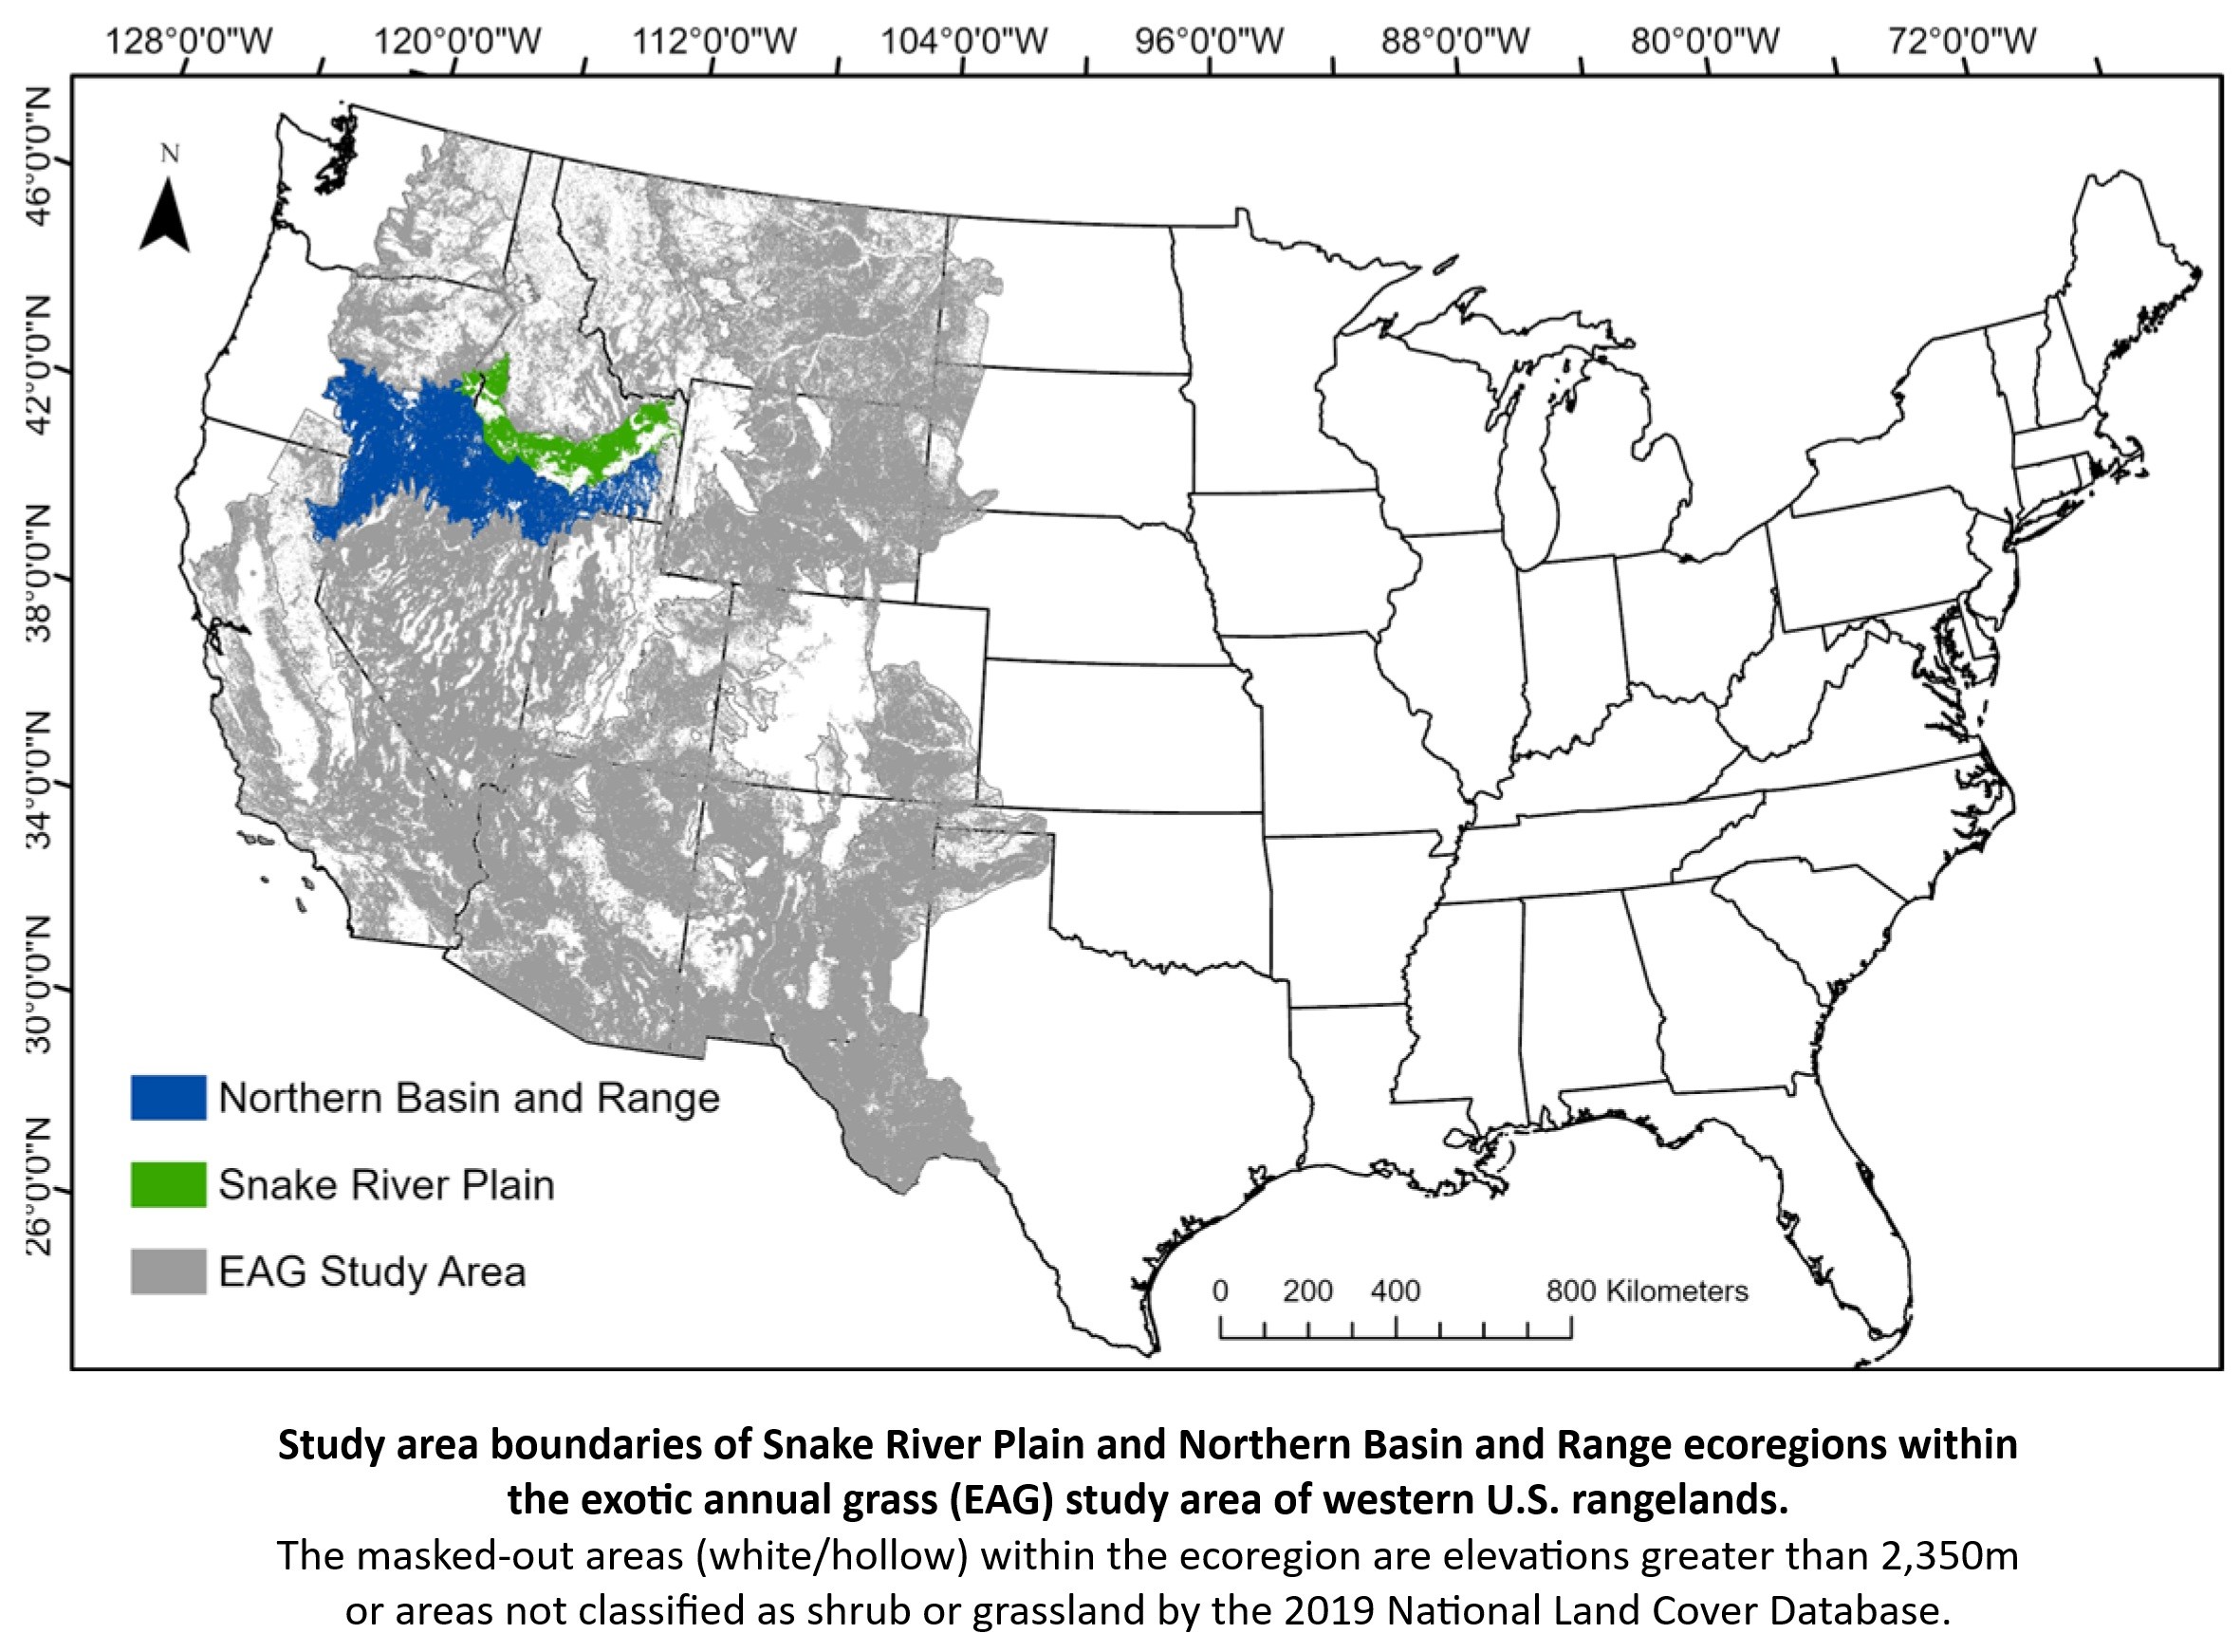
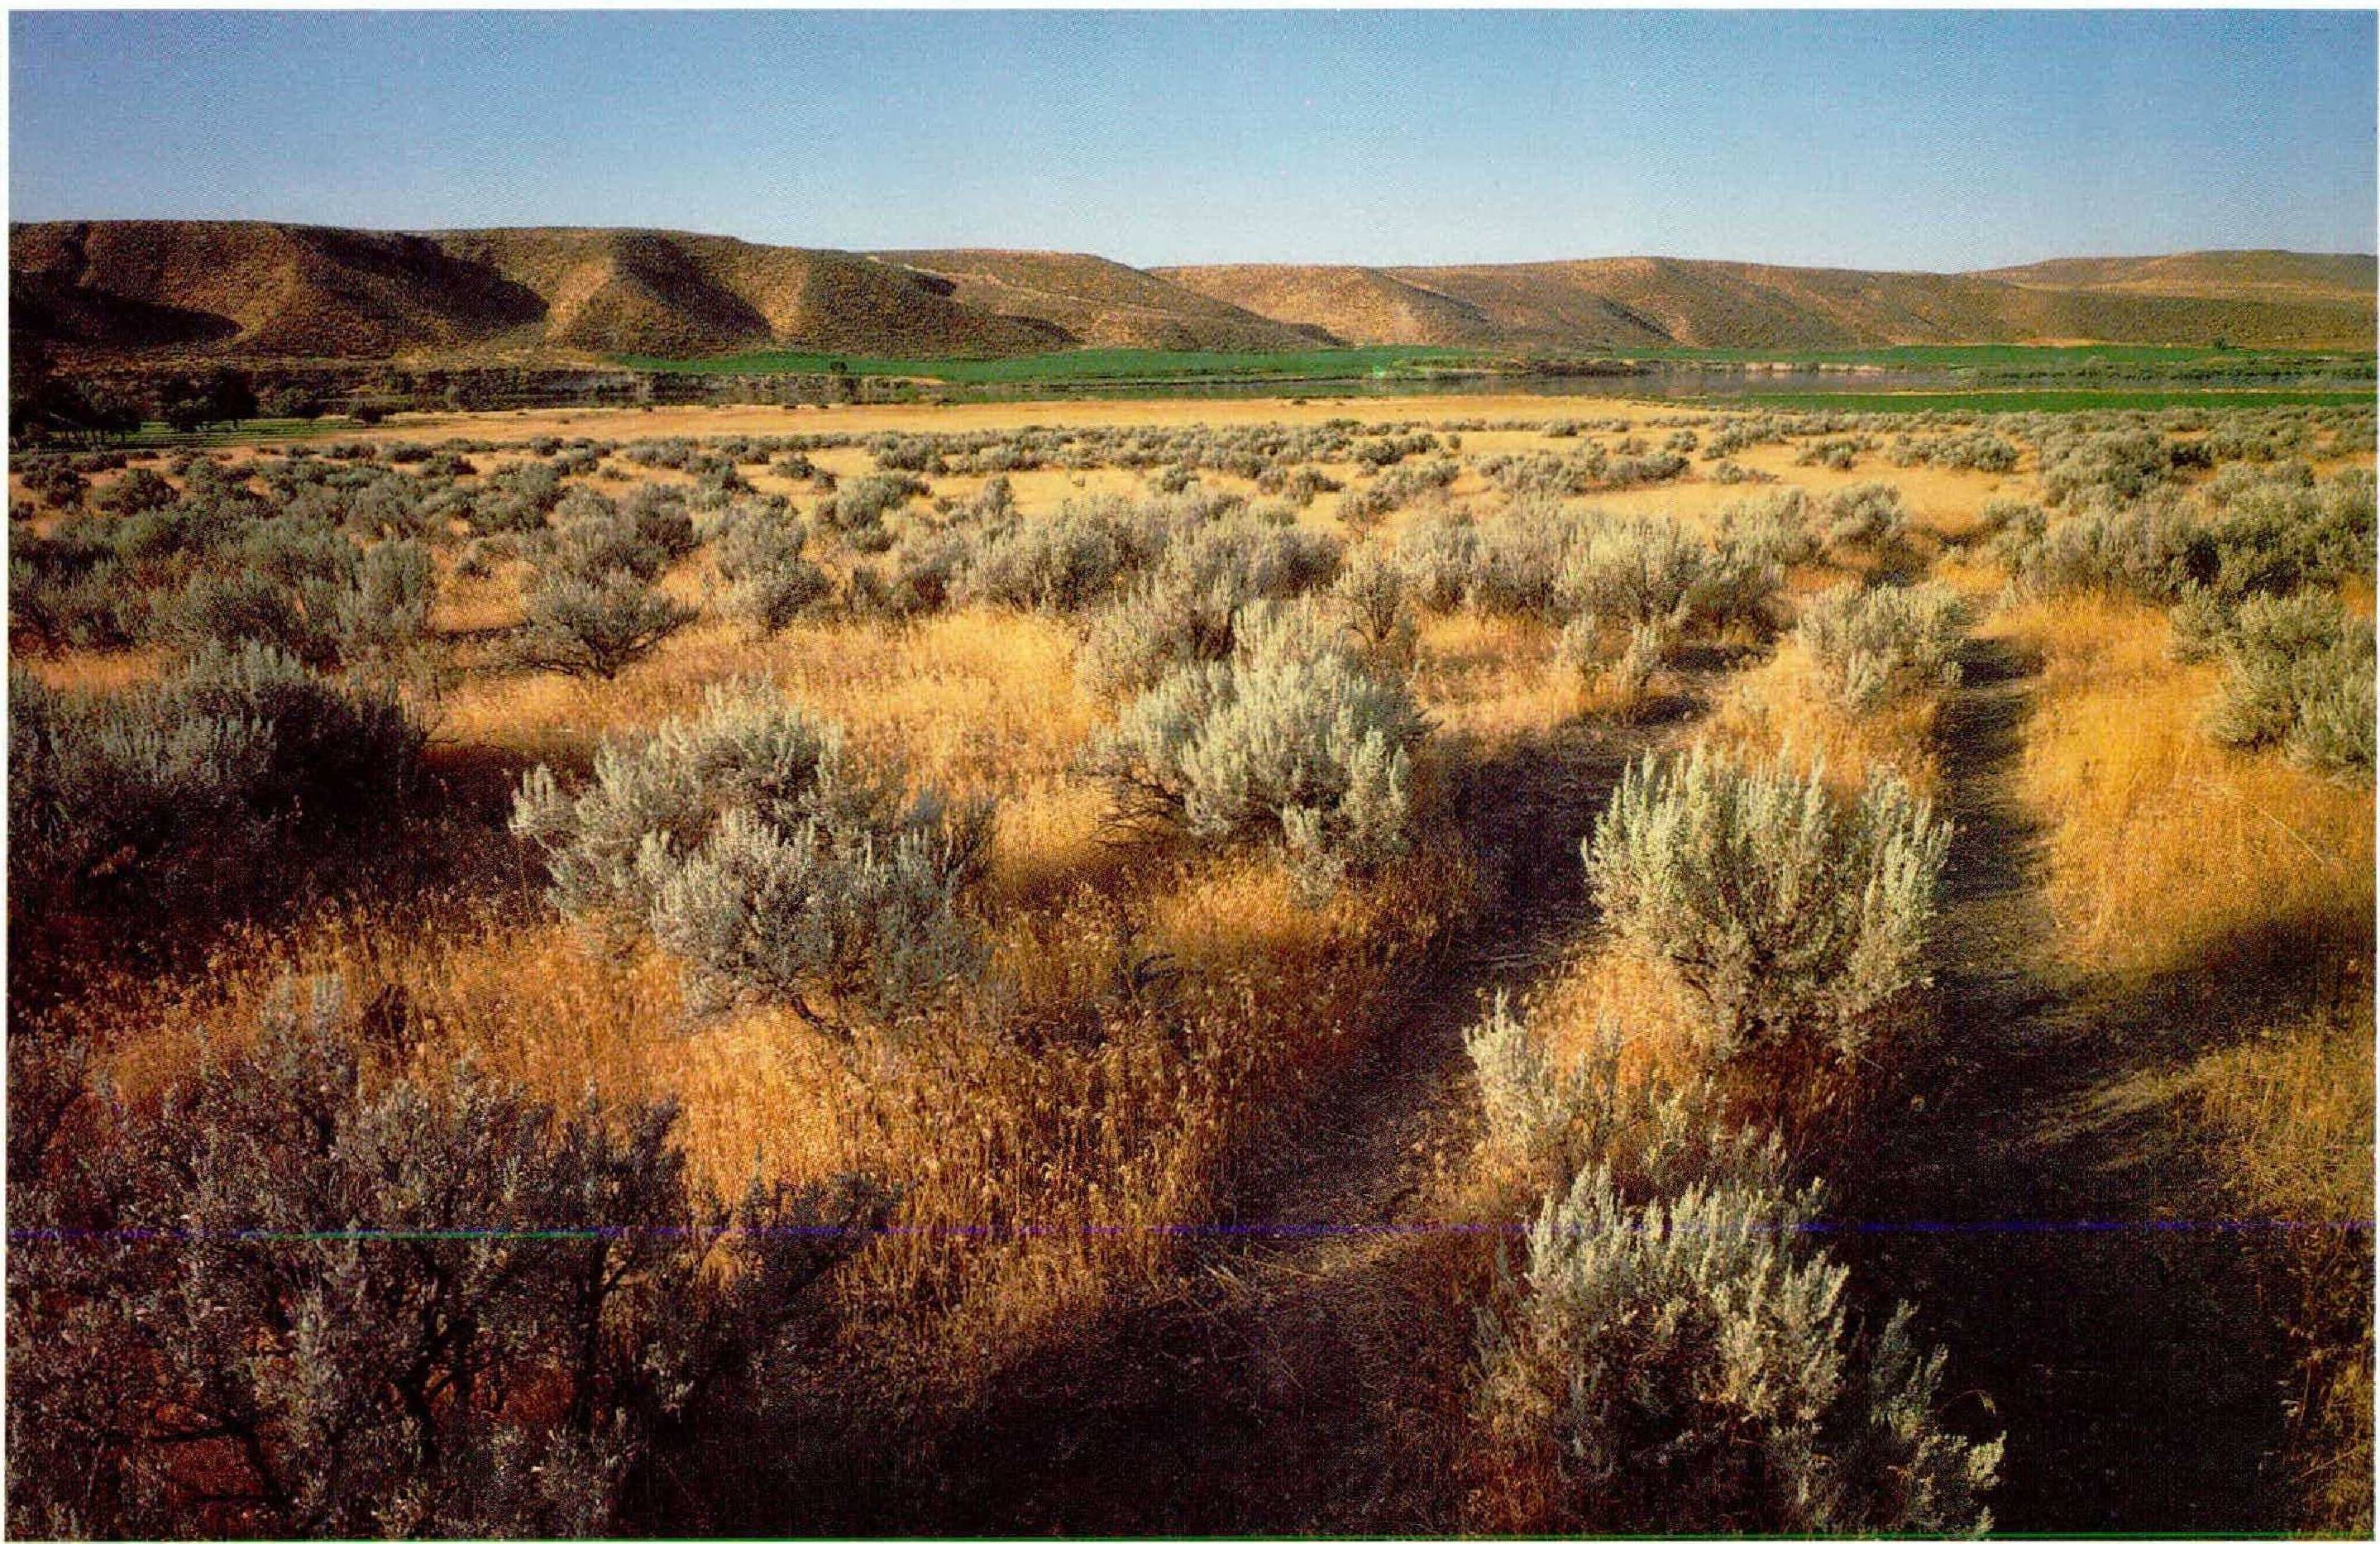
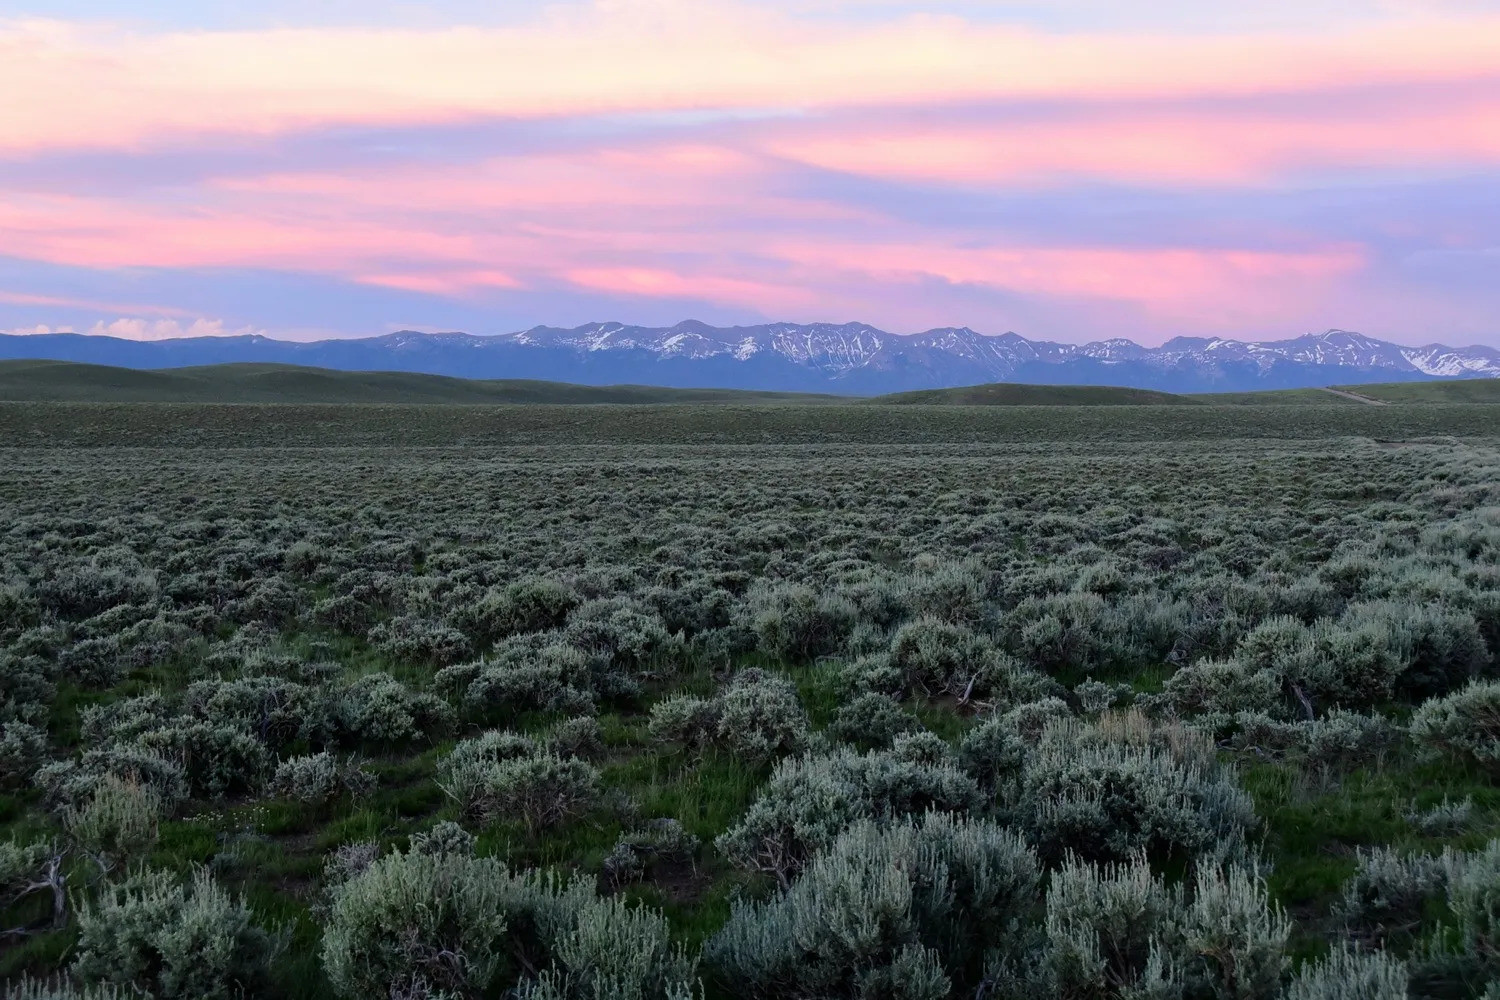
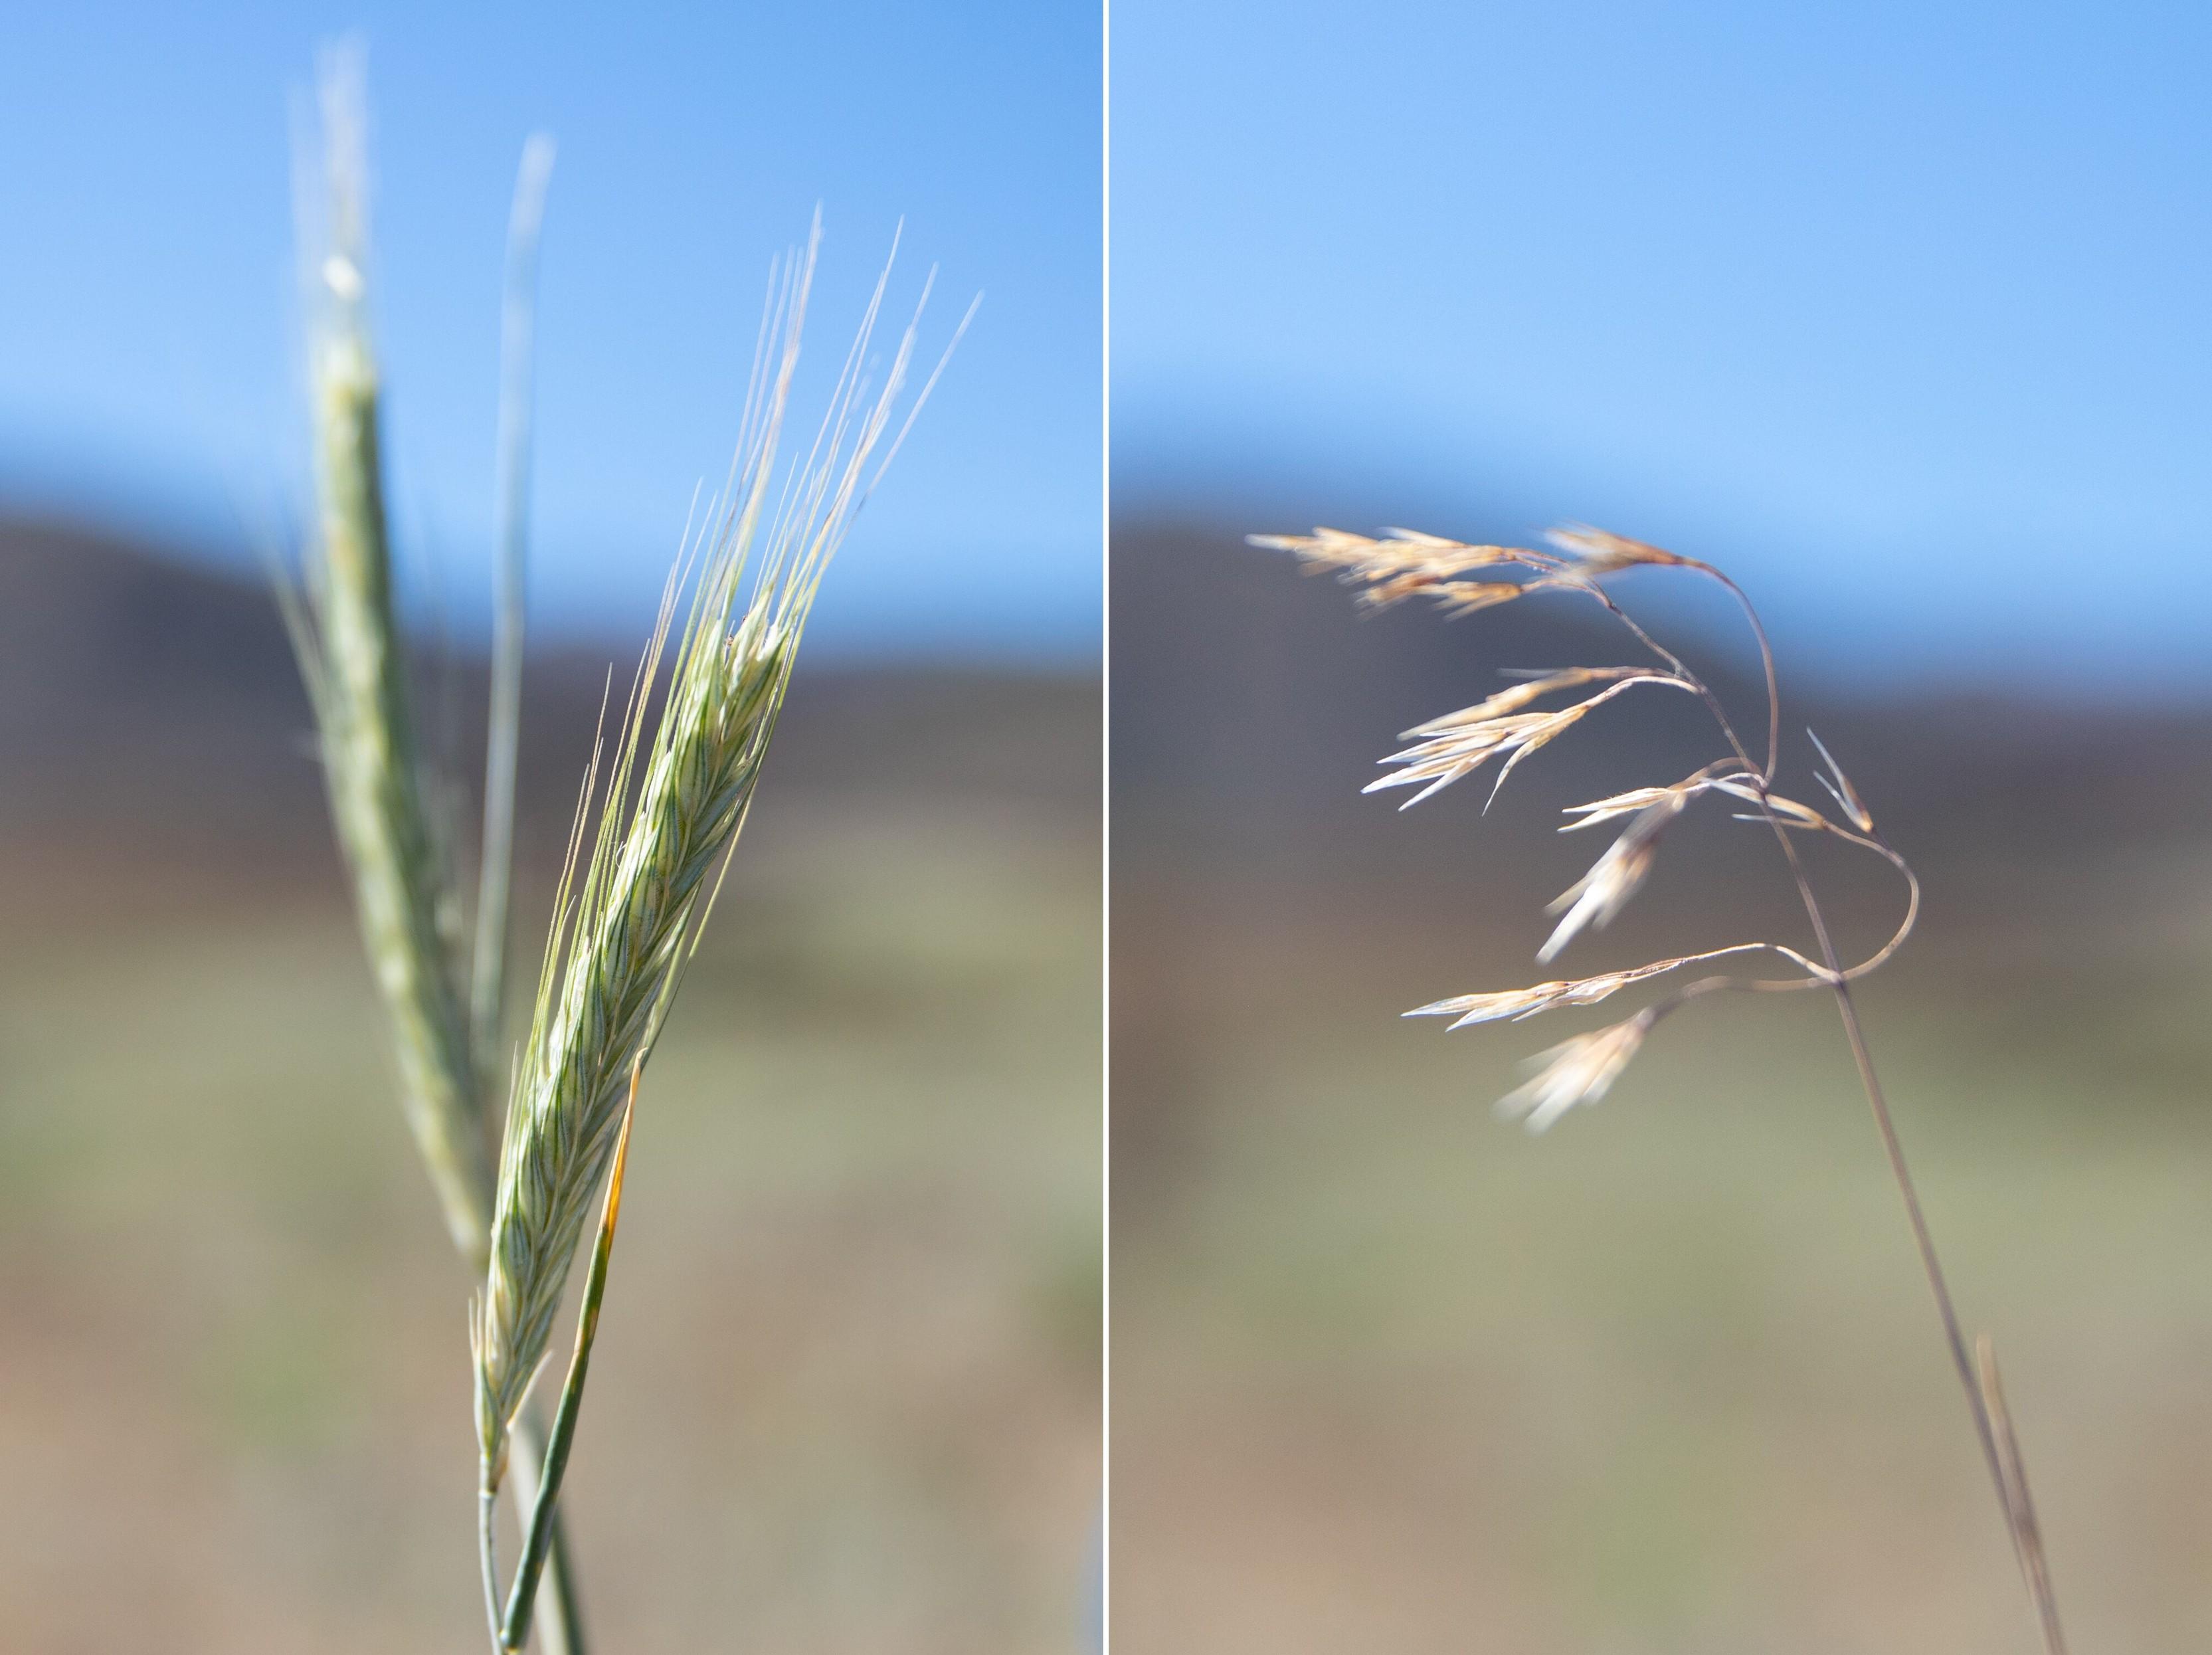
Differentiating Cheatgrass And Medusahead Phenological Characteristics In Western United States Rangelands [remote sensing]
--
https://doi.org/10.3390/rs16224258 <-- shared paper
--
#GIS #spatial #mapping #vegetation #grassland #cheatgrass #medusahead #BRTE #TACA8 #phenology #growingseason #rangeland #EAG #invasivespecies #management #landmanagers #habitat #cost #loss #economicimpact #ecosystem #deterioration #impacts #USWest #spatialanalysis #spatiotemporal #model #modeling #treemodel #landsat #sentinel #HLS #satellite #remotesensing #vegetationindex #NDVI #research #testcase #corrleation #metrics #controlmeasures #herbicide #cattle #grazing #mitigation #landcover #NLDI
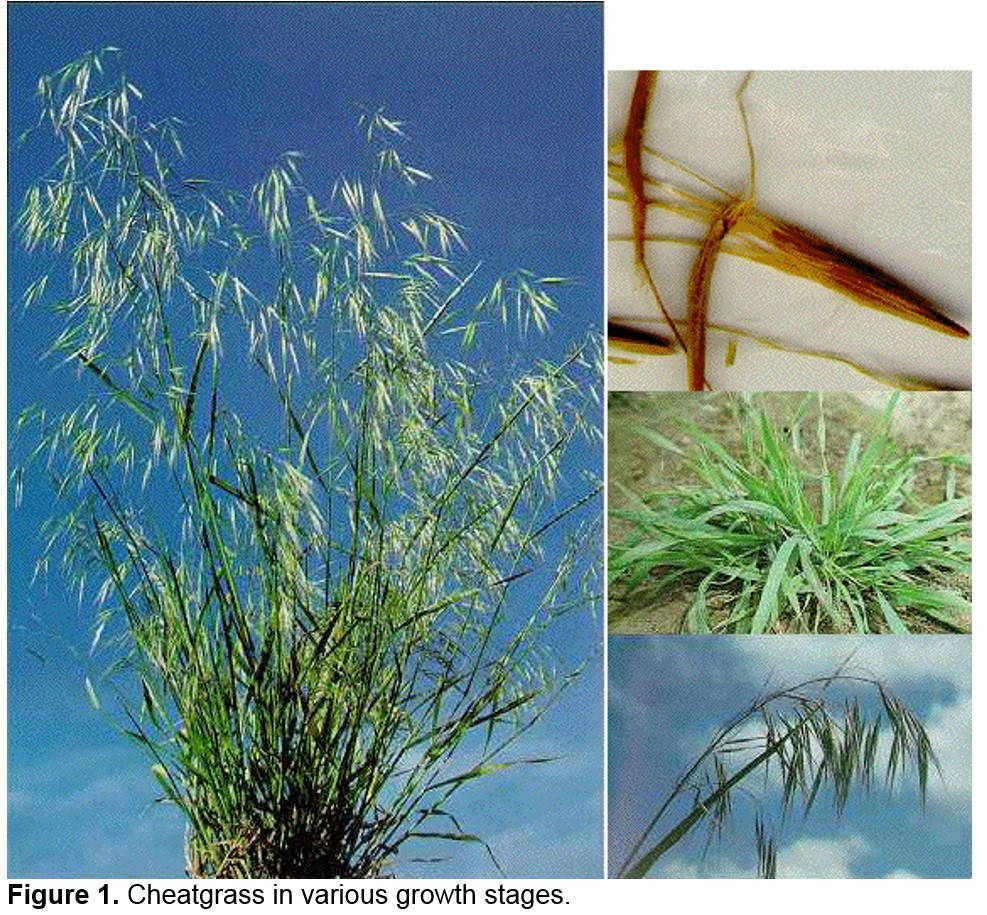
![work flow graphic - Phenology method flowchart. This flowchart is the overview of capturing the phenology training data for cheatgrass (BRTE [44]) and medusahead (TACA8)
(a) The methods for extracting high probability BRTE and TACA8 pixels
(b) the decision tree analysis development using exotic annual grass (EAG) training data from Benedict et al.
(c) developing the training data
(d) developing the phenology model.](https://files.mastodon.social/cache/media_attachments/files/113/556/797/383/305/767/original/c01cdbcb19f2ea9a.jpg)
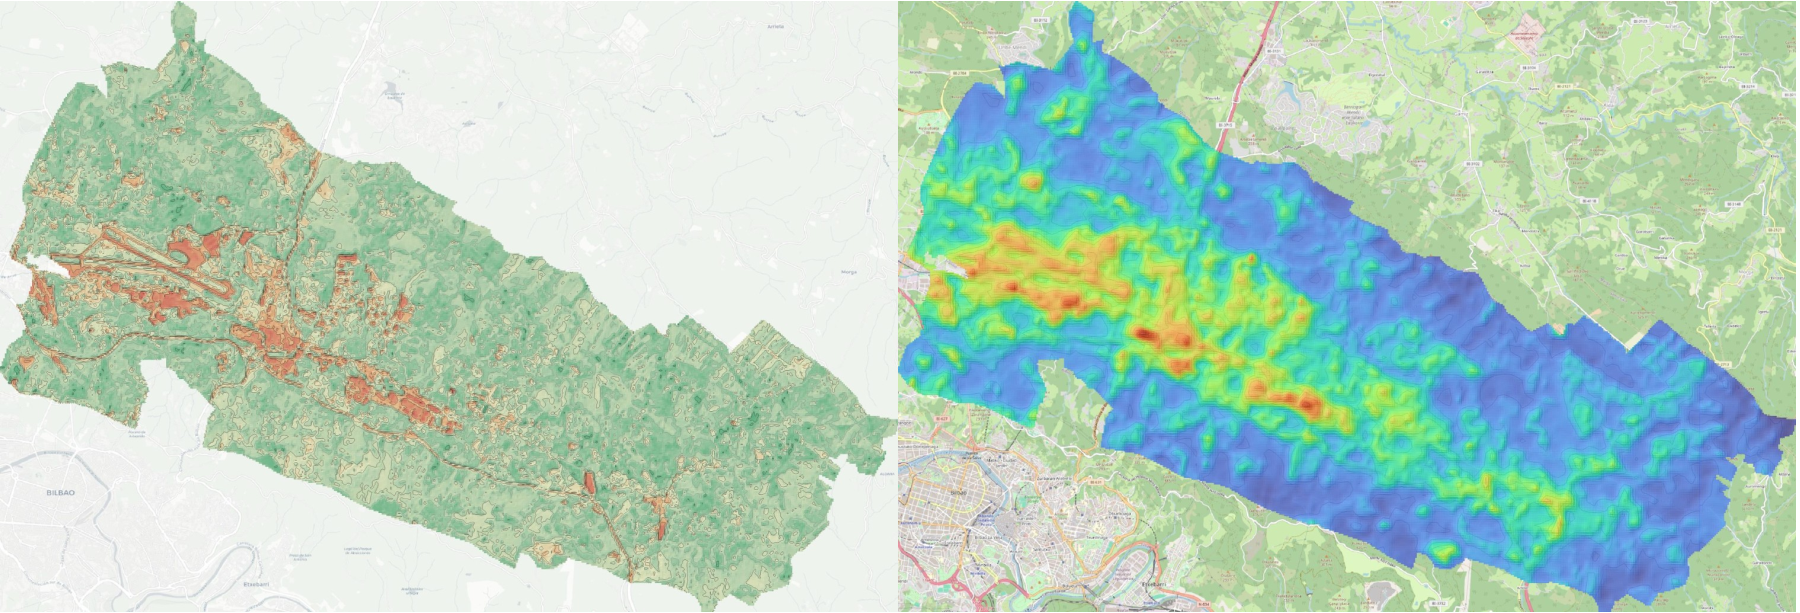
Vegetation #NDVI and Urban Heat Islands #UHI of #Txorierri obtained from a #Landsat9 image from July. Heat accumulation in industrial areas and airport is evident but what happens in #AthleticClub training fields? #RemoteSensing #rstats #GIS #Larrabetzu #Lezama #Zamudio #Derio #Loiu #Sondika
Video tutorial
Download #sentinel2 data and calculate the #NDVI in #Python using Remotior Sensus
https://www.youtube.com/watch?v=f_WJzEUHcaI
For instructions read
https://fromgistors.blogspot.com/2024/11/sentinel-2-ndvi-remotior-sensus.html
Ich weiß nicht ob das experimentell genug ist für den #FotoVorschlag heute. Die Bilder habe ich mit einem #raspberrypi mit Touch und der #pinoir Kamera gemacht (darf kein infrared-blocking filter haben). Ich hab ein Skript geschrieben das mein Pi immer das 'custom low effort Digicam Script' bootet und via Touch auslöst. Vor der Kamera war ein Blaufilter. Ist eine low budget Technik um die Pflanzengesundheit zu checken (#NDVI). Irgendwann will ich das nochmal machen
I have to share my colleague's first #PhD paper. It is a cool one!
Comparison of #greenery across 86 European cities and their active travel environments.
Residential areas are much more green than travel environments in European cities. Seasonality is often overlooked, but crucial for accurate assessments of #urban greenery.
Klein, et al. (2024) Temporal variation in travel greenery across 86 cities in Europe.
Antarctica Is Turning Green At An Alarming Rate, Satellite Images Show
--
https://www.cnn.com/2024/10/04/climate/antarctica-greening-vegetation-satellite-images/index.html <-- shared media article
--
https://doi.org/10.1038/s41561-024-01564-5 <-- shared paper
--
#GIS #spatial #mapping #remotesensing #landsat #Antarctica #anthropogenic #climatechange #greening #AntarcticPeninsula #vegetation #plant #NDVI #landscape #spatialanalysis #spatiotemporal #ice #snow #moss #landarea #temperature #extremes #extremeweather #soil #invasivespecies #native #wildlife
SNAP-Tutorials #12 - Introductory Remote Sensing
In this series of videos Shaun Levick explores #Sentinel-2 data, calculates #NDVI and classifies data using different classification methodologies, like unsupervised, supervised and supervised Random Forest.
Tutorial: https://youtube.com/playlist?list=PLf6lu3bePWHCOUjTDZRNx5N07otDM8iUq&si=7dmZa9MbMdTlR1ts
Shaun Levick: https://www.linkedin.com/in/shaun-levick-05534615/
New publication: Normalized difference #vegetation index analysis reveals increase of #biomass production and stability during the conversion from conventional to #organicfarming. #sustainablelanduse #ndvi #yieldstability
https://doi.org/10.1111/gcb.17461
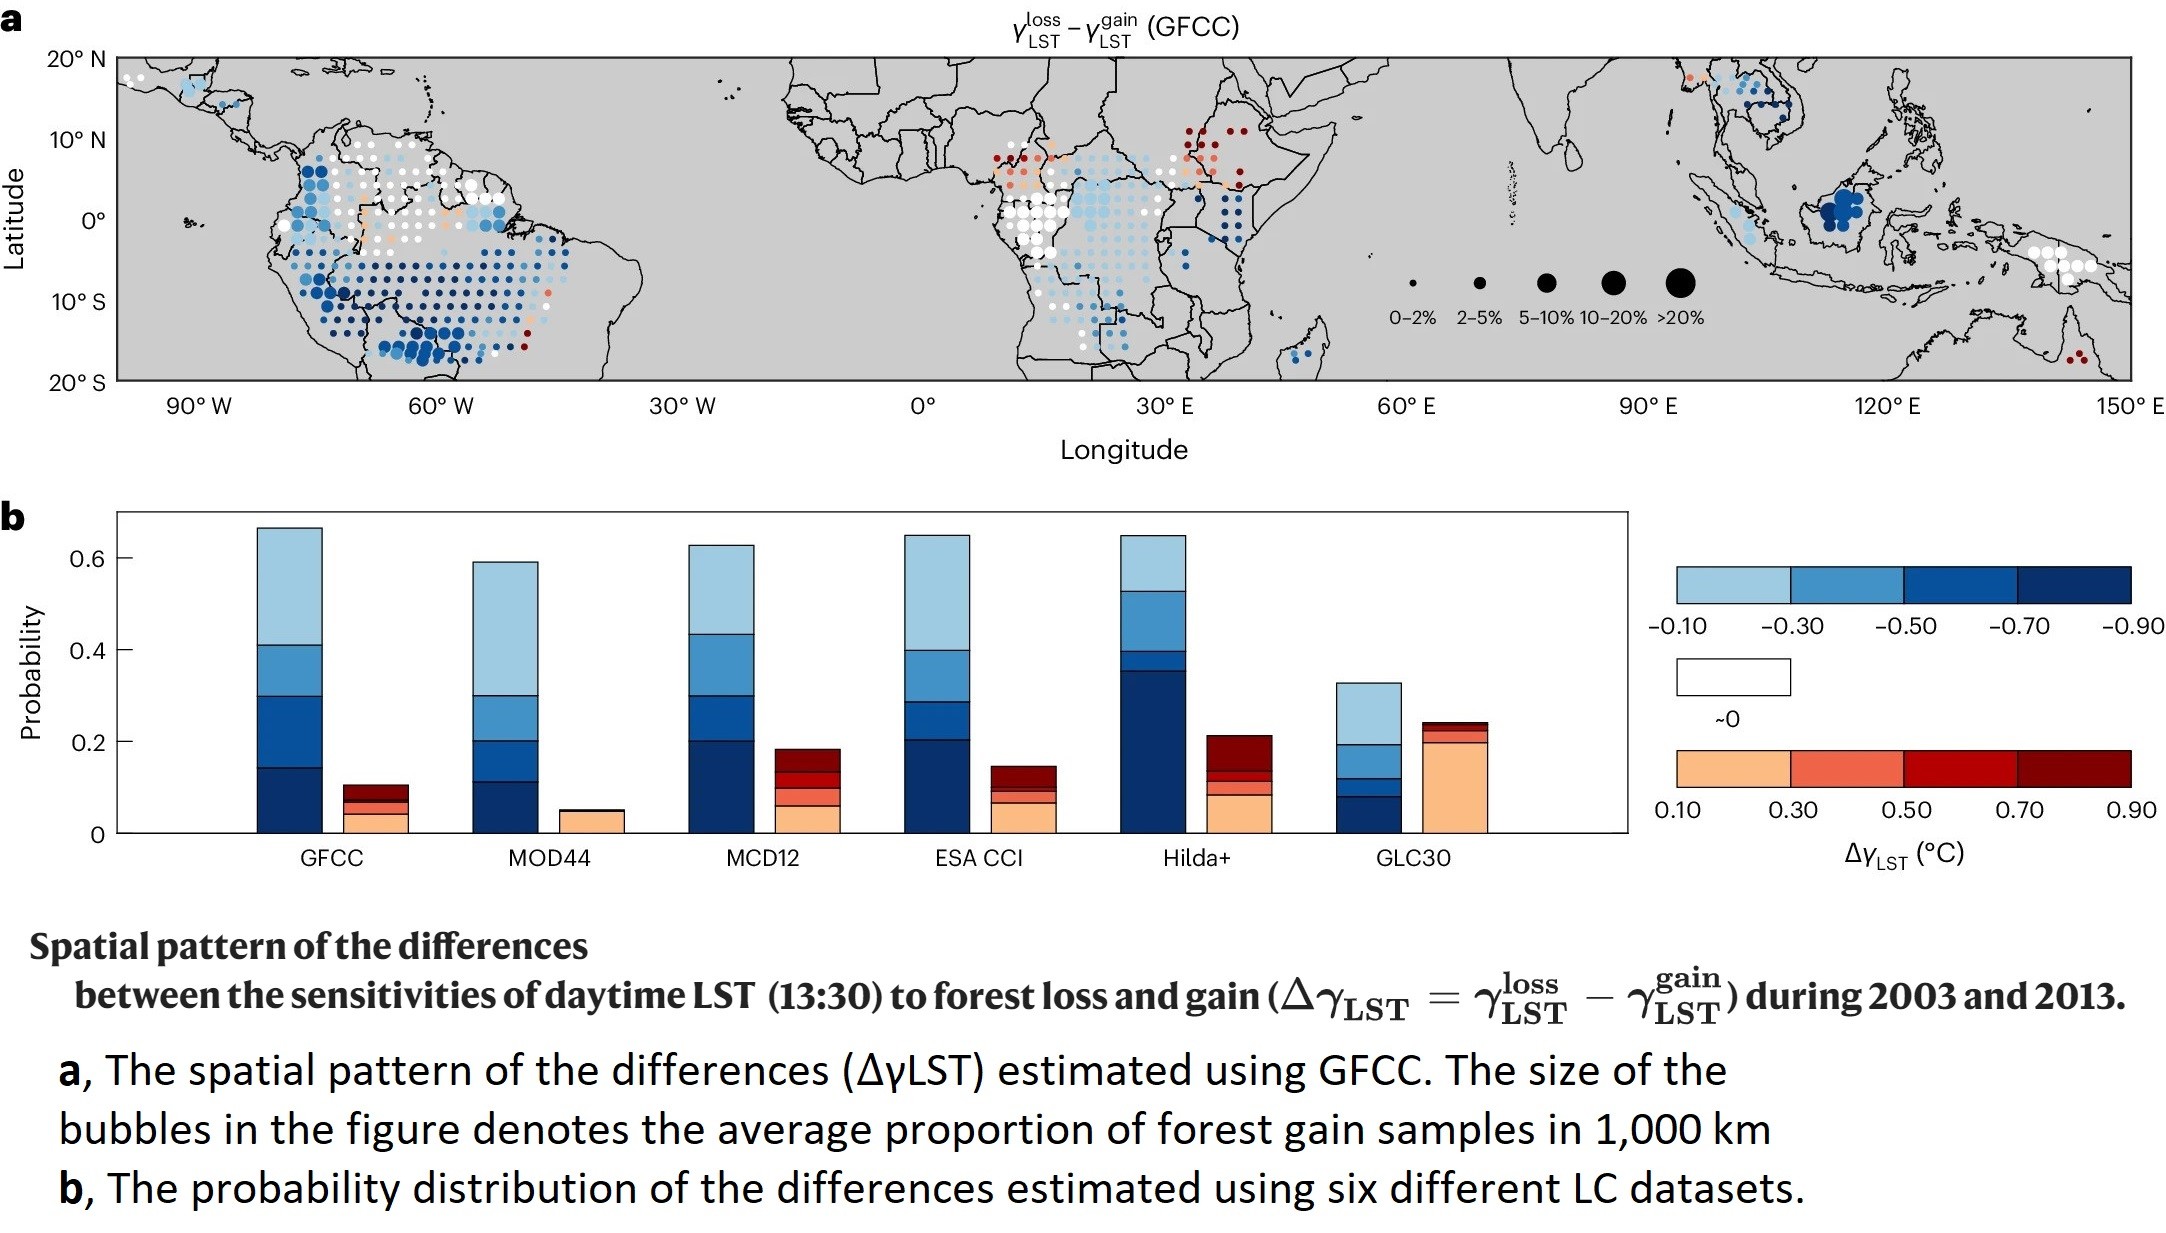
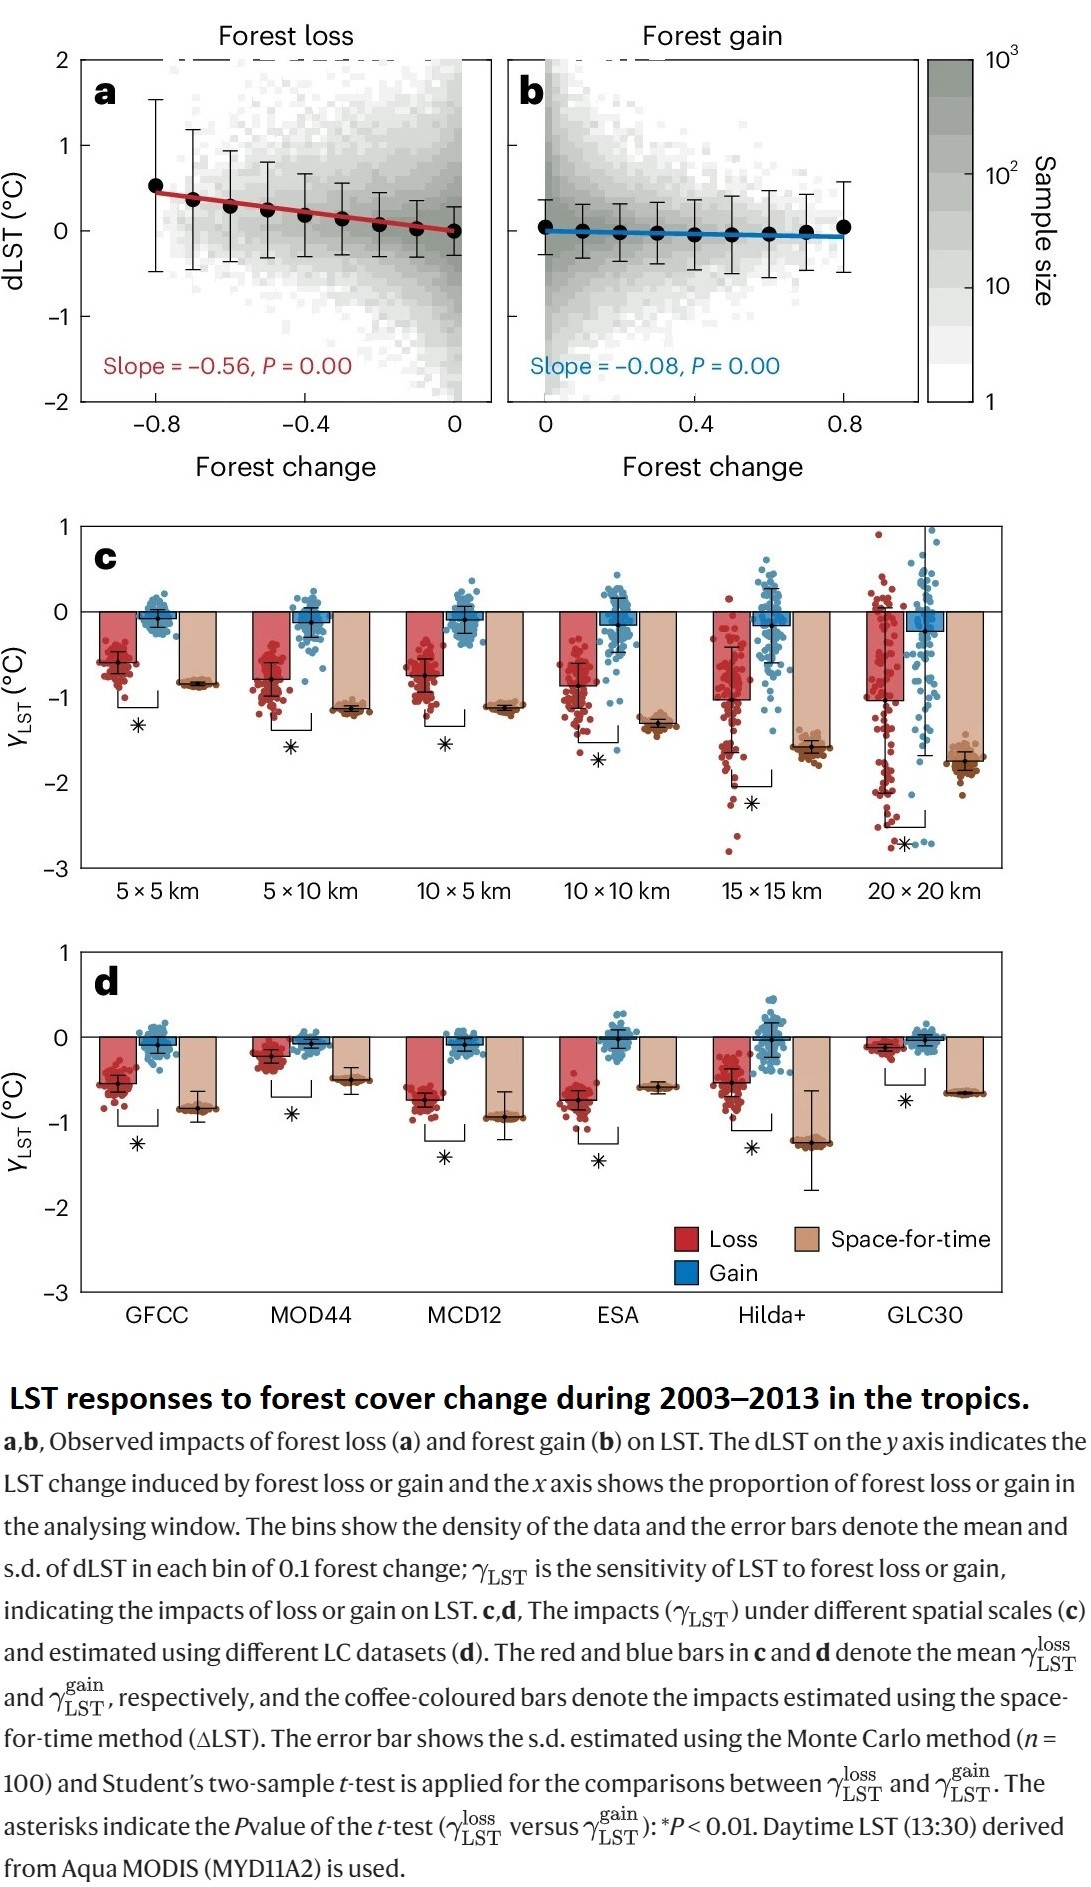
Old Forests Are Irreplaceably Cool
--
https://pubs.aip.org/physicstoday/online/43370 <-- shared technical article
--
https://doi.org/10.1038/s41561-024-01423-3 <-- shared paper
--
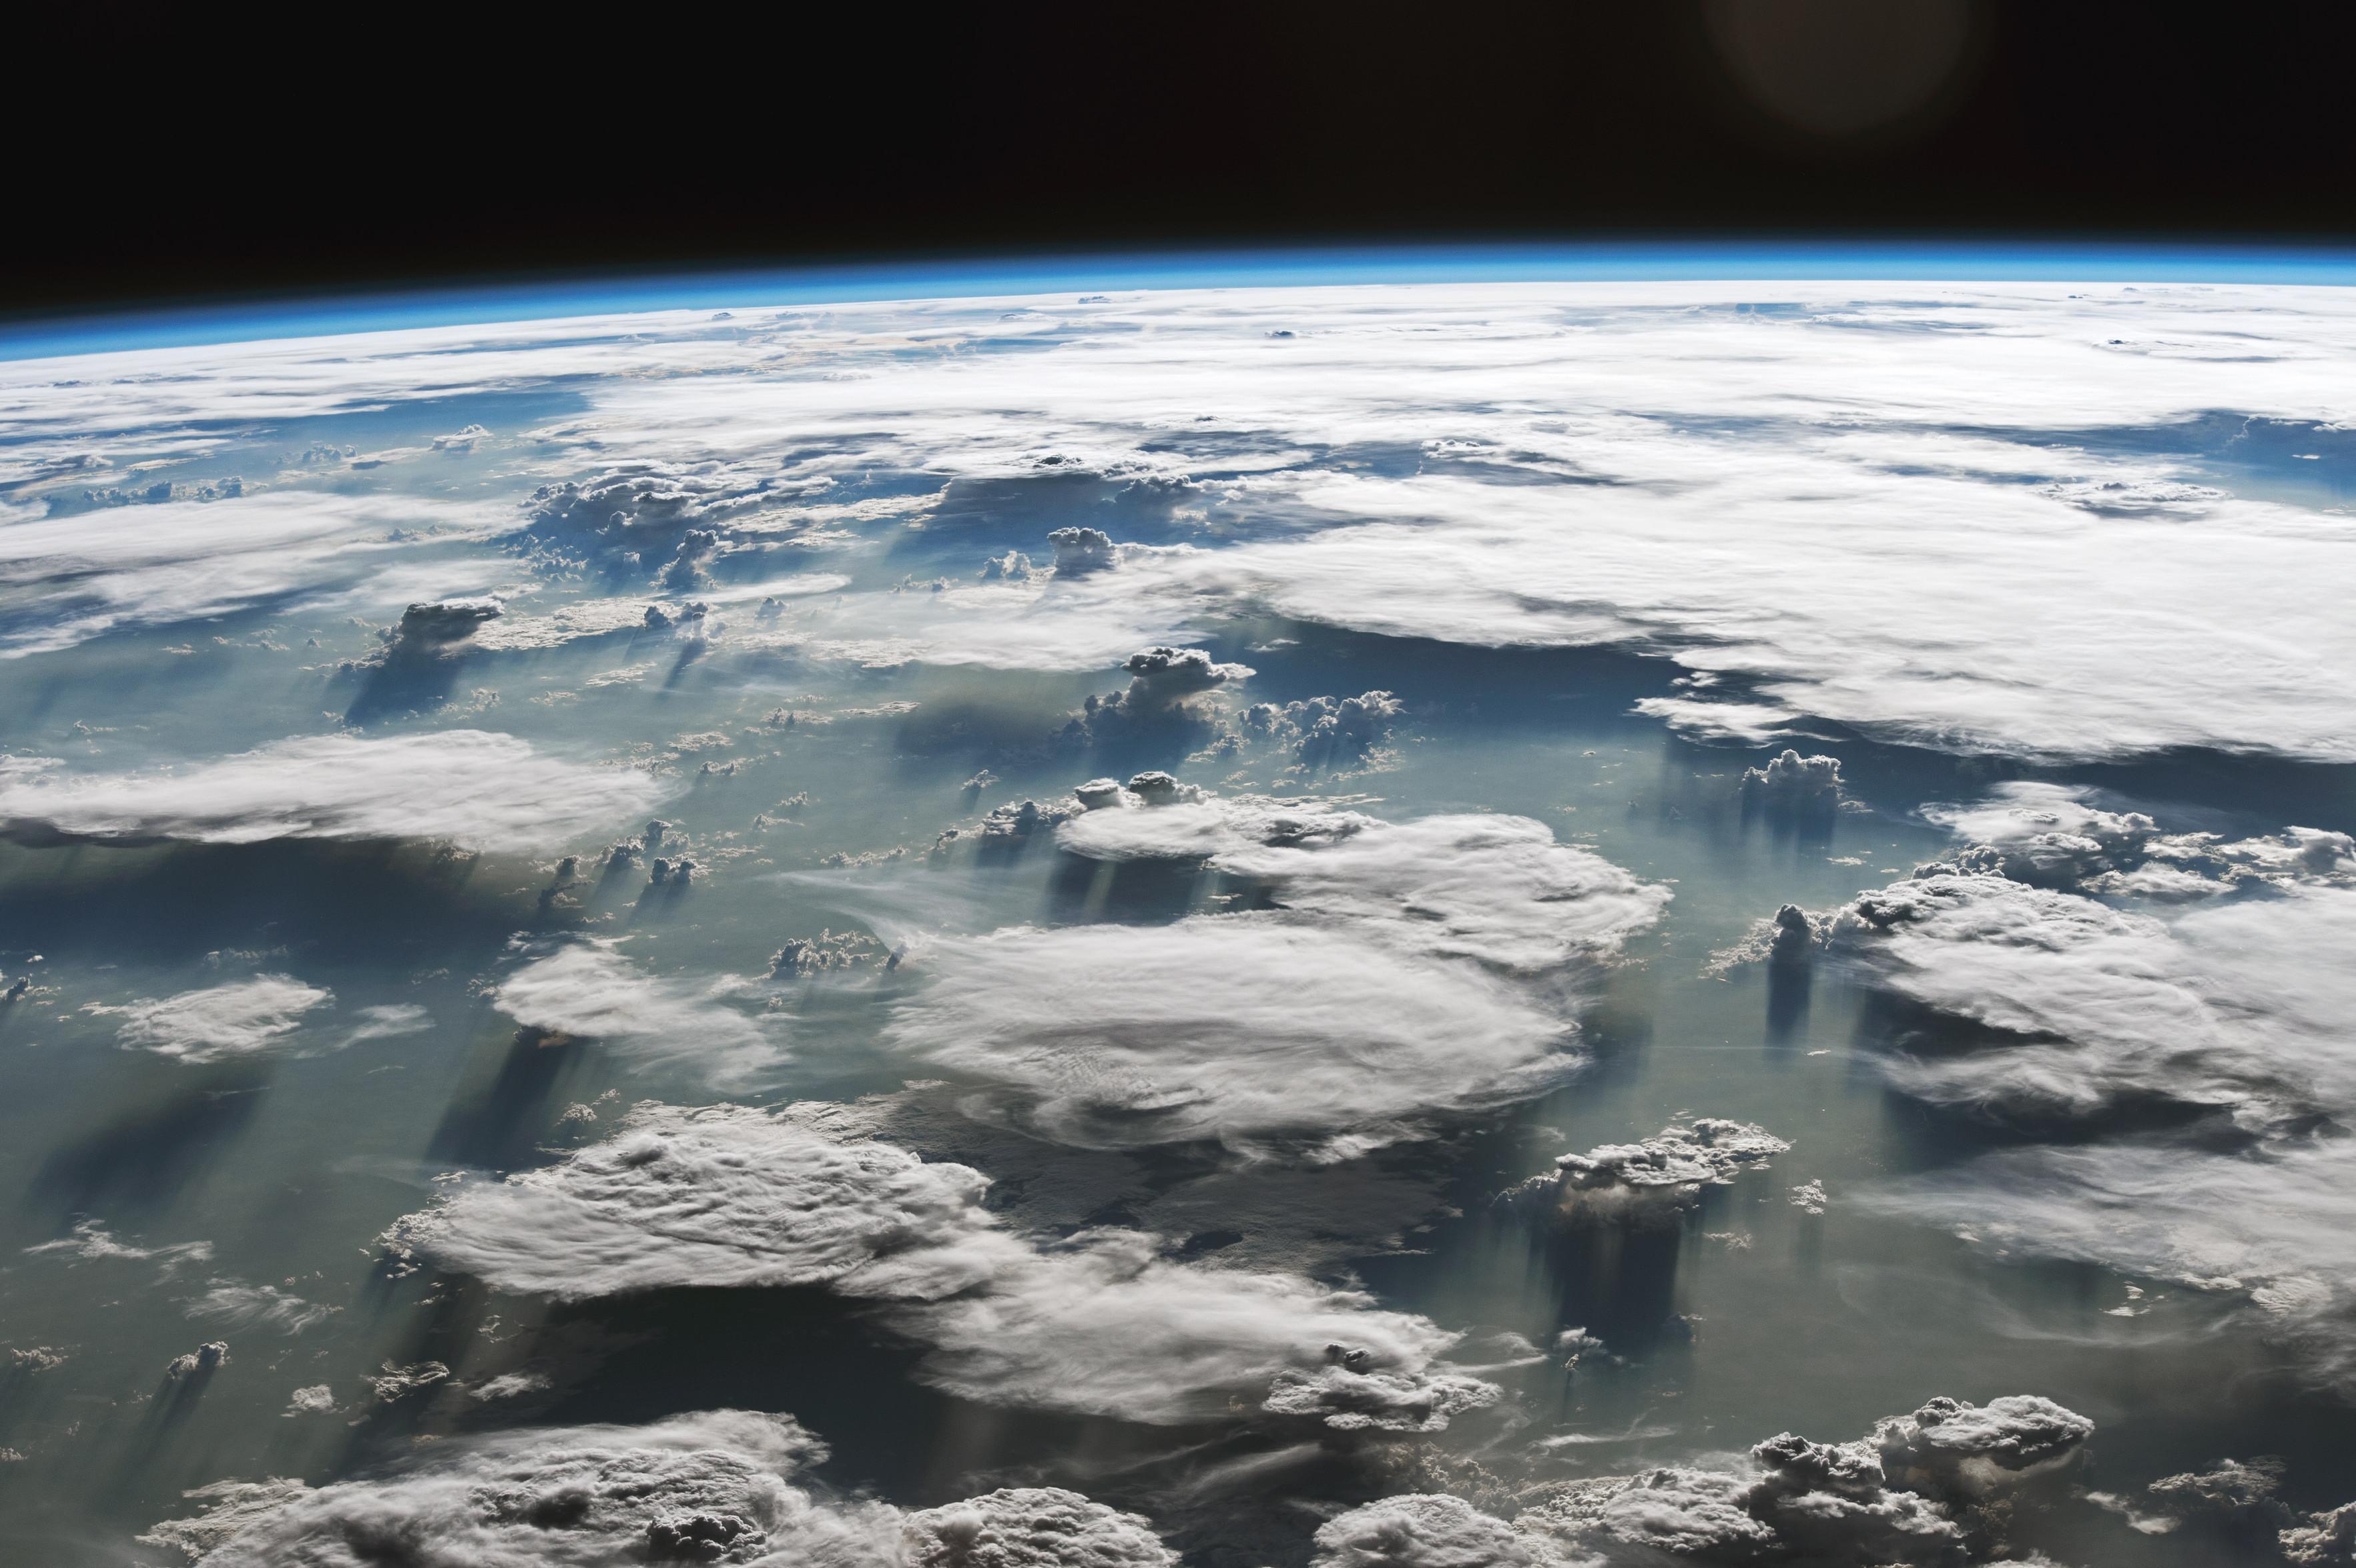
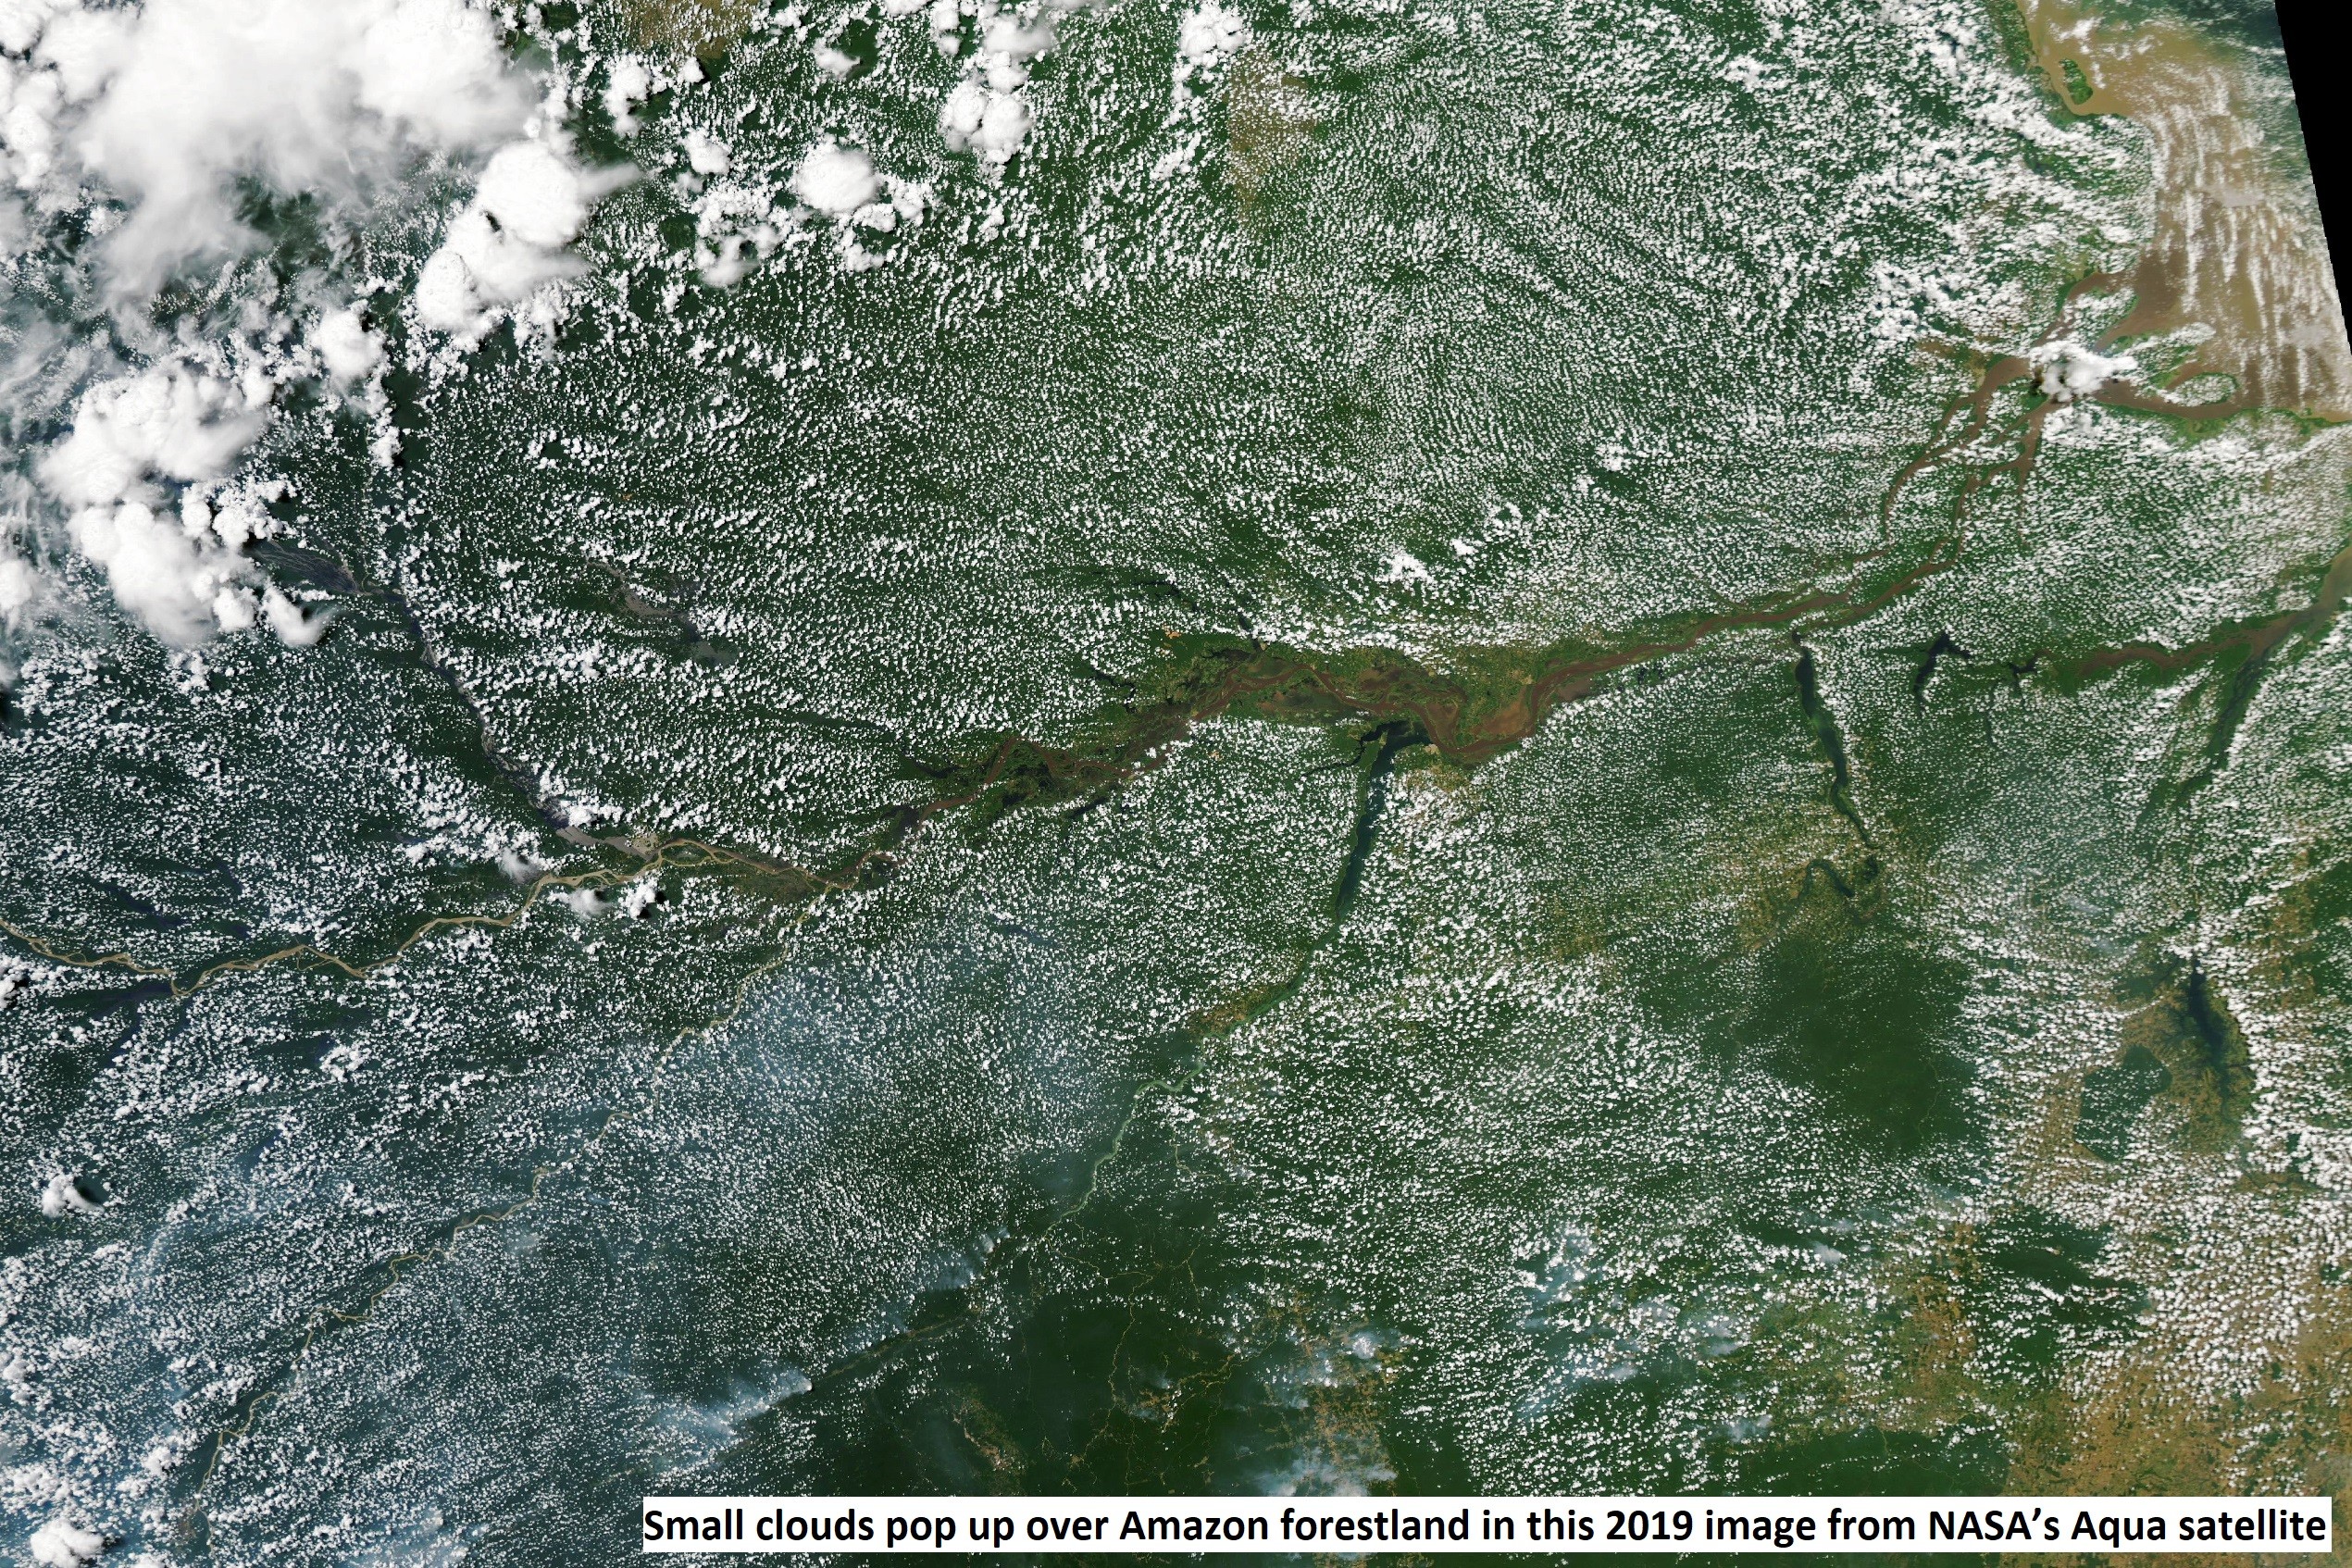
“Satellite measurements confirm that the sudden disappearance of mature tropical forests has a more drastic effect on local land temperature than does the gradual growth of young forests…”
#GIS #spatial #mapping #remotesensing #tropics #tropical #earthobservation #vegetation #forest #forests #loss #gain #differences #landsurface #local #temperatures #heat #coolingeffect #energybudget #biophysical #climatechange #spatialanalysis #spatiotemporal #leafareaindex #aldebo #canopy #structure #geomorphometry #NDVI #model #modeling #ecology #NASA #Aqua #Terra #satellite #atmosphere #circulation
Calculating NDVI In QGIS
--
https://www.northrivergeographic.com/calculating-ndvi-in-qgis/ <-- shared technical ‘how-to’
--
#GIS #spatial #mapping #remotesensing #earthobservation #forestry #forest #vegetation #QGIS #NDVI #NormalizedDifferenceVegetationIndex #tutorial #howto #education #Onlineclass #OnlineEducation #onlinelearning #NAIP #imagery #spatialanalysis
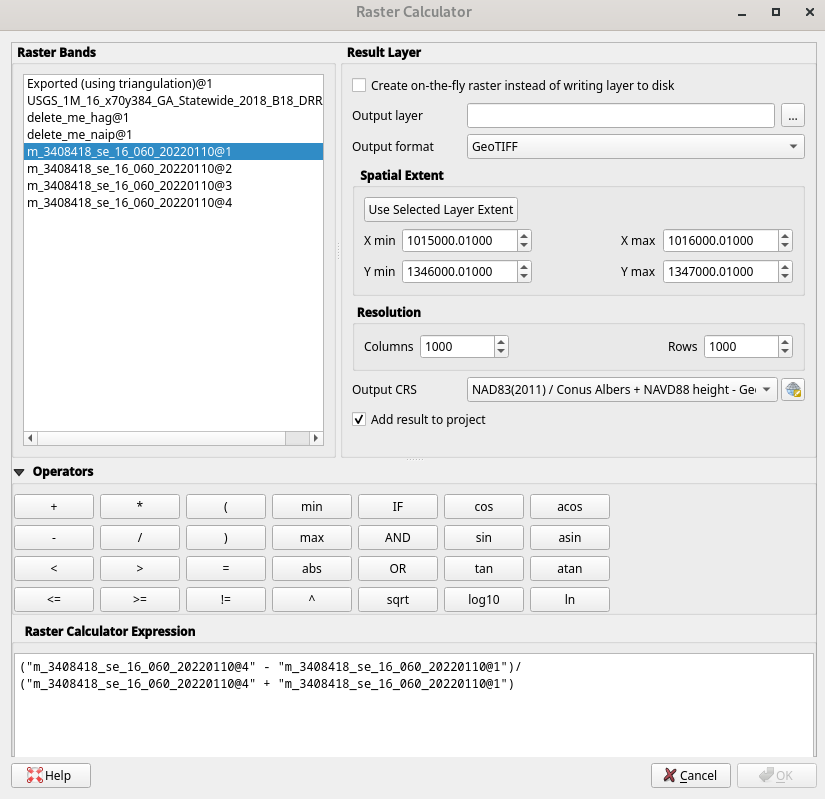
Things I don't think I've done before - NDVI - https://www.northrivergeographic.com/calculating-ndvi-in-qgis/ #qgis #ndvi #forestry
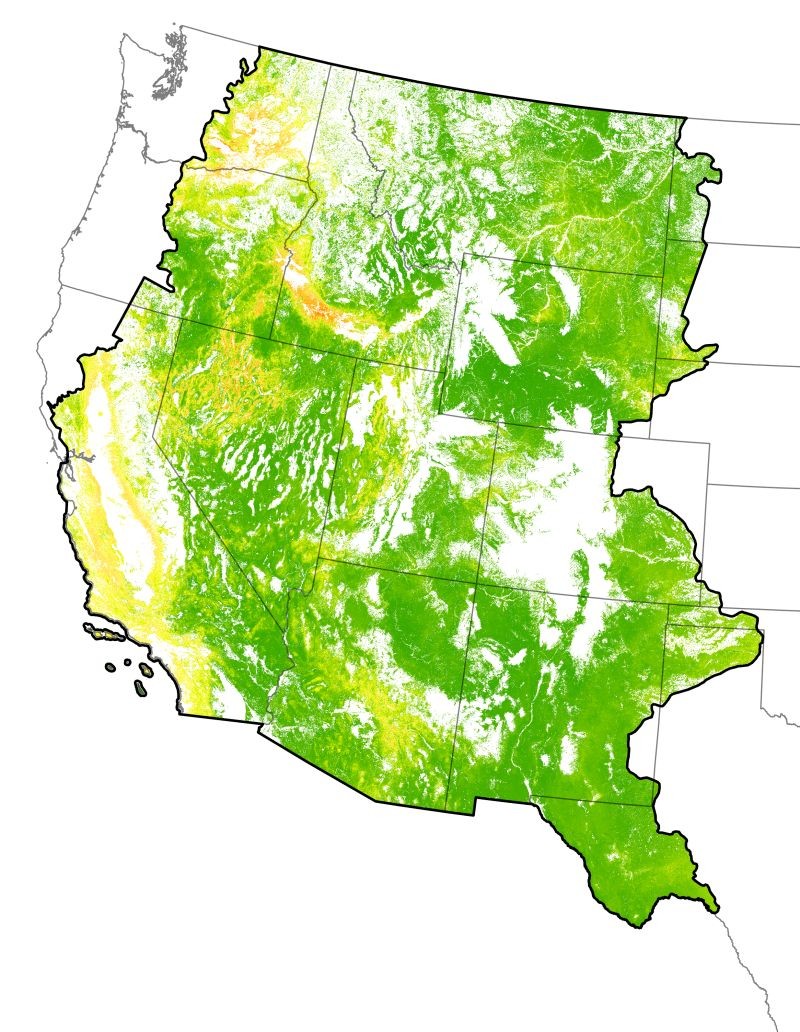
Early Estimates Of Exotic Annual Grass (EAG) In The Sagebrush Biome, USA, 2024 (ver. 1.0, April 2024)
--
https://doi.org/10.5066/P9351ZTZ <-- link to @USGS open data resource
--
#RemoteSensing #GIS #spatial #mapping #MachineLearning #Mapping #EnvironmentalResearch #earthobservation #datadownload #digitaldata #opendata #EROS #invasivespecies #exotic #grass #vegetation #spatialanalysis #EAG #AIM #AI #machinelearning #NDVI #USWest #USA #satellite #sagebrush #biome #landmanagement #planning #range #landmanagers
@USGS
RT by @CopernicusEU: ¿Quién dijo que la ciencia no es bella?
#Sentinel2 de 🇪🇺@CopernicusEU nos permite ver artísticamente el resultado de combinar valores de variación del índice de vegetación #NDVI a lo largo de varios meses. #EarthArt
Como este:
https://link.dataspace.copernicus.eu/pge
[2024-02-21 19:55 UTC]