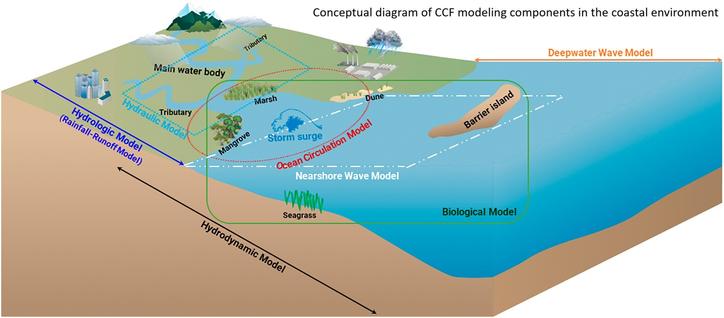
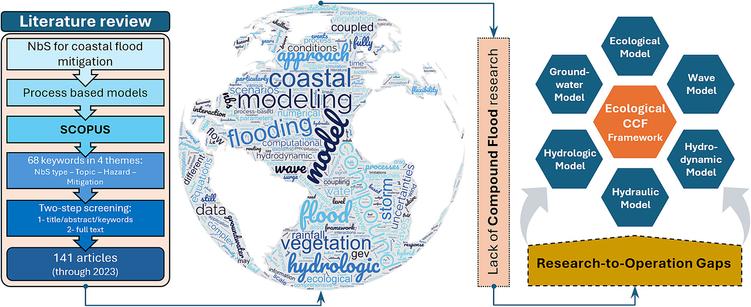
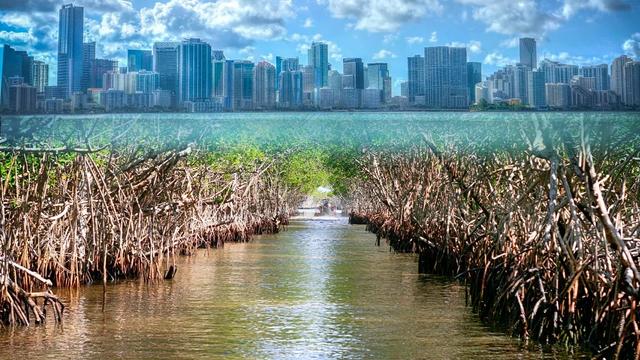
Advancing Compound Flood Modeling to Evaluate Coastal Protection Benefits of Natural Infrastructure
--
https://coastalscience.noaa.gov/news/advancing-compound-flood-modeling-to-evaluate-coastal-protection-benefits-of-natural-infrastructure/ <-- shared technical article
--
https://doi.org/10.1016/j.scitotenv.2024.173529 <-- shared paper
--
#flood #flooding #literaturesearch #compilation #coast #coastal #coastalengineering #mitigation #planning #management #framework #model #modeling #infrastructure #natural #barrier #rainfall #precipitation #climatechange #river #discharge #stormsurge #sealevel #seallevelrise #waves #tides #compoundflooding #humanimpacts #communities #publicsafety #cost #loss #economics #fedscience #fedservice #hydrology #water #marine #ocean #hydraulic #hydrodynamic #biology #ecosystems #vegetation #sedimentation #erosion #GIS #spatial #mapping #spatialanalysis #regional #local #forecasting #preparation #enduser #usecase #publicwarnings #marsh #sawmp #mangrove
@NOAA | @NOAA Ocean | @NOAA Centers for Coastal Ocean Science
#Sedimentation
Ja, die #Sedimentation (ein schöner Begriff aus der #Wissenssoziologie, finde ich!) findet v.a. über #Begriffsarbeit statt. Im Buch #Verschwörungsmythen (besserer Begriff 1) findet sich auch eine ausführliche Diskussion von egozentrischem #Relativismus, gruppenbezogenem #Dualismus und schließlich dialogischem #Monismus. Bessere Begriffe brauchen oft länger, um sich gegen alte Konzepte durchzusetzen. Aber das ist die Aufgabe, die ich mir stellte. #Wissenschaft https://shop.verlagsgruppe-patmos.de/verschwoerungsmythen-011573.html
Dams Fill Reservoirs With Sediment
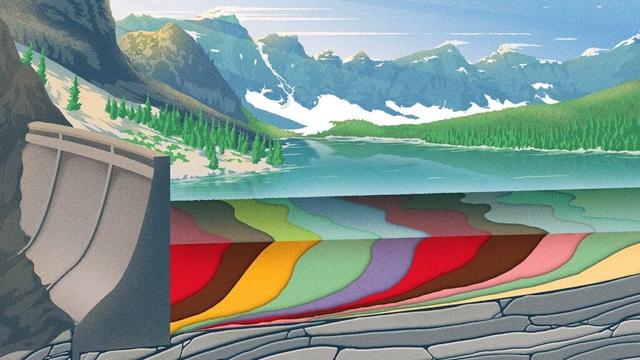
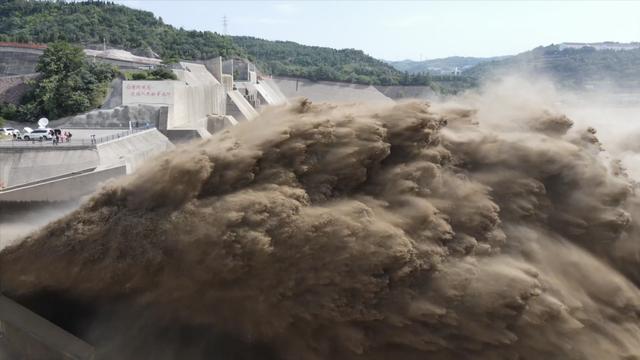
Dams are critical pieces of infrastructure, but, as Grady shows in this Practical Engineering video, they are destined to be temporary. The reason is that they naturally fill with sediment over time. Rivers carry a combination of water and sediment; the latter is critical to healthy shorelines and stable ecology. But while sediment gets carried along by a fast-flowing river, slower flow rates allow sediment to fall out of suspension, as demonstrated in Grady’s tabletop flume. As his river transitions to a deeper, slower-flowing reservoir, sand falls out of the flow, building up colorful strata. The sand and water even create dynamic feedback loops, as seen with the dunes that form in his timelapse and march toward the dam.
Any long-term plan for a dam has to deal with this inevitable build-up of sediment, and, unfortunately, it’s not a simple or cheap problem to address, as discussed in the video. (Video and image credit: Practical Engineering)
#civilEngineering #dams #engineering #fluidDynamics #physics #science #sedimentTransport #sedimentation
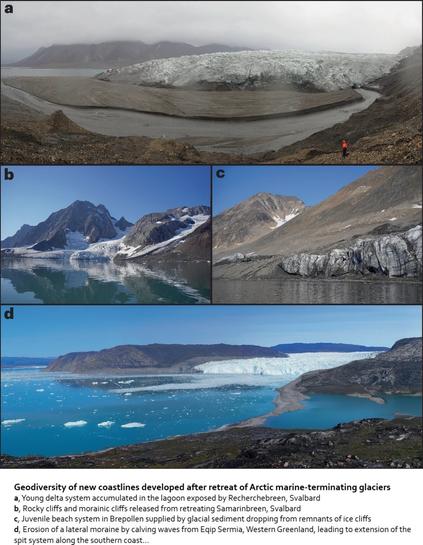
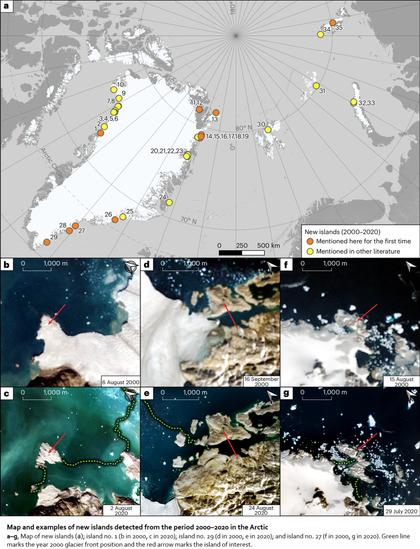
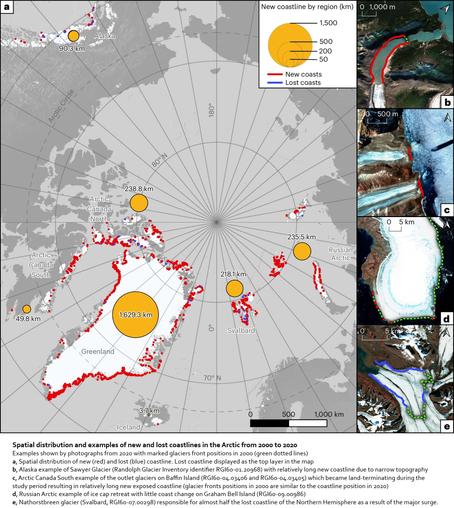
New Coasts Emerging From The Retreat Of Northern Hemisphere Marine-Terminating Glaciers In The Twenty-First Century
--
https://doi.org/10.1038/s41558-025-02282-5 <-- shared paper
--
#GIS #spatial #mapping #geography #climatechange #glaciers #glacial #melting #retreating #ctyosphere #spatialanalysis #spatiotemporal #deglaciation #coast #coastal #geomorphology # geomorphometry #proglacial #coastline #geology #NorthernHemisphere #Greenland #paraglacial #sediment #sedimentation #dynamic #retreating #ecosystems #Arctic #islands #new #climate #rock #permafrost #geodiversity #delta #moraine #beach #juvenile #snow #ice #calving
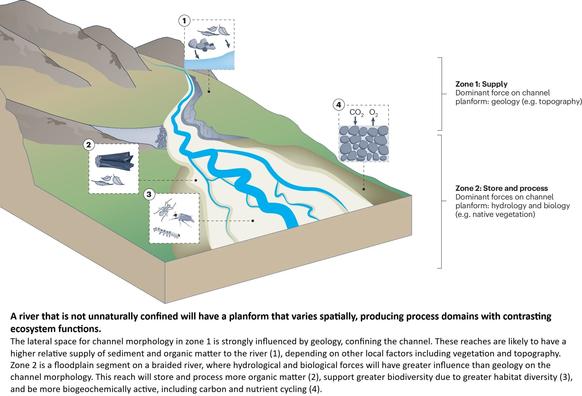
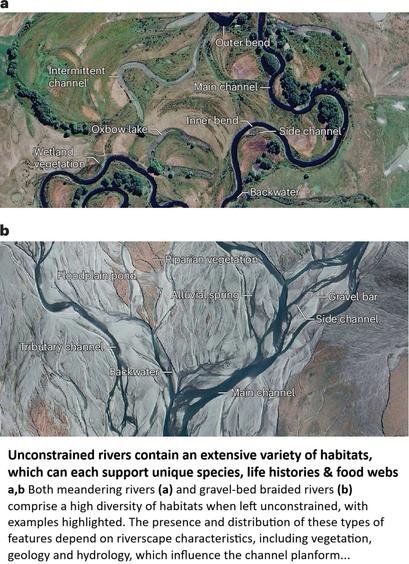
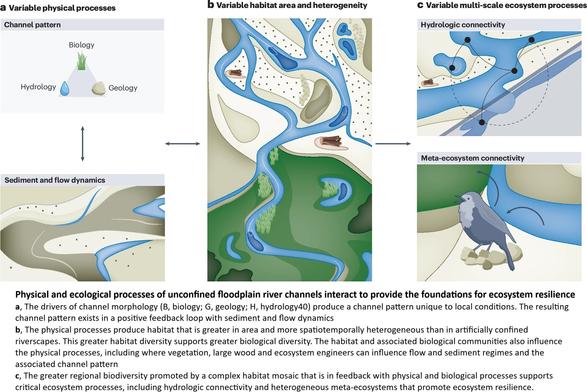
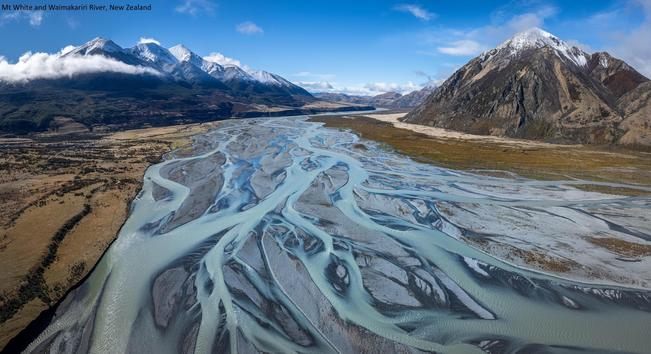
The Ecological Benefits Of More Room For Rivers
--
https://doi.org/10.1038/s44221-025-00403-0 <-- shared technical article
--
#spatial #spatiotemporal #morphology #meander #levee #understanding #oxbow #pointbar #river #water #hydrology #landform #geomorphology #geomorphometry #geology #fluvial #riverine #weather #climate #erosion #sediment #sedimentation #DEM #floodplain #terraces #ecsosystems #ecology #sustainable #climatechange #flood #floodrisk #risk #hazard #management #planning #monitoring #migration #engineering #unconfined #rive #channel #metaecosystem #connections #biodiversity #extremeweather
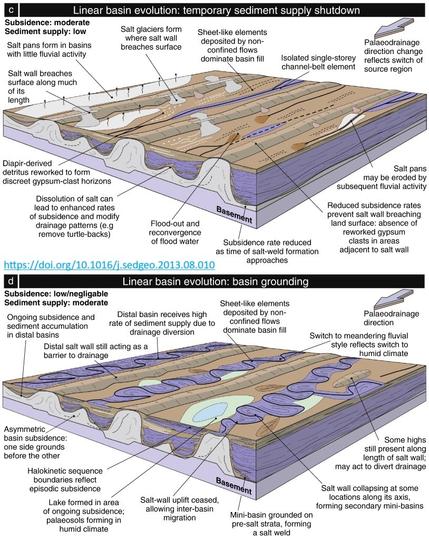
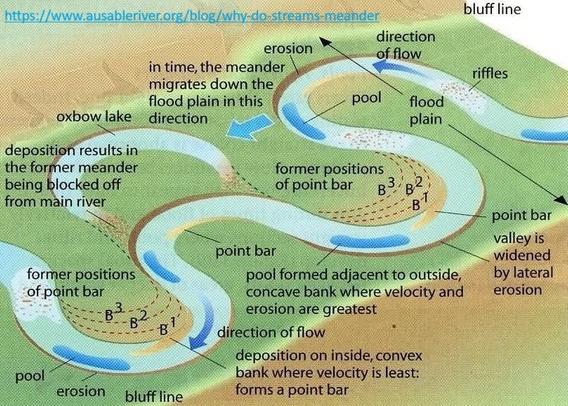
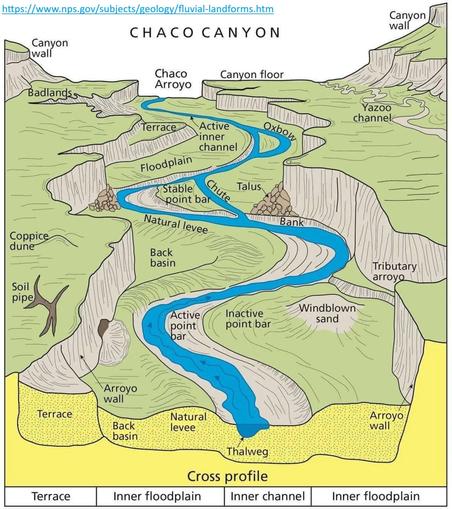
Fluvial System Block Diagrams
--
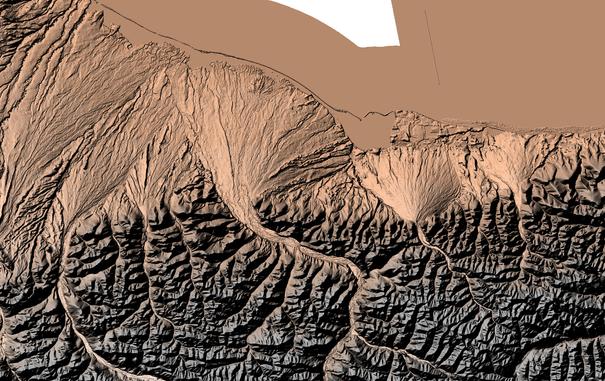
I was looking to understand a fluvial system the other day, up in the high Arctic, as I looked at 3DEP remote sensed elevation data… I have always been fascinated by the how geology, water, weather shapes a landscape, including erosion (aka geomorphology if you will) – and realized how very much value fluvial block diagrams have as we try to conceptualise what has, is and will happen(ed.)
#spatial #spatiotemporal #morphology #meander #levee #understanding #oxbow #pointbar #river #water #hydrology #landform #geomorphology #geomorphometry #geology #fluvial #riverine #weather #climate #erosion #sediment #sedimentation #Arctic #3dep #opendata #DEM #BeringSea #northslope #opendata #fedservice
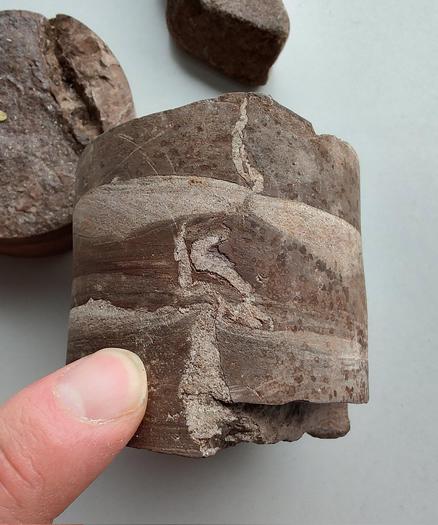
Today #GeologyWithCats! We found this #drillcore it's a #sandstone. The white layers had large pores with #water in it. When #sediment was accumulated the pressure was growing & finally the water was squeezed out upwards-its a water escape structure.
Humans #PawForScale
#geology #rocks #sedimentation #sedimentology
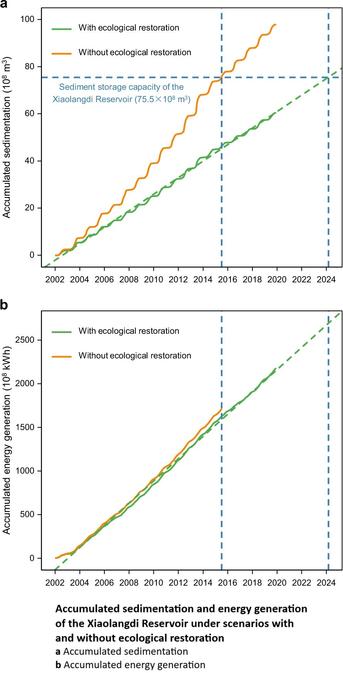
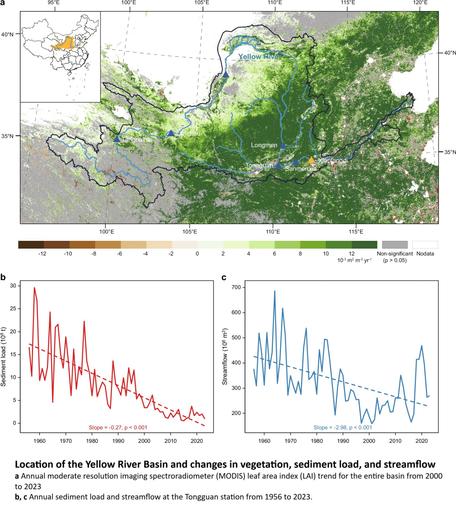
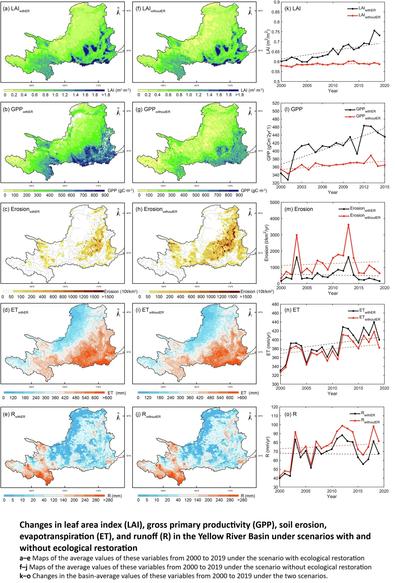
Ecological Restoration In The Yellow River Basin Enhances Hydropower Potential
--
https://doi.org/10.1038/s41467-025-57891-7 <-- shared paper
--
#GIS #spatial #mapping #spatiotemporal #spatialanalysis #HEP #hydropower #China #ecology #restoration #YellowRiver #YellowRiverBasin #dam #dams #ecological #renewables #power #energy #generation #restoration #sedimentation #sediment #reservoir #hydroelectricpower #Xiaolangdi #waterresources #water #hydrology #socioeconomic #watershed #management
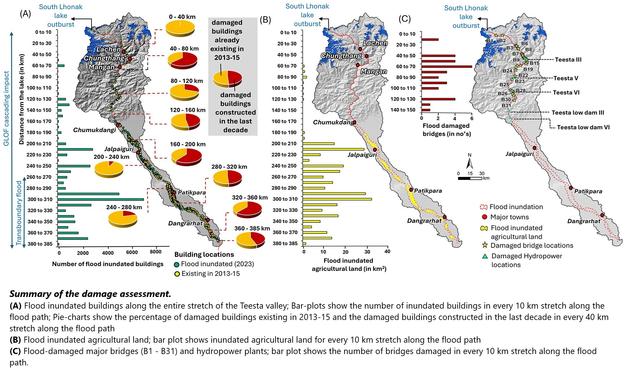
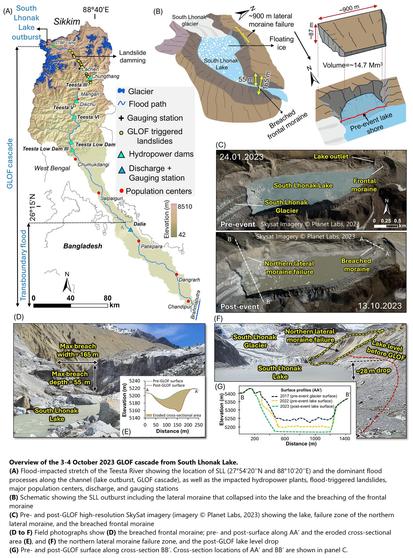
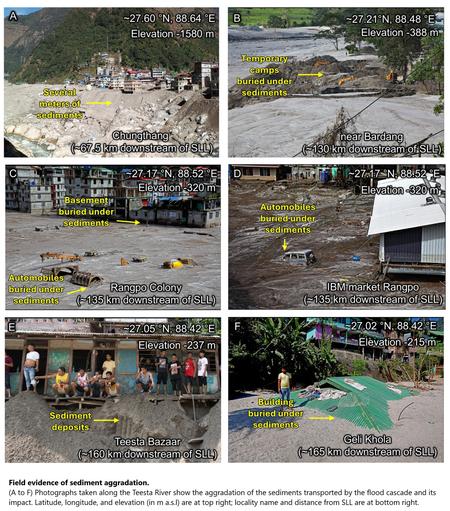
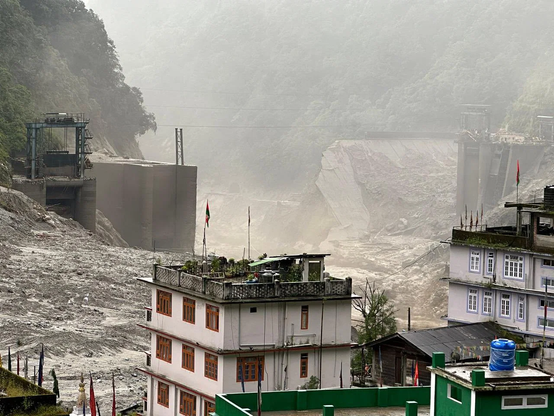
Study Warns Of Glacial Outburst [GLOF] Risks From Hydropower Projects In The Himalayas, Caution Comes After Nod To Resume Testa III [Hydroelectric Project, India]
--
https://timesofindia.indiatimes.com/india/study-warns-of-glacial-outburst-risks-from-hydropower-projects-in-himalayas-caution-comes-after-nod-to-resume-teesta-iii/articleshow/117753719.cms <-- shared media article
--
https://doi.org/10.1126/science.ads2659 <-- shared paper
--
#GIS #spatial #mapping #spatialanalysis #GLOF #Sikkim #Himalayas #India #climatechange #flood #flooding #risk #hazard #hydroelectric #HEP #energy #TestaIII #testa #dam #failure #engineeringgeology #engineering #construction #multihazard #melting #glacier #glacial #climatechange #weather #lowpressuresystem #planning #glaciallakes #lakes #water #hydrology #naturaldisaster #Lhonak #downstream #elevation #steepness #slope #geometry #infrastructure #publicsafety #lateral #moraine #sedimentation #cost #economics #remotesensing #model #modeling #imagery #outburstflood #overtopping #hydropower #vulnerable #humanimpact #policy #riskmanagement #warning #rainfall #precipitation
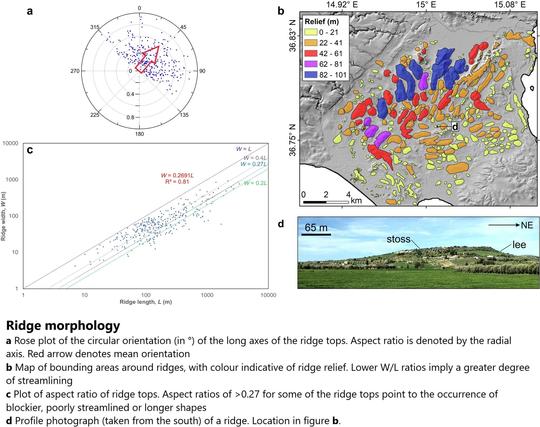
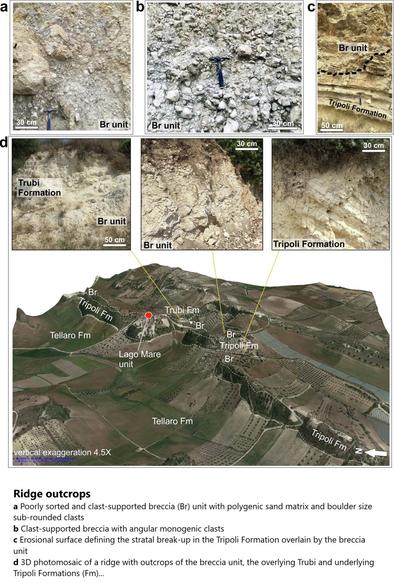
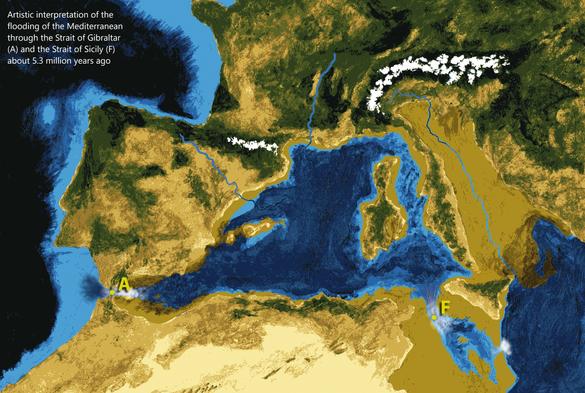
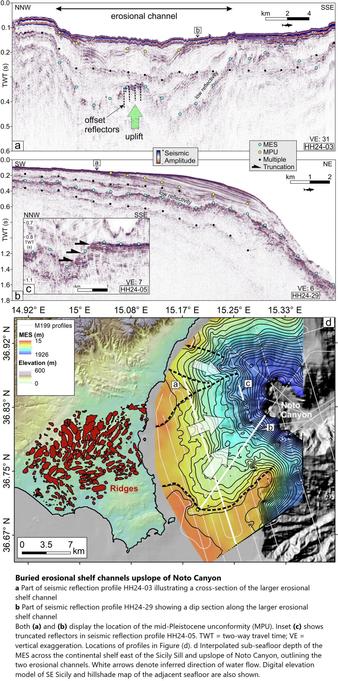
Scientists Uncover Evidence Of A Colossal MegaFlood That Refilled The Mediterranean Sea
--
https://scitechdaily.com/scientists-uncover-evidence-of-a-colossal-megaflood-that-refilled-the-mediterranean-sea/ <-- shared technical article
--
https://doi.org/10.1038/s43247-024-01972-w <-- shared paper
--
#GIS #spatial #mapping #remotesensing #Zanclean #megaflood #flood #flooding #Mediterranean #MediterraneanSea #MessinianSalinityCrisis #italy #sicily #spatialanalysis #erosion #geology #engineeringgeology #naturaldisaster #sedimentation #deposition #ridge #morphology #geomorphology #geomorphometry #spatialanalysis #model #deposits #breccia #sediment #softsediment #geologichistory #seismology #geophysics #seismics #geophysical #pleistocene #hydrodynamic #model #water #hydrology
New publication: Land use, #hydroclimate and #damming influence organic carbon #sedimentation in a flood pulse #wetland, Malaysia. #carboncycling #palaeolimnology #tropicallakes
https://doi.org/10.1002/jqs.3672
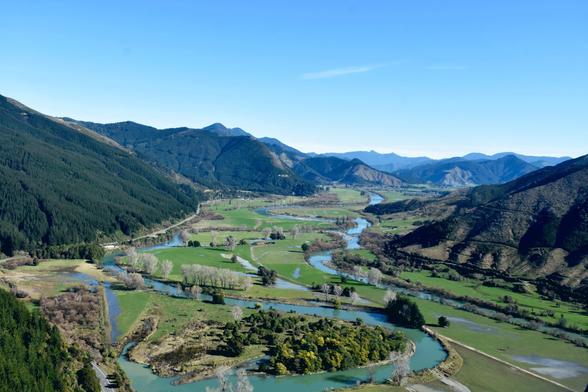
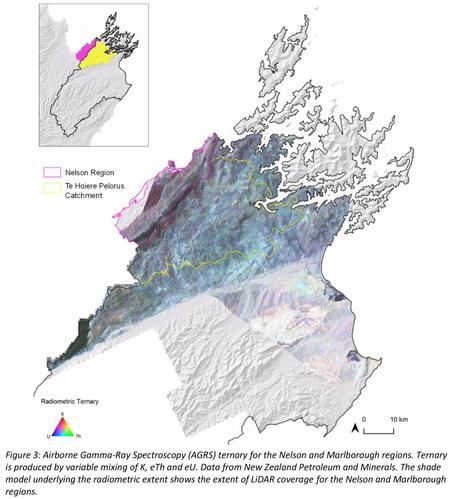
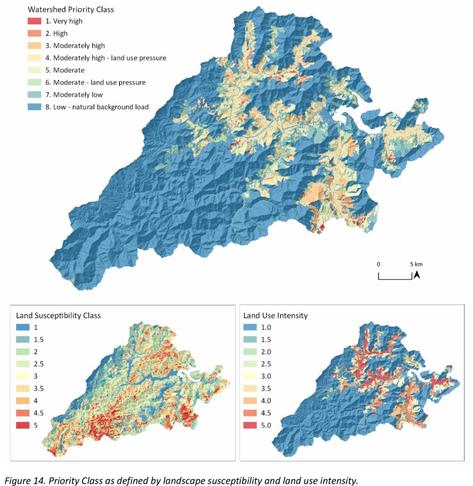
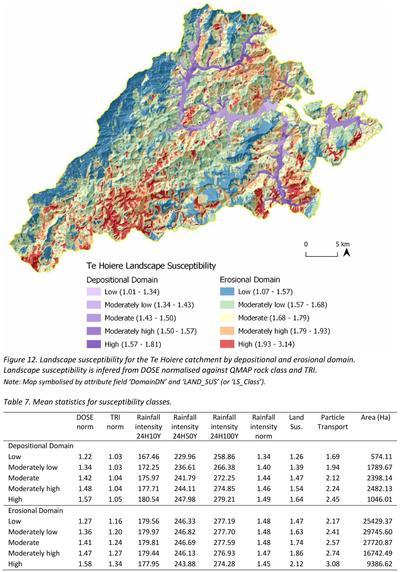
(Radiometric-Derived) Sediment Susceptibility For The Te Hoiere Pelorus Catchment [New Zealand]
--
http://alturl.com/hxbvg <-- shared technical report
--
http://alturl.com/xkgsv <-- shared related technical article
--
[reminded so much of the engineering geology work I did in my thesis in New Zealand]
#GIS #spatial #mapping #remotesensing #AGRS #gammaray #spectroscopy #engineeringgeology #risk #hazard #massmovement #landslide #rainfall #precipitation #watershed #TeHoiere #Pelorus #Catchment #NewZealand #waterquality #waterresources #water #hydrology #geology #soil #regolith #topography #slope #aspect #spatialanalysis #landuse #humanimpacts #masswasting #erosion #sediment #sedimentation #radiometrics #LiDAR #spatialtools
@TeHoiere
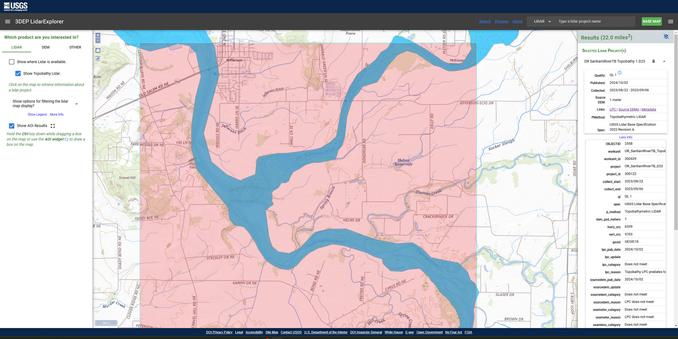
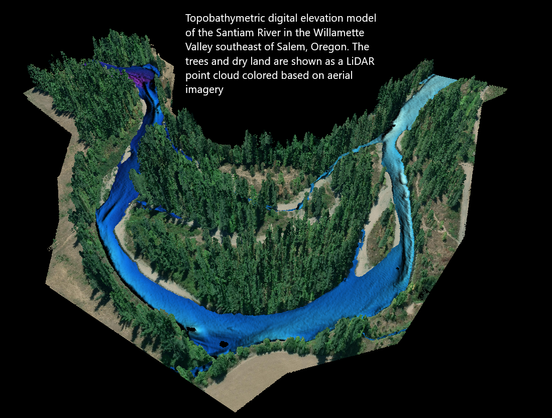
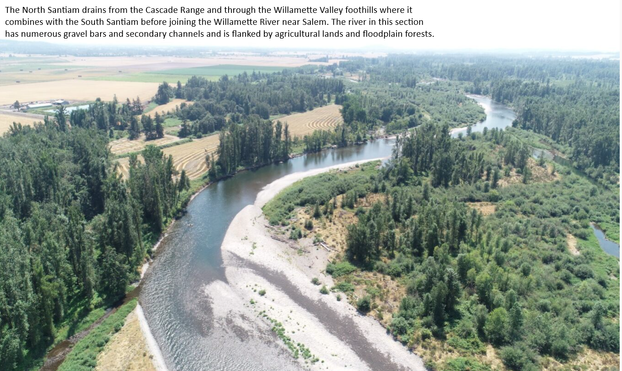
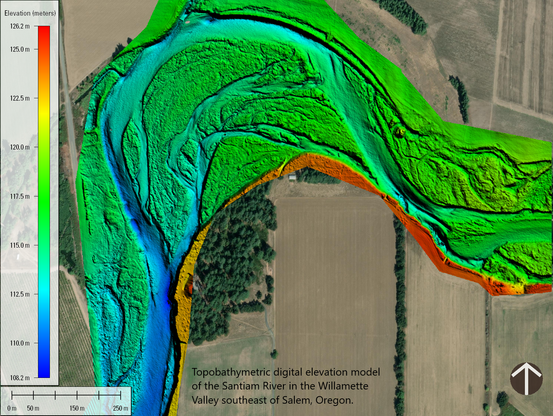
New USGS Dataset Uncovers The Santiam River’s Underwater Topography To Aid In Fish Habitat And Water Flow Management
--
https://www.usgs.gov/news/national-news-release/new-usgs-dataset-uncovers-santiam-rivers-underwater-topography-aid-fish <-- shared article
--
https://apps.nationalmap.gov/lidar-explorer/#/ <-- USGS 3DEP LiDAR Explorer (open data)
--
#GIS #spatial #mapping #remotesensing #LiDAR #topobathymetry #topobathy #example #usecase #wildfires #rivermanagement #climatechange #waterresources #SantiamRiver #Oregon #KlamathRiver #PotomacRiver #ColoradoRiver #USGS #USACE #3DEP #opendata #topography #elevation #3DTNM #water #hydrology #hydrospatial #pilotproject #prototype #infrastructure #navigation #engineering #riverbed #sediment #sedimentation #habitat #river #waterbody #flowmanagement #dams #salmon #steelhead #fish #WillametteValley #flood #flooding #risk #hazard #model #modeling #FIM #watersupply #agriculture
@USGS @USACE
Growing Downstream
This astronaut photo shows Madagascar’s largest estuary, as of 2024. On the right side, the Betsiboka River flows northwest (right to left, in the image). Less than 100 years ago, most of the estuary was navigable by ships, but now more than half of it is taken up by the river delta. Upstream on the river, extensive logging and expansions to farmland have caused severe soil erosion; the river carries that sediment downstream, dyeing the waters reddish-orange. As the river branches and the flow slows, that sediment falls out of suspension, building up islands and seeding new sand bars further downstream.
A difference of 40 years. A 2024 astronaut photo of the Betsiboka River delta compared with one from 1984 (inset). Several islands are labeled in both images. Notice how new islands have formed upstream of the ones seen in 1984.In the image above, you can compare the 2024 delta to the way it looked in 1984. Letters A, B, C, and D mark the downstream-most islands from 1984. Today newer islands and sand bars sit even further downstream. (Image credit: NASA; via NASA Earth Observatory)
#astronaut #erosion #flowVisualization #fluidDynamics #physics #riverDeltas #rivers #science #sedimentTransport #sedimentation
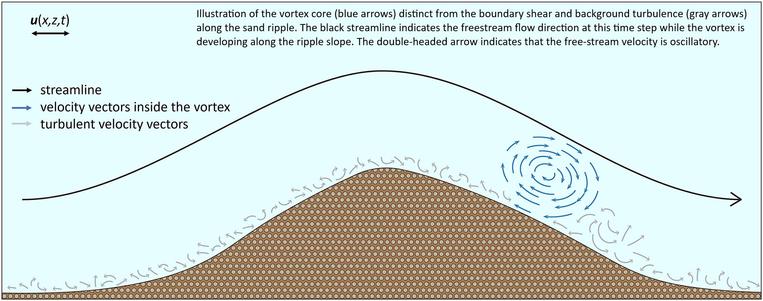
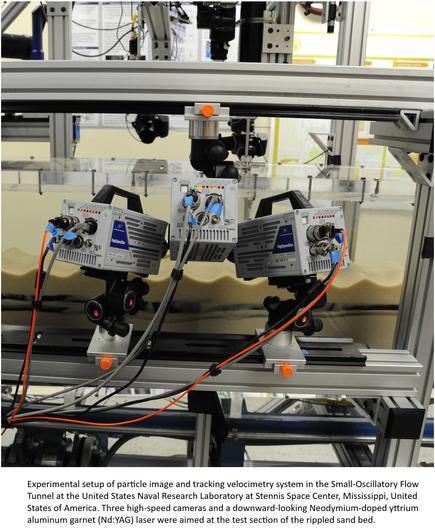
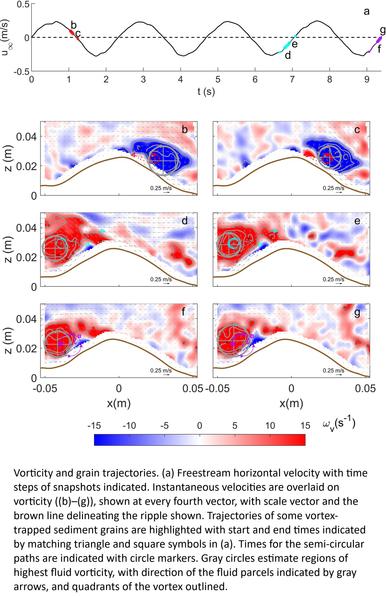
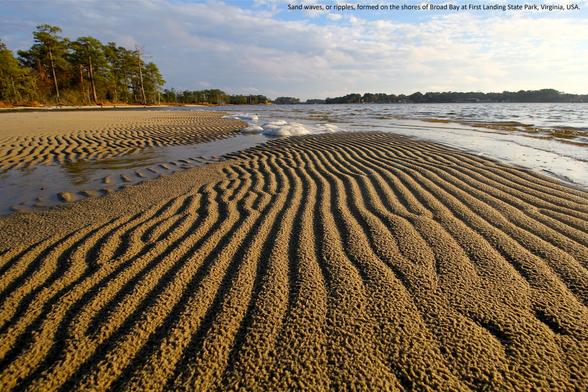
Vortex Trapping Of Suspended Sand Grains Over Ripples
--
https://doi.org/10.1029/2023JF007620 <-- shared paper
--
“KEY POINTS
• Observations of vortex-trapped grains suggest delayed settling of advected grains, as well as delayed advection of grains mobilized from the bed
• Quantitative comparisons of vortex-trapped sand grains compared well with theoretical formulations by Nielsen (1992, https://doi.org/10.1142/1269) for a forced vortex
• Improved understanding of vortex trapping effects on sediment dynamics may decrease uncertainty in large-scale coastal model predictions..."
#spatial #model #modeling #water #hydrology #hydrodynamics #vortex #sand #sediment #transport #sedimentation #sedimentology #morphodynamics #fluiddynamics #ripples #coast #coastal #research #velocimetry #suspension #experimentation #dynamics #geology #processes #geomorphology #geomorphometry #vortextrapping #sand #grains #flow #ripple #sandwaves #ripples
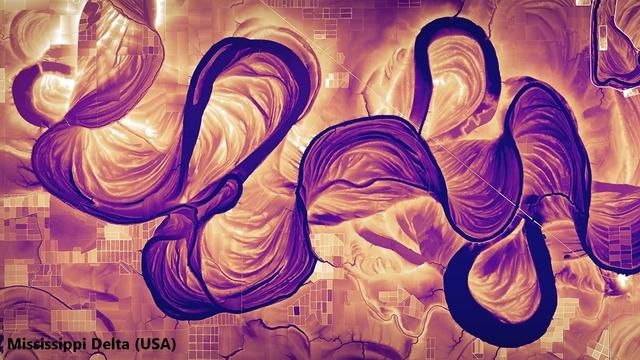
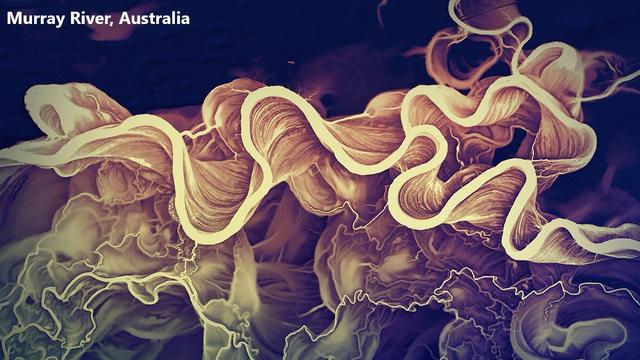
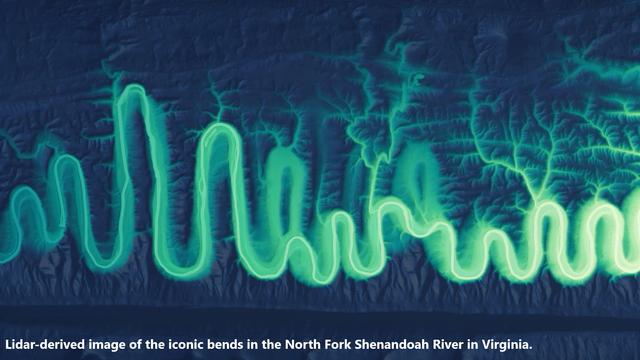
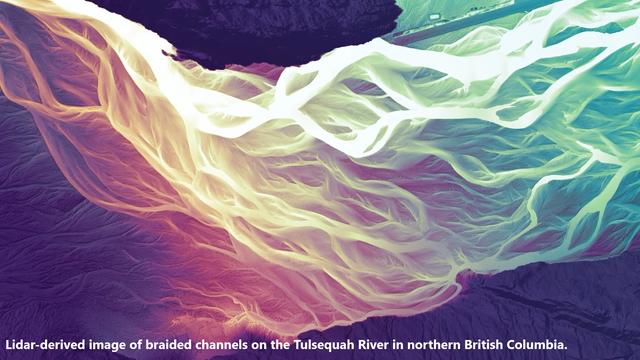
Daniel Coe’s Astonishing River Cartography
--
https://orionmagazine.org/article/daniel-coe-river-cartography/ <-- shared media article
--
https://dancoecarto.com/work <-- his website
--
[those in the spatial hydrology ‘world’ have long been incredibly impressed by Dan Coe’s imagery and cartography, here is a wonderful article on cartography & science with his visual arts quality]
“Cartographer Daniel Coe uses relative elevation data, primarily from plane-mounted lasers called lidar, to visualize Earth’s natural features, like rivers and floodplains. His stunning river maps reveal stories hidden in historical sediment and past channels carved by the water, as it twists and turns through both landscape and time…”
#GIS #spatial #mapping #DanielCoe #cartography #hydrospatial #river #riverine #imagery #representation #map #representation #science #remotesensing #LiDAR #sedimentation #flooding #riverchannel #change #spatiotemporal #gischat
#DanielCoe #fluvial #geomorphology
Professor Helps Discover Global Gap In Geologic Record
--
https://phys.org/news/2024-10-professor-global-gap-geologic.html <-- shared technical article
--
https://doi.org/10.1016/j.earscirev.2024.104912 <-- shared paper
--
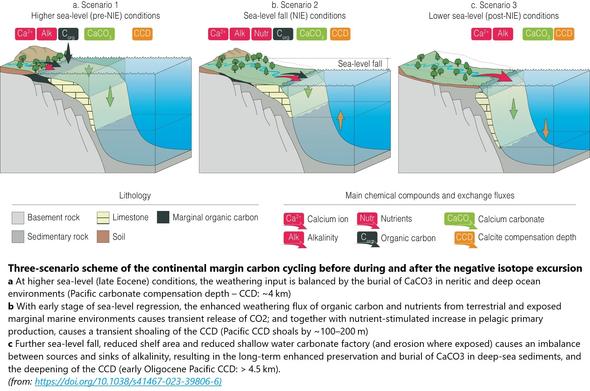
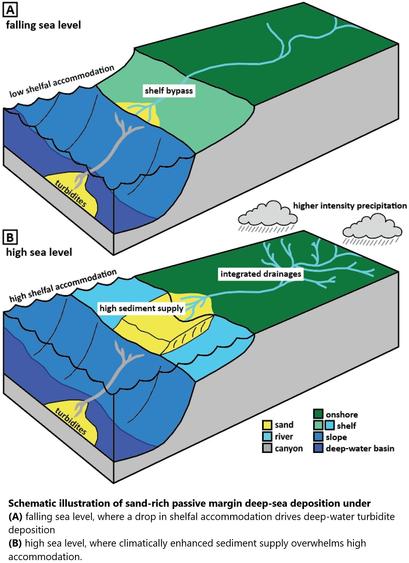
#geology #sedimentation #sediment #offshore #coast #coastal #model #modeling #sealevel #erosion #weathering #continentalshelf #geologichistory #submarine #unconformity #pelagic #marine #continentalmargin #sedimentology #siliciclastic #icehousetransition #eocene #oligocene #slope #basinfloor #submarinecanyon #masswasting #debrisflow
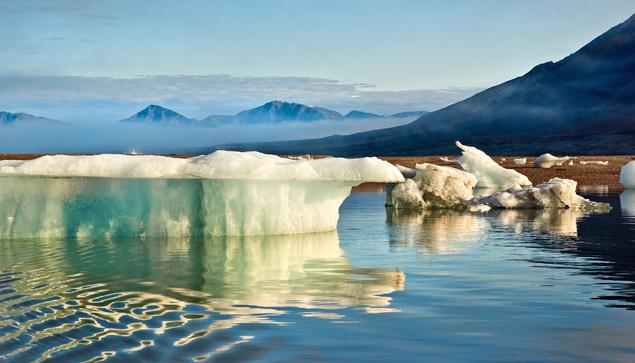
As glaciers flow, they grind down rock, creating fine sediment that dyes waterways a milky color. In Jan Erik Waider’s aerial film, we get a bird’s eye view of the result, watching pockets of sediment move downstream in pulsating waves and swirls. Along the coast, ocean waves pass over the internal ones, creating a mesmerizing crisscrossed wavescape. You can also compare Waider’s aerial footage to Roman De Giuli’s tabletop-scale films and be amazed by their similarities. (Image and video credit: J. Waider; via Colossal)
https://fyfluiddynamics.com/2024/10/colors-of-glacial-rivers/
#flowVisualization #fluidDynamics #fluidsAsArt #glacier #physics #science #sedimentTransport #sedimentation
Titan, one of Saturn’s moons, is the only other planetary body known to have liquid lakes, rivers, and seas at its surface. Whether those bodies — made up of hydrocarbons rather than water, like here on Earth — have waves is a matter of ongoing debate. What data we have from visiting spacecraft is inconclusive. So a group of researchers decided to look for the effects of wave action instead.
Beginning with a model of flooded areas similar to Titan’s, the team simulated a coastline’s erosion assuming three different situations: 1) no coastal erosion, 2) erosion from waves, and 3) uniform erosion through dissolution. Each set of conditions resulted in a very different final coastline. But, of the three, the wave-eroded coast was most similar to those seen on Titan. That’s a good indicator that, even if our spacecraft couldn’t see waves on Titan, they’re likely there. (Image credit: ESA; research credit: R. Palermo et al.; via Gizmodo)
https://fyfluiddynamics.com/2024/08/waves-lap-on-titans-shores/
#erosion #fluidDynamics #physics #science #sedimentation #Titan #waves
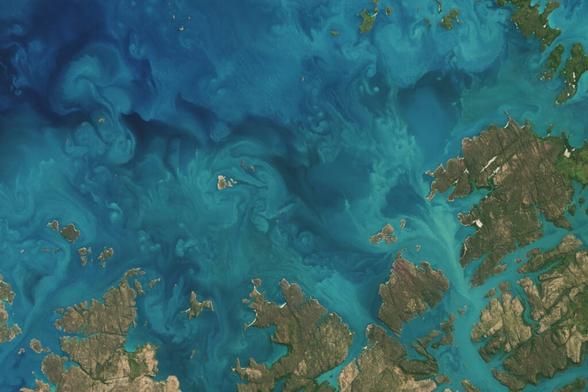
Turbulent flows feature swirling eddies over a range of sizes — the larger the size range, the higher the Reynolds number. In this satellite image, sediment highlights these eddies in shades of turquoise, showing off the complexity of the flows created where rivers, ocean, and tides meet. The eddies we see here stretch from kilometers in width down to a handful of meters, but the flow’s turbulence persists down to millimeter-scales before viscosity damps it out. (Image credit: L. Dauphin; via NASA Earth Observatory)
https://fyfluiddynamics.com/2024/08/sediment-swirls/
#eddies #flowVisualization #fluidDynamics #fluidsAsArt #physics #ReynoldsNumber #science #sedimentation #turbulence
![Figure 2 in McGowan et al. (2025): "Historical and current land use. Top-left: summary of historical maps from 1948 (Survey Department, Federation of Malaya No. 218-49, prepared from air photographs and existing, limited ground survey data). Top-right: 1985–1989 Director of National mapping 1:50 000 restricted map, Malaysia, published in 1992 and compiled from aerial photos taken in 1985 and field surveys in 1989. Bottom-left: 2002 from the mapping digitization study of Sujaul et al. (2010). Bottom-right: 2017 Google Earth imagery (image taken 3 October 2017). [Color figure can be viewed at wileyonlinelibrary.com]"](https://files.mastodon.social/cache/media_attachments/files/113/787/701/928/781/960/small/8becf2fe93181e90.jpg)
